E-ISSN:1929-7092/19 © 2019 Lifescience Global
Predicting High-Value Customers in a Portuguese Wine Company
Pedro Sobreiro
1, Domingos Martinho
2,*, António Pratas
2, Jose Garcia-Alonso
3and
Javier Berrocal
31Escola Superior de Desporto de Rio Maior, Instituto Politécnico de Santarém, Portugal 2ISLA Santarém, Portugal
3Quercus Software Engineering Group, University of Extremadura, Spain
Abstract: Wine companies operate in a very competitive environment in which they must provide better-customised services and products to survive and gain advantage. The high customer turnover rate is a problem for these companies. This work aims to provide wine companies with new knowledge about customers that help to retain the existing ones. The study applies a collected dataset from a transaction database in a medium-sized Portuguese wine company to determinate: (1) customer lifetime value; (2) cluster customer value as output (customer loyalty). The measurement of the customer lifetime value (CLV) was analysed using the Pareto/NBD model and gamma-gamma model. Clustering techniques are employed to segment customers according to Recency, Frequency, and Monetary (RFM) values. Study findings show that exists three clusters with different interest to the marketing strategies, identifying the high-value customers, to target using marketing to increase their lifetime value effectively. The implications for the marketing strategy decisions is that using techniques based on the RFM model can make the most from data of customers and transactions databases and thus create sustainable advantages.
Keywords: Customer lifetime value, clustering, wine marketing, RFM model. 1. INTRODUCTION
The researches performed showed that the use of the existing customer data in wine company databases to support marketing decisions is greatly reduced. This finding was a challenge and an opportunity to show that knowledge that can be extracted from customer data can be relevant to support marketing strategy decisions.
It is accepted that due to the increasing competition and diversification of business operations, the strategic focus on customers to gain market share is essential, and the vital issue for increasing competitiveness (Fader, 2012).
In activities where production exceeds consumption, such as the wine market, companies need to know their customers' profiles in order to develop marketing strategies that meet their interests to increase brand awareness and sales (Carlsen & Boksberger, 2015). To increase the knowledge about current customers requires new approaches to identify patterns that allow determining the characteristics of the potential value of the customers (Zhang, Liang & Wang, 2016). These perspectives raise the question, how to determine if a customer is active or not and the acceptance that customer retention is more effective than acquiring new customers, which requires an effective approach to
*Address correspondence to this author at the ISLA Santarém, Portugal; Tel: +351 243 305 880; Fax: +351 243 326 261; E-mail: p40043@islasantarem.pt
identify if a customer is still active or not. The costs of retaining customers are lower when compared to attracting new ones (Edward & Sahadev, 2011; Fornell & Wernerfelt, 1987), increasing the market share and financial returns (Watts, 2012)
The need to anticipate customer value requires different techniques according to its contractual or non-contractual settings. In non-contractual settings, customers inform the firm when they terminate their relationship; however, in non-contractual settings, a firm has to infer whether a customer is still active (Gupta et al., 2006). Contractual relationships imply a legal relationship between the customer and the company, against non-contractual settings where there is no legal relationship between the customer and the company (Bernat, 2018).
When scrutinising the customer lifetime value (CLV), Recency, Frequency and Monetary (RFM) model allow analysing the behaviour of the customer and supports the clustering of the customers according to their CLV. These techniques were the starting point of existing knowledge and are intended to be applied to the context of wine firms in order to provide them with new knowledge about customers that can help marketing strategy and to retain them. Thus, our main objectives in the present work were to the measurement of the customer lifetime value (CLV), applied clustering techniques to segment customers according to RFM values and with this obtain practical knowledge with a positive impact in the wine marketing activities.
The scheme of the paper is as follows. In the next section, we present a review of the state of the art focused on the main topics of the work. In section 3, we explain the research methodology. Section 4 presents the results, followed by the discussion in section 5, and the conclusions are represented in section 6.
2. LITERATURE REVIEW 2.1. Pareto/NBD Model
Schmittlein, Morrison and Colombo (1987) described a model called the Pareto/NBD for estimating the number of futures purchases a customer will make. The Pareto/NBD model came to be part of a larger family of variations known as buy-til-you-die (BTYD) models (Schmittlein et al., 1987), which has the assumptions that the profit per transaction is independent of the number of transactions (Glady, Baesens, & Croux, 2009).
The Pareto/NBD assumes that customer attrition (dropout or “death”) can occur at any point in calendar time (Jerath, Fader & Hardie, 2011). According to Schimettlein et al. (1987), the Pareto/NBD model allows to determine the probability that a customer with a given pattern of transactions is still active and to provide answers to four questions: (1) How many customers leave the firm now? (2) How has this customer base grown over in the last year? (3) Which individuals represent active customers? (4) What level of transactions should be expected in the next year? (Schmittlein et al., 1987). To predict the average amount spent per transaction per customer Fader, Hardie and Lee (2005a) created the gamma-gamma model that estimates the average amount spent per transaction per customer. More recently, Abe (2009) suggested the use of a hierarchical Bayesian (HB) framework, extending the Pareto/NBD model and adjusting the heterogeneity assumptions on the purchasing and death rate of the Pareto/NBD relaxing the independence assumption (Abe, 2009).
2.2. Customer Lifetime Value
The customer lifetime value (CLV) is an important concept that was described by Kotler (1974) in a seminal paper as the present value of future purchases within a time horizon. Increasing the CLV assumes the improvement in customer retention, where an increase of 1% in the retention represents almost five times greater impact on the organisation value (Gupta, Lehmann, & Stuart, 2004). The identification of the most profitable customers, aiming to redirect a larger
amount of marketing efforts towards those customers, has been a holy grail of marketing (Castéran, Meyer-Waarden & Reinartz, 2017). According to Santos and Ritchman (2016), the main idea behind CLV concept is that not all customers provide equal value to a wine firm, suggesting that the firm should focus its resources on most profitable and loyal customers. It is directly associated with predicting the future behaviour of customers, meaning that a good computation of CLV can help to serve such purpose.
2.3. RFM Model
The recency, frequency and monetary (RFM) is a model for analysing customer value. With the RFM model, decision-makers can effectively identify valuable customers and then develop marketing strategies (Wei, Lin, & Wu, 2010). RFM allows a company to analyse the behaviour of the customer and make predictions according to that behaviour (Yeh, Yang & Ting, 2009). The RFM analytic model was proposed by Hughes (1994), as a model that differentiates important customers with the following main elements:
1. The recency of the last purchase (R). R
represents recency, which refers to the interval of time between the first purchase and the last one. Shorter intervals represent larger R.
2. The frequency of the purchases (F). F
represents frequency, which refers to the number of transactions in a particular period, for example, two times of one year, two times of one quarter or two times of one month. More frequency increase F.
3. The monetary value of the purchases (M). M
represents monetary, which refers to
consumption money amount in a particular period. More spending represent bigger M. According to Wei et al. (2010) increasing the value of R and F, improves the likelihood that customers will make a new purchase with companies, also the higher the M, the more likely customers repurchase products or services.
The RFM model is a very effective method for customer segmentation (Cheng & Chen, 2009; Dogan, Aycin & Bulut, 2018). Customer segmentation can be defined as a division of a customer base into distinct and internally consistent groups with similar characteristics. It allows companies to develop different
marketing strategies according to customer characteristics (Guçdemir & Selim 2015; Peker, Kocyigit & Eren, 2017). The Ward hierarchical clustering allow to group the customers and has been widely used (Ward, 1963), which is an unsupervised
technique grouping customers with similar
characteristics in homogenous groups.
The RFM model is typically used for database marketing and direct sales and is particularly focused in the retail industries and services industries (Fader et al., 2005a). For example, Lin and Tang (2006) applied the model to analyse customers of music products. They classified homogeneous customers in a cluster. This study partitions each variable of the model to be two levels: High (H) and Low (L) level. Ravasan and Mansouri (2015) applied the RFM model to segment customers of an auto insurance company into four patterns: best, new, risk and uncertain. Maskan (2014) applied an RFM model for internet-service-provider users.
3. METHOD
The proposed research methodology includes the following major steps. The first phase was related to pre-analysis efforts which refer to data cleaning and transformation. Second, the RFM values were calculated shaping the transactional data with the customer's purchases and the RFM values were discretised in five ranges as suggested by Hughes (1994). Third, the customer lifetime value (CLV) was calculated, applying clustering techniques to segment customers according to RFM values.
The time unit used to develop the models was
months. The gamma-gamma independence
assumption was tested with the Pearson correlation between monetary value and monetary value (Fader, Hardie & Lee, 2005b). The Pareto/NBD was used to estimate the future number of transactions and the gamma-gamma model to estimate the CLV. The model was calibrated with the time period between 01-06-2017 and 31-03-2019. The period between 01-04-2019 and 12-09-2019 was used to test the model accuracy. The RFM model variables and the CLV was used to create customers clusters using Ward’s hierarchical clustering method, and the optimal number of clusters was identified using the dendrogram analysis. Before creating the clusters, the data was normalised. The principal components analysis (PCA) was applied to the variable’s recency, frequency, monetary value and CLV to reduce to two variables and allow their
representation in scatter plot with to axis (reduced variable 1 and 2).
The study was conducted in a medium-sized Portuguese wine company. This classification follows a
European Union recommendation that which
characterises as medium-sized “enterprises which employ fewer than 250 persons and which have an annual turnover not exceeding EUR 50 million, and/or an annual balance sheet total not exceeding EUR 43 million” (EU, 2003, p. 38).
The company is located in the Centre of Portugal, developing is wine production traditionally, selling manly for resale expecting to increase its exports to international markets and also exploring a store selling directly to consumers. The data extracted has 285 customers records with an average transaction value of 62.31€ and a standard deviation (SD) of 113.61€. The data corresponded to the period between June 2017 and September 2019.
Descriptive statistics were conducted to summarise the variables under analysis. Data processing was conducted using Python (Continuum Analytics, 2016), Pandas (McKinney, 2010) and NumPy (Walt, Colbert & Varoquaux, 2011). The analysis was conducted using the package Lifetimes (Davidson-Pilon et al., 2019).
4. RESULTS AND DISCUSSION
The shaping of the customer transaction data is displayed in Table 1, representing an overall perspective using RFM. The frequency of purchase, recency, customer age and monetary value of purchase are presented. The average frequency was 4.89±6.68, and recency 7.06±8.3. The average age of the customers in months was 18.76 (6.71), and their monetary value of the purchases was 78±212.57.
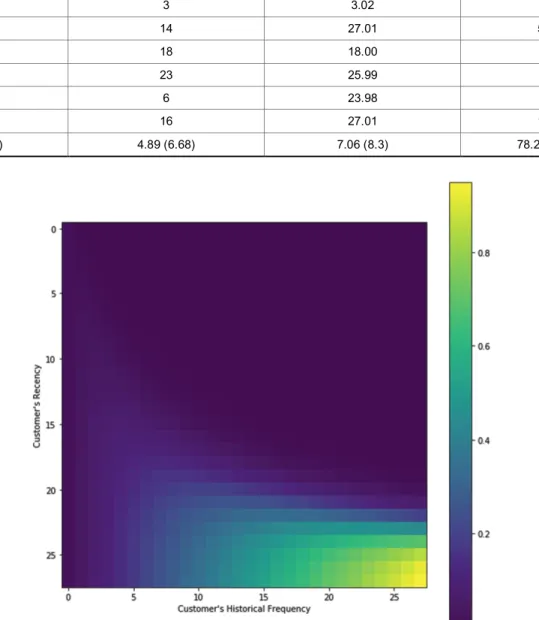
Figure 1 depicts the recency matrix, allowing to identify where are the best costumers according to the recency and frequency represented in the lighter areas with higher probabilities to buy again. A customer that bought more than ten times (historical frequency) and with purchase recency greater than 20 months have an increased probability of purchasing again. The tail also shows that a customer that bought less than ten times and with age less than 20, buys infrequently, but he might buy again.
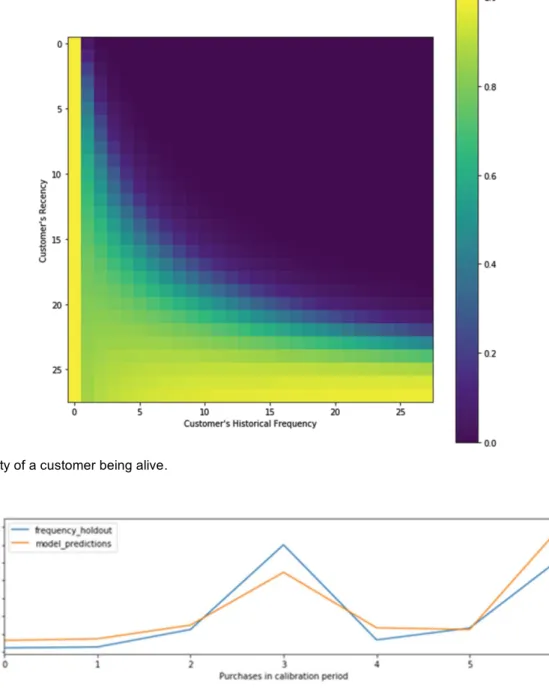
Figure 2 represents the probability of a customer being alive in non-contractual settings considering historical purchase data. The light area represents
customers with higher probabilities being alive. Customers with higher probabilities to buy again are the customers with a tail starting near the age of 5 months (the period between first purchase and last purchase) requiring an increase in the frequency to maintain their probability to repeat purchases. Customer with repeated purchases more than 15 and less 20 months have lower probabilities of being alive.
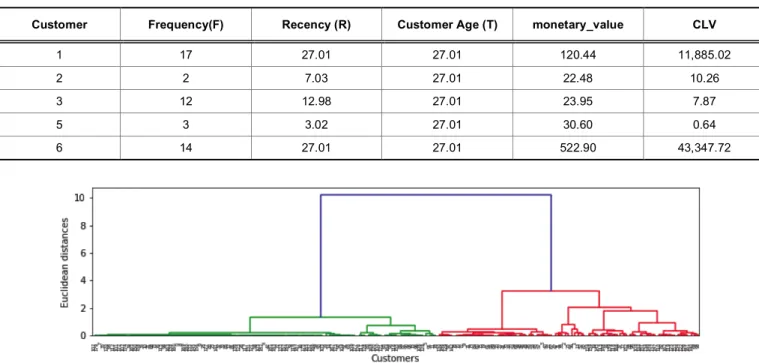
Figure 3 represents the accuracy of purchases in the test period using the calibration period from
01-06-2017 to 31-03-2019 against the test period between 01-04-2019 and 11-09-2019. As we can see, the frequency holdout and model predictions lines that represent average purchases in the holdout period tend to converge.
The developed model allows identifying the probability of a customer being alive. The probability of being alive increases as the customer purchases stabilise and drop when the customer does not buy. Figure 4 shows the probability of a customer being
Table 1: RFM Model Values for the First Ten Customers
Customer Frequency (F) Recency (R) monetary_value (M)
1 17.0 27.01 120.44 2 2 7.03 22.48 3 12 12.98 23.95 5 3 3.02 30.60 6 14 27.01 522.90 7 18 18.00 30.03 8 23 25.99 32.71 9 6 23.98 88.35 10 16 27.01 124.52 Mean (SD) 4.89 (6.68) 7.06 (8.3) 78.28 (212.57)
alive. As we can see, the probability tends to decrease as time goes on without purchases, after a period of repeated purchases.
The CLV was predicted using the data obtained in the RFM model for a time window of 12 months. The value of each customer was determined with the
Figure 2: Probability of a customer being alive.
Figure 3: Actual purchases in the holdout period vs predicted purchases.
function present in listing 1, using the default value of the discount rate of 1% of the package LifeTimes.
bgf.fit (summary_ggf ['frequency'], summary_ggf ['recency'], summary_ggf ['T'])
ggf.customer_lifetime_value (
bgf, #the model to use to predict the number of future transactions summary_ggf['frequency'], summary_ggf['recency'], summary_ggf ['T'], summary_ggf ['monetary_value'], time=12, # months
discount_rate=0.01 # monthly discount rate ~ 12.7% annually )
Listing 1: Function do determine the CLV.
The prediction for the CLV for first five customers is represented in Table 2. We can see the frequency, recency monetary value and the predicted purchases. The predicted value represents the estimated value for the future purchases in euros. The interpretation is as follows, customer 1 as present value of future purchases (CLV) of 11,885.01 euros.
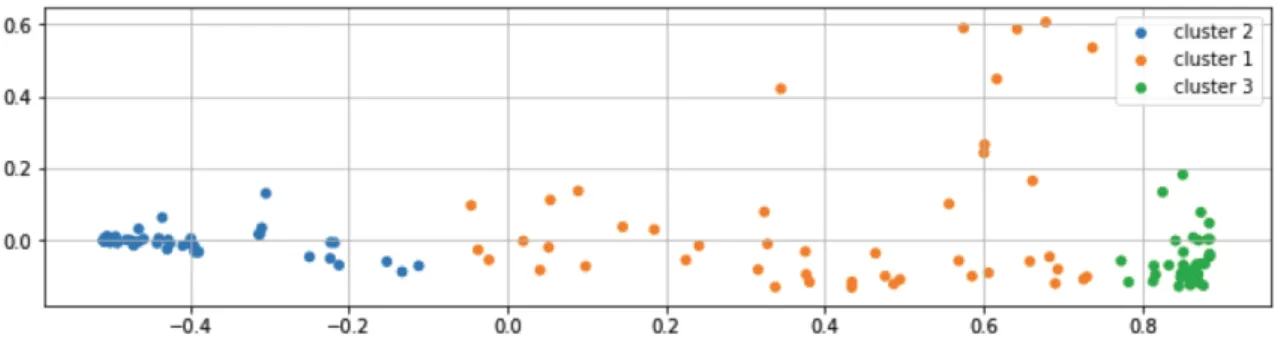
The calculated CLV and RFM values were used to cluster the customers with a similar purchase potential according to their behaviour. Using this data, we determined the optimal number of clusters using the dendrogram analysis, looking at the cut of the
dendrogram tree with a horizontal line at a height where the line can traverse the maximum distance up and down without intersecting the merging point. Although there are two options considering the Euclidean distances between approximately four and height and between two and three, identifying respectively two and three clusters, was considered three clusters represented in Figure 5.
The visualisation of the clusters provides more interpretability for a business, which is represented in Figure 6, where is visible cluster 1, cluster 2 and cluster 3. This figure represents all the customers.
Table 3 represents the customers' profiles in the clusters. Cluster 1 has a medium customer lifetime value (CLV) potential. Customer in this profile is a customer with an average CLV 36,28 euros and a standard deviation of 40,37. Cluster 2 has high CLV potential. Customer in this profile is a customer with an average CLV 10371,57 euros and a standard deviation of 20866,39. Cluster 3 has low CLV potential. Customer in this profile is a customer with an average CLV 4,11 euros and a standard deviation of 4,72.
According to Safari, Safari and Montazer (2016), customer segmentation is one of the efficient methods for managing various customers with different preferences. According to this, the suggestion is to prioritise first the customers according to their cluster,
Table 2: Calculated CLV for each Customer
Customer Frequency(F) Recency (R) Customer Age (T) monetary_value CLV
1 17 27.01 27.01 120.44 11,885.02
2 2 7.03 27.01 22.48 10.26
3 12 12.98 27.01 23.95 7.87
5 3 3.02 27.01 30.60 0.64
6 14 27.01 27.01 522.90 43,347.72
first customers in the cluster 2, with high potential, followed by medium (cluster 1) and at last lower CLV (cluster 3) representing customers with a prediction of
lower purchase values. Cluster 2 has the
characteristics of high frequency, recency and monetary values. Indicating that they are customers that shopped recently, have a high purchase frequency and monetary value. They are newer customers compared to clusters 1 and 2. Therefore, the marketing strategy should focus on their retention, considering the potential of their CLV. Cluster 3 has lower values in frequency and recency. However, their monetary values are higher than cluster 1, which could represent that this type of customer should be targeted with marketing actions to increase their frequency and consequently, their CLV. Another characteristic of this cluster is their age as customers are old (24.58 ± 2.63). Finally, cluster 1 represents customer with the lower monetary value in the clusters. However, the number of purchases and CLV are greater than cluster 3. Considering their CLV, the marketing strategy could consider their potential and develop marketing actions according to their estimated CLV.
The measurement of customer lifetime value (CLV) using the Pareto/NDB to estimate future purchases and gamma-gamma model to predict the CLV. Using the achieved results, managers may design appropriate strategies according to the predicted customer value. The importance to increase the customer value was already identified by Charters & Menival (2011) suggesting that increasing customer value could
improve the revenue for small wineries. Previous studies related the duration of the customers with the wine company increasing their CLV (Santos & Richman, 2016). From a managerial perspective, the achieved results in this winery could be considered to develop sales strategies with the customers according to their potential value.
Using this information, marketing and management strategies should be attuned and develop adequate policies to target lines of action, rewarding their customers. They should also consider developing surveys to provide insights and complement the retrieved information.
The data in this research was restricted to a single medium-sized wine company. Hence the specific settings prevent the generalisation to other contexts. Nevertheless, this research was designed to investigate and demonstrate the appropriateness the RFM model and the CLV to identify the customer potential in future sales, allowing to identify clusters that could be used to specific lines of action to increase sales.
5. CONCLUSIONS
This work shows that it is possible to provide traditional companies with tools that allow them to change their business strategies, contributing to the knowledge related to the sales marketing strategies of wine-producing companies. In this perspective, the use of data about wine customer transactions from
Figure 6: Customer clusters according to the RFM values and CLV. Table 3: Cluster Profiles
Cluster n Frequency Mean (SD) Mean (SD) Recency Mean (SD) T Monetary Value Mean (SD)
Predict purchase Mean (SD) CLV Mean (SD) Profile 1 45 4.93 (4.37) 6.19 (4.68) 20.21 (4.91) 49.51 (45.28) 0.19 (0.12) 36.28 (40.37) Medium CLV 2 107 10.05 (7.71) 15.17 (7.46) 18.74 (6.76) 161.53 (322.70) 4.63 (3.46) 10371.57 (20966.39) High CLV 3 36 2.53 (1.99) 2.86 (1.99) 24.58 (2.63) 75.52 (91.36) 0.07 (0.05) 4.11 (4.72) Low CLV
transaction databases of the wine companies is one opportunity to develop marketing strategies that adopt the analysis based on CLV consumer’s behaviour.
There are several implications related calculation of CLV to wine business management decision making. First, the CLV can be used to establish and extend the relationship with wine customers. Second, wine managers have access to the value of the contribution of the customer. Therefore, the promotional and sales activities can be focused on those customers. Another consequence of the determination of CLV is that the wine managers can focus their marketing efforts on the retention of the most valuable customers, which requires less effort and return better results compared to efforts for acquiring new customers.
Based on the developed study, wine companies can develop and implement customer-centric strategies for maximising each cluster lifetime profit. The calculation of the CLV for each cluster of customers, companies that have limited resources, can focus on those clients who bring maximum benefit instead than treating all the customers in the same way. Managers can consider targeting wine selling to customers that are more valuable. Wine companies can develop customer-specific marketing strategies addressing the customers differently and increase their companies’ profit.
Forthcoming studies should aim at replicating this study in other companies or countries, in order to examine similarities or differences with present results and improve the adopted models to achieve better results.
REFERENCES
Abe, M. (2009). “Counting Your Customers” One by One: A Hierarchical Bayes Extension to the Pareto/NBD Model.
Marketing Science, 28(3), 541–553.
https://doi.org/10.1287/mksc.1090.0502
Bernat, J. (2018). Modelling Customer Lifetime Value in a
Continuous, Non-Contractual Time Setting (Erasmus
University Rotterdam). Retrieved from https://thesis.eur.nl/pub/45923/Bernat.pdf
Carlsen, J., & Boksberger, P. (2015). Enhancing Consumer Value in Wine Tourism. Journal of Hospitality & Tourism Research,
39(1), 132–144.
https://doi.org/10.1177/1096348012471379
Castéran H., Meyer-Waarden L., Reinartz W. (2017) Modeling
Customer Lifetime Value, Retention, and Churn. In:
Homburg C., Klarmann M., Vomberg A. (eds) Handbook of Market Research. Springer, Cham.
https://doi.org/10.1007/978-3-319-05542-8_21-1
Charters, S., & Menival, D. (2011). Wine Tourism in Champagne.
Journal of Hospitality & Tourism Research, 35(1), 102–118.
https://doi.org/10.1177/1096348010384597
Cheng, C.-H., & Chen, Y.-S. (2009). Classifying the segmentation of customer value via RFM model and RS theory. Expert
Systems with Applications, 36(3, Part 1), 4176–4184.
https://doi.org/10.1016/j.eswa.2008.04.003
Continuum Analytics. (2016). Anaconda Software Distribution. Retrieved 20 July 2017, from https://www.anaconda.com/ download/
Davidson-Pilon, C., Kalderstam, J., Zivich, P., Kuhn, B., Fiore-Gartland, A., Moneda, L. & Rendeiro, André F. (2019).
CamDavidsonPilon/lifelines: V0.21.3.
https://doi.org/10.5281/zenodo.3240536
Dogan, O., Aycin, E. & Bulut, Z. (2018). Customer Segmentation by Using RFM Model and Clustering Methods: A Case Study in Retail Industry. International Journal of Contemporary
Economics and Administrative Sciences ISSN: 1925–4423,
Vol. 8, Issue 1, 1-19.
Edward, M., & Sahadev, S. (2011). Role of switching costs in the service quality, perceived value, customer satisfaction and customer retention linkage. Asia Pacific Journal of Marketing
and Logistics, 23(3), 327–345.
https://doi.org/10.1108/13555851111143240
EU (2003). Commission Recommendation of 6 May 2003 concerning the definition of micro, small and medium-sized enterprises.
Official Journal of the European Union, L124, 36-41.
Fader, P. S., Hardie, B. G. S., & Lee, K. L. (2005a). Implementing the
BG/NBD Model for Customer Base Analysis in Excel. 8.
Fader, P. S., Hardie, B. G. S., & Lee, K. L. (2005b). RFM and CLV: Using Iso-Value Curves for Customer Base Analysis. Journal of Marketing Research, 42(4), 415–430.
https://doi.org/10.1509/jmkr.2005.42.4.415
Fader, P. (2012). Customer Centricity: Focus on the Right Customers
for Strategic Advantage. Wharton Executive Essentials.
Fornell, C., & Wernerfelt, B. (1987). Defensive Marketing Strategy by Customer Complaint Management: A Theoretical Analysis.
Journal of Marketing Research, 24(4), 337–346.
https://doi.org/10.2307/3151381
Glady, N., Baesens, B., & Croux, C. (2009). A modified Pareto/NBD approach for predicting customer lifetime value. Expert
Systems with Applications, 36(2, Part 1), 2062–2071.
https://doi.org/10.1016/j.eswa.2007.12.049
Guçdemir, H. & Selim, H. (2015). Integrating multi-criteria decision making and clustering for business customer segmentation.
Industrial Management & Data Systems Vol. 115 No. 6,
2015, 1022-1040.
https://doi.org/10.1108/IMDS-01-2015-0027
Gupta, S., Hanssens, D., Hardie, B., Kahn, W., Kumar, V., Lin, N., Sriram, S. (2006). Modeling Customer Lifetime Value.
Journal of Service Research, 9(2), 139–155.
https://doi.org/10.1177/1094670506293810
Gupta, S., Lehmann, D. R., & Stuart, J. A. (2004). Valuing Customers. Journal of Marketing Research, 41(1), 7–18. https://doi.org/10.1509/jmkr.41.1.7.25084
Hughes, A. M. (1994). Strategic database marketing: The masterplan
for starting and managing a profitable, customer-based marketing program. Chicago, Ill: Probus Pub. Co.
Jerath, K., Fader, P. S., & Hardie, B. G. (2011). New Perspectives on Customer “Death” Using a Generalization of the Pareto/NBD Model. Marketing Science, 30 (5), 866-880.
https://doi.org/10.1287/mksc.1110.0654
Kotler, P. (1974). Marketing during Periods of Shortage. Journal of
Marketing, 38(3), 20.
https://doi.org/10.2307/1249846
Lin, C.S. and Tang, Y.Q. (2006). Application of incremental mining and customer’s value analysis to collaborative music recommendations. Journal of Information, Technology and
Society, Vol. 6 No.1, 1-26.
Maskan, B. H.(2014). Proposing a model for customer segmentation using WRF Manalysis (case study: an ISP company).
International Journal of Economy, Management and Social Sciences, Vol. 3 No.12,pp.77-80.
McKinney, W. (2010). Data structures for statistical computing in python. Proceedings of the 9th Python in Science
Conference, 445, 51–56. SciPy Austin, TX.
Peker, S., Kocyigit, A. & Eren,p. (2017). LRFMP model for customer segmentation in the grocery retail industry: a case study. Marketing Intelligence & Planning Vol. 35 No. 4, 544-559. https://doi.org/10.1108/MIP-11-2016-0210
Ravasan, A.Z. and Mansouri, T. (2015), A fuzzy ANP based weighted RFM model for customer segmentation in auto insurance sector, International Journal of Information
Systems in the Service Sector, Vol. 7, No. 2, 71-86.
https://doi.org/10.4018/ijisss.2015040105
Safari, F., Safari, N. & Montazer, G. (2016). Customer lifetime value determination based on RFM model. Marketing Intelligence &
Planning, Vol. 34 Issue: 4, pp.446-461.
https://doi.org/10.1108/MIP-03-2015-0060
Santos, M., & Richman, V. (2016). Analyzing the effects of short and long term customer relationship on the wine customer lifetime value. In K. Lee (Ed.), Strategic Winery Tourism and
Management: Building Competitive Winery Tourism and Winery Management Strategy (pp. 143–154). CRC Press.
Schmittlein, D. C., Morrison, D. G., & Colombo, R. (1987). Counting Your Customers: Who Are They and What Will They Do Next? Management Science, 33(1), 1–24. Retrieved from JSTOR.
https://doi.org/10.1287/mnsc.33.1.1
Venkatesan, R. (2008). Cluster Analysis for Segmentation (SSRN Scholarly Paper No. ID 1280638). Retrieved from Social Science Research Network website: https://papers.ssrn.com/ abstract=1280638
Walt, S. van der, Colbert, S. C., & Varoquaux, G. (2011). The NumPy Array: A Structure for Efficient Numerical Computation.
Computing in Science & Engineering, 13(2), 22–30.
https://doi.org/10.1109/MCSE.2011.37
Ward, J. H. (1963). Hierarchical Grouping to Optimize an Objective Function. Journal of the American Statistical Association, 58(301), 236–244.
https://doi.org/10.1080/01621459.1963.10500845
Watts, H. (2012). A Psychological Approach to Predicting
Membership Retention in the Fitness Industry (PhD).
University of Worcester.
Wei, J.-T., Lin, S.-Y., & Wu, H.-H. (2010). A review of the application of RFM model. African Journal of Business Management,
4(19), 4199–4206.
Yeh, I.-C., Yang, K.-J., & Ting, T.-M. (2009). Knowledge discovery on RFM model using Bernoulli sequence. Expert Systems with
Applications, 36(3), 5866–5871.
https://doi.org/10.1016/j.eswa.2008.07.018
Zhang, H., Liang, X., & Wang, S. (2016). Customer value anticipation, product innovativeness, and customer lifetime value: The moderating role of advertising strategy. Journal of
Business Research, 69(9), 3725–3730.
https://doi.org/10.1016/j.jbusres.2015.09.018
Received on 26-11-2019 Accepted on 17-12-2019 Published on 31-12-2019
DOI: https://doi.org/10.6000/1929-7092.2019.08.155
© 2019 Sobreiro et al.; Licensee Lifescience Global.
This is an open access article licensed under the terms of the Creative Commons Attribution Non-Commercial License (http://creativecommons.org/licenses/by-nc/3.0/) which permits unrestricted, non-commercial use, distribution and reproduction in any medium, provided the work is properly cited.