i
UNDERSTANDING THE INFLUENCE OF INTERNET
OF THINGS (IOT) ON INDIVIDUAL PERFORMANCE
Tiago Miguel Ribeiro Martins da Costa
Dissertation presented as partial requirement for obtaining
the Master’s degree in Information Management
i
20
18 Title: Understanding the influence of internet of things (IoT) on individual performance
Tiago Miguel Ribeiro Martins da Costa
ii
NOVA Information Management School
Instituto Superior de Estatística e Gestão de Informação
Universidade Nova de Lisboa
UNDERSTANDING THE INFLUENCE OF INTERNET OF THINGS (IOT)
ON INDIVIDUAL PERFORMANCE
by
Tiago Miguel Ribeiro Martins da Costa
Dissertation presented as partial requirement for obtaining the Master’s degree in Information Management, with a specialization in Marketing Intelligence
Advisor / Co Advisor: Professor Tiago Oliveira
iii
ABSTRACT
Nowadays a significant part of the objects (things) surrounding us have embedded technology like sensors, wireless, communication, and data analysis capabilities. Everyday digital artifacts lead us to information based on artifacts known as the Internet of things (IoT). The growing interest in these digital everyday artifacts from end-users, and their impact on use and individual performance were the catalyst for this research. This study aims to understand the perceived value influencing the use of IoT on individuals' performance. We suggest combining the task-technology fit (TTF) and the value-based adoption model (VAM) to evaluate the effect of IoT on individual performance. In this study we will implement an online questionnaire, which will be addressed to an IoT user’s audience. To test the model we used 303 valid responses. Findings suggest that TTF, use, user satisfaction, and perceived usefulness are important drivers to explain IoT individuals’ performance. Moreover, our results reveals that age moderates the relationship between perceived benefits and individual performance. Understanding the implication of IoT on individual performance will foment new insights and advantages for IoT managers and attract potential users.
KEYWORDS
iv
INDEX
1.
Introduction ... 1
2.
Theoretical Background ... 3
2.1.
The concept of IoT ... 3
2.2.
The assumption of the TTF model ... 4
2.3.
Value-based adoption model ... 5
2.4.
Integrating TTF and VAM models ... 5
3.
Research model ... 6
4.
Methodology ... 10
4.1.
Measurement ... 10
4.2.
Data ... 10
5.
Results... 11
5.1.
Measurement model ... 11
5.2.
Structural model ... 12
6.
Discussion ... 14
6.1.
Theoretical implications ... 14
6.2.
Practical implications ... 15
6.3.
Limitations ... 16
7.
Conclusion ... 17
8.
Bibliography ... 18
9.
Appendix A ... 23
v
LIST OF FIGURES
Figure 1 – Research Model ... 6
Figure 2. a – Moderation effect of age on user satisfaction to explain individual performance
... 15
Figure 2. b – Moderation effect of age on perceived usefulness to explain individual
performance ... 15
vi
LIST OF TABLES
Table 1 – Sample Characteristics... 10
Table 2 – Means, standard deviations, correlations, and reliability and validity measures of
latent variables ... 12
Table 3 – PLS loading and cross loading ... 12
Table 4 – Parameters estimates, hypothesis, beta values, T-values and R
2... 13
vii
LIST OF ABBREVIATIONS AND ACRONYMS
AVE Average variance extractedCA Cronbach’s alpha
CR Construct reliability
ERP Enterprise resource planning
ICT Information and communication technology
IndvP Individual performance IoT Internet of things
IP Internet protocol
IS Information systems
IT Information technology
LMS Learning management system
PLS Partial least squares
PrcvF Perceived fee PrcvR Perceived risk
PrcvU Perceived usefulness SCM Supply-chain management
SD Standard deviation
SEM Structural equation modeling
TaskC Task characteristics TechC Technology characteristics TTF Task technology fit
Use Use
UserS User satisfaction
1
1. INTRODUCTION
In recent years, the digitalization of everyday artifacts, sensors, applications, coherent networks and a global architecture infrastructure make the vision of the Internet of things (hereinafter IoT) an inevitable probability (Koren & Klamma, 2018). The term IoT was firstly established by Ashton in 2009 when he asserted that our economy, society, and survival are not based on mere perceptions or information they are mostly being interpreted as things – intelligent system of systems (Albalawi, Mohanty, & Kougianos, 2016). Hereby, everyday artifacts are becoming more and more important in individuals' lives and, consequently, playing a more important role in their perceived value and performance.
No common standard or definition of IoT seems to exist. However, it can be inferred that it refers to the network of dedicated physical objects (things) that contain embedded technology to sense or interact with their inner or outer environment (Yoo, 2010). IoT encompasses an ecosystem that includes mobile, home, embedded applications, communication, things, and data analysis from which extracting meaningful information is viable (Rivera & Van der Meulen, 2014). The IoT platform remains as a peak of inflated expectations in accordance with the Gartner Hype Cycle 2017. There is a heightened discussion about the reasons for adopting this innovative technology, especially from the organizational point of view (Christensen, 2013).
Nonetheless, one major theoretical gap urges to be answered: Does the IoT technology perceived value enhances the end user individual performance? This research aims to fill this gap by analyzing a set of determinants for the use of IoT by individuals and the impact on their everyday performance. It is extensively recognized that IoT use is affected by more than the core innovation itself (Kim, Chan, & Gupta, 2007; Lyytinen & Rose, 2003). User decisions might be influenced by the perceived performance gathered by each individual (Goodhue & Thompson, 1995). This interrelationship between the individual usage of IoT and its performance expectation leads towards what Campbel, 1993, suggests that performance is – what one is prepared to do - and do well. Overall, performance is not always described by the action itself but by subjective mechanisms and evaluative processes. IoT likewise can be an important source of individual performance improvement, leading to feelings of accomplishment and self-management (Sonnentag & Frese, 2002). In this study, we use the terminology of individual performance as the purpose of expressing the idea of IoT efficiency and effectiveness in individuals’ lives when performing everyday tasks.
The contribution of this study is threefold. Firstly, we have pinpointed how IoT task and technology characteristics affect individual performance. In order to understand how IoT use influence individual performance a comprehensive research has been carried (Hsu & Lin, 2016; Kim et al., 2007). Henceforth, we aim to define how tasks and technology characteristics influence IoT use. Secondly, we intend to demonstrate the relevance of IoT in individual performance (Tam & Oliveira, 2018). Using IoT technology embedded capabilities from our daily life devices increases individual performance due to more accurate, safer, efficient, and critical data-driven actions (Martins, Oliveira, & Popovič, 2014). Lastly, we have integrated TTF and VAM models in order to better understand how IoT perceived value affects the use and influences end-users’ individual performance (Kim et al., 2007). Taking into account age as a primary moderator of end-users perceived benefits may help us illustrate their expectations and attitudes against IoT.
2 This study will be organized as follows. Firstly, we have the literature review, that will provide an important theoretical background context related with IoT and individual performance. Next, we will describe the research model as well as the hypothesis. Afterwards, we will invoke the data analysis and the results followed by the theory and managerial discussion insights, limitations, and suggestions for future research.
3
2. THEORETICAL BACKGROUND
2.1. T
HE CONCEPT OFI
OT
In the last decade, we have seen unprecedented digitalization. This was initially used by organizations to improve their performance gains, their efficiency and profits compared to competitors using ERP, SCM, etc., in premise software (Barua, Konana, Whinston, & Yin, 2004). Nowadays companies can analyze all data, even that obtained from the smallest object or component
(Lee & Xia, 2010). Physical things have embedded technology capable of generating large amounts of
data (Baesens, Bapna, Marsden, Vanthienen, & Zhao, 2016). Each organization, simply by using this IoT technology, is better enabled to understand specific characteristics and measure its correspondent usage and performance (Malhotra, Melville, & Watson, 2013). This development has been accompanied by an increasing transference of these technological innovations to end-users. Today it is possible to find it in use in physical objects (things) such as wearables, mobile devices, vehicles, etc. (Vermesan & Friess, 2013). Even buildings have embedded technology capabilities (sensors and integrated architectures) to gather, transfer, and analyze data and, autonomously, take the convenient actions (Hsu & Lin, 2016). The increased use of IoT, in the future, will move us towards an imperative necessity of having IoT technology embedded in every device (Virkki & Chen,
2013).
Since its first appearance, Ashton (2009) asserted that, knowing when things are obsolete, need to be replaced or repaired can largely enhance performance, reduce waste and also costs, that is to say, things need to provide computers the knowledge of everything in it and to analyze their constant drain of data. IoT is drastically changing the world, just as it happened with the internet. Chui et. al.,
(2010) define IoT as the wired and linked networks, typically through different connected devices
that use the same Internet Protocol (IP), that connects different devices embedded technology. Tsai,
Lai, & Vasilakos, (2014) posit that, with IoT, all things seem to be going towards an integrated
communicational system where academics, industries, and governments will be capable to augment their performance as a result of different devices’ data gathering. Following the same train of thought Hsieh & Wu, (2018) states that IoT is the internal technology installed in physical objects – things – that are capable to merge, sense and interact with the external environment. It encompasses things, communication, applications and data analysis ecosystems. As far as we know the discussion surrounding "IoT" appears so far to have been conducted more from a technical rather than through a day-to-day practical perspective. For the purpose of this research we will adopt
Dijkman et. al., (2015) IoT definition, that is IoT is the communication technology embedded in
everyday objects – equipped with sensors – connected via the internet. We believe this relates more accurately with the individual performance as opposed to the other definitions which are more in line with the corporate environment.
By 2020, the major users will be utility companies followed by manufacturing and government. A total of 1.7 billion IoT units will be installed (Shelke, Malhotra, & Mahalle, 2018). By 2025, it is estimated that we will have 25 billion IoT connected things. According to Marinissen et al., (2016) it is estimated that IoT technology will represent the equivalent to 11 percent of the world’s economy (3.9 to 11 trillion US Dollars). However, as Tsai et al., (2014) assert, IoT has some issues to be addressed: (1) IoT entails an integrated foundation that allows standardizations which are not being easy to put into practice; (2) providing an entire IoT service means a redesign of the current network, architectures,
4 and means of communication between devices; (3) security and privacy issues still exist; (4) and little is known about the fee to be applied. These issues leave open questions and part of them will be discussed further in this research.
Tam & Oliveira (2016) postulated that innovative technologies can be responsible for time-saving and individual performance enhancements. The same might be valid for IoT usage. Following what we have discussed above, IoT is an embedded technology immediately available in physical objects. For this reason, the user does not have to have any technical knowledge but has just to use the devices. As this research is focused on the individual's performance we have adopted what Sonnentag & Frese, (2002) affirm; performance is not only crucial for the organization; it is also important for the individual. It can originate feelings of amusement, dexterity, and satisfaction. Contrariwise frustration and discredit feelings can be considered a result of poor accomplishment or failure in achieving defined goals (Lu, Papagiannidis, & Alamanos, 2018). By using today's everyday physical objects it is possible to obtain and measure an amount of data with the embedded technology, which can lead each and every individual to a high level of individual performance (Tam & Oliveira, 2018). As a result of what was stated before and because the scope of our research is focused on the influence of IoT on individual’s performance and their distinctive perspectives we have combined two broad theories: the TTF model (Goodhue & Thompson, 1995), and the VAM model (Kim et al.,
2007). Each model brings to light different strengths and the theoretical background supports them
as well. The TTF model had been validated and enhanced when combined with other theories as mobile work support (Yang, Liu, Li, & Yu, 2015), learning management systems (LMS) for performance analysis (McGill & Klobas, 2009), and m-banking (Tam & Oliveira, 2018), while the VAM model considers the importance of the perceived value taking into account the relationship established between benefits and sacrifices overall as a way to define the end-user value maximization of this cutting-edge technology. The confluence of both models constructs also enhances our comprehension of IoT use and individual performance. To the best of our knowledge, this is the first time these models are combined to understand the IoT effect on individual performance. We will use the following subsections to argue the reason that has driven us to take into consideration these theories in place of others.
2.2. T
HE ASSUMPTION OF THETTF
MODELIn DeLone & McLean, (1992) IS Success Theory: The Quest for the Dependent Variable, they summarize several papers related with information systems/information technology (IS/IT) to explain the factors behind the IS Success. These author's state that jointly and singularly system quality and information quality affect both use and user satisfaction, subsequently will have a repercussion on individuals’ performance (Tam & Oliveira, 2016). Years later, with constant and prominent progress in IS/IT Goodhue & Thompson, 1995 developed the TTF model (Figure 1). The authors hold that the technology used in a specific task has a positive or negative impact on individual performance when there is consistency between the task and the technology characteristics and both support and fit users requirements. In IS/IT it is crucial that both task and technology characteristics are aligned to better perform a specific task (Tam & Oliveira, 2018). Accordingly, with Maruping & Agarwal, (2004) peoples’ preferences change quickly with the technological progress and with it there’s a constant shift in the TTF. As a side effect, the TTF has become a powerful model to explain the dynamics behind the tech industry and its continuous drive to innovate. TTF has been combined with other
5 theories to extend its potential to demonstrate and predict other outcomes. In the following paragraph, we will present the VAM model theoretical basis to explain IS/IT perceived value determinants.
2.3. V
ALUE-
BASED ADOPTION MODELThe VAM Model analyses the adoption of IS/IT from the value maximization point of view (Kim et al.,
2007). To the best of our knowledge, little debate has been devoted to the IS/IT value maximization
aspect of IS/IT in line with the most prominent economics and marketing research (Hoehle &
Venkatesh, 2015; Fichman, Dos Santos, & Zheng, 2014). Consequently, the VAM model explores the
benefits (user satisfaction and perceived usefulness) and sacrifices (perceived risks and perceived fee) as users’ perceived value. The perceived value is getting more attention especially regarding the number of positive outcomes, such as customer loyalty, behavioral intentions, and emotional value, despite the technological service chosen (Brief & Aldag, 1977; Pura, 2005).
Kim et al., (2007) identify two influential beliefs: perceived benefits - derived from the cognitive evaluation theory (Deci, 1971) and perceived sacrifices. Perceived benefits can be classified as being driven by extrinsic and intrinsic subsystems, while perceived sacrifices are both monetary and non-monetary. As explained by Hsu & Lin, (2016) perceived value is affected by perceived benefits and perceived sacrifices. Despite the growing fascination with the use of information and communication technology (ICT) on an individual level, the technology acceptance model (TAM) has been increasingly used to illustrate the information technologies behavioral adoption (Xu & Du, 2018). Lim et al., (2018) on the other hand, posited that TAM might explain better the behavioral adoption from the organizational point of view rather than focusing on an individual context. For this reason, we will use VAM to understand the impact of IoT in individual’s performance. Thus, the VAM model approach will support and focus our research on the consumers’ usage of this innovate technology.
2.4. I
NTEGRATINGTTF
ANDVAM
MODELSThe TTF model (Goodhue & Thompson, 1995) and the VAM model (Kim et al., 2007), consider different dimensions and brought to our attention the distinctive perspectives on the how individuals’ performance can be impacted by each user perceived value of IoT. Mutually both models seem to have strengths and be complementary. It is our assumption that by combining both models we will be able to understand better the user perspective of IoT technology fit and its effects on individual performance. The VAM model examines IT adoption behavior based on the effect of benefits and sacrifices on perceived value trade-off (Green, McKinney Jr., Heppard, & Garcia, 2018). The TTF model combines task and technology characteristics in its influence on use and performance impact (Tam & Oliveira, 2016).
6
3. RESEARCH MODEL
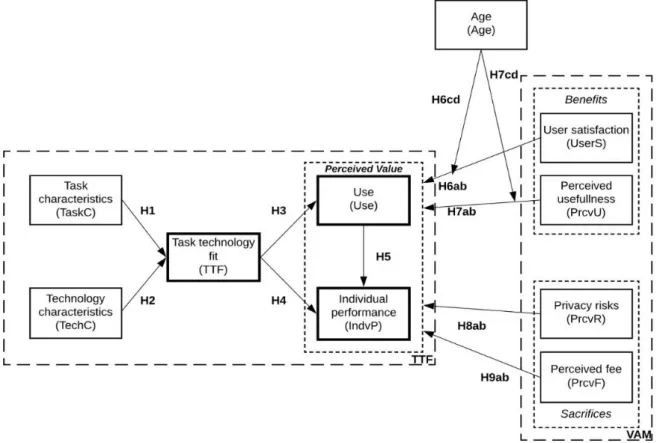
We have combined the TTF and VAM models. VAM model explains technology adoption where users are simultaneously the player and the consumer and brings the value maximization to the equation (Calvarda & Jeske, 2018) and a technology-to-performance model (TTF) that incorporate individual perceptions, tasks and technology characteristics, tasks, and the individual user, as main individual performance descriptive variables (Tam & Oliveira, 2018). We believe this study will be beneficial to future researchers in the individual performance field and may provide more insights on IoT usage. The Figure 1 illustrates the research model based on TTF and VAM models.
Figure 1 – Research Model
As stated by Goodhue & Thompson, (1995) TTF theory advances that when IS/IT correspond to the tasks the user must perform, there is a better probability of a positive impact on individual performance. If the task and the technology are aligned, the user will perform the task better and use the tool or technology for this task more often. If the user ends up having a beneficial experience (Tam & Oliveira, 2016), then we predict that TTF will influence positively the use and inherently impact the individual performance. As stated previously, in information systems we have a huge variety of tools and technologies whilst people’s preferences change quickly with technological progress (Calvarda & Jeske, 2018). In order to test the reasons behind the usage of IoT and its effect in individual’s performance, we propose the following hypothesis:
7
H2. User evaluation of technology characteristics will positively affect task-technology fit
In accordance with the literature review, the TTF model operates at the individual level and, as a side effect, TTF has become a powerful model to explain the dynamics behind the technology industry and its continuous drive to innovate. Hence, by having a day-by-day device with IoT technology embedded allowing useful data collection everywhere/anywhere even in real time will lead the end-user to enjoy using the device and (inherently by analyzing the collected data) promote individual performance enhancements (Goodhue & Thompson, 1995; Liu et. al., 2017). Accordingly,
H3. Task-technology fit positively influence the use of IoT
H4. Task-technology fit positively influence individual performance
As this research is focused on individual performance we have adopted Sonnentag & Frese, (2002) view; performance is not only crucial for the organization; it is also important for the individual. It can be considered a cause of satisfaction and mastery feelings. Contrarywise, it can be the main cause for dissatisfaction when one’s goals fail or are poorly accomplished. Following this assumption IoT use may impact individual performance. Thus, we hypothesize:
H5. The use of IoT influences positively individual performance
Perceived value can be coined as a “consumer’s overall assessment of the utility of a product (or service) based on perceptions of what is received and what is given. Represents the total utility as the net benefits (perceived benefits vis-à-vis perceived sacrifices)” (Sweeney & Soutar, 2001). Accordingly, the most common “definition of value is the ratio or trade-off between quality and price"; between "give" and "get". However, in the end everything is based on end-users percetpion of the perceived benefits and sacrifices of IoT services (Lu et al., 2018). At a certain extent, perceived value can easily be confused with satisfaction (e.g., meeting customers’ needs) (Xu & Du, 2018) but they often occur in different stages of the purchase process: perceived value is more volatile and occurs more frequently during the pre-purchasing stage and it can be inferred without the product or service being bought or used. In our research we have considered perceived value as the relationship between use and individual performance simultaneously influenced by the perceived benefits and perceived sacrifices (Hunt, 1977). Having considered this, in the literature user satisfaction is coherently considered to be part of the post-purchase and/use evaluation which is immediately dependent on the experience of having used the product or service (Mouloua, 1997; Woodruff, 1997) . Hence, we propose to test the following hypotheses:
H6a. The user satisfaction of IoT has a positive influence on IoT use
H6b. The user satisfaction of IoT has a positive effect on individual performance
IoT use will be affected by the age of the end-user (Sebastian et al., 2017). Therefore, the oldest users will be more sensitive to usability or to the actual satisfaction of the devices with IoT embedded. On the other hand the perceived usefulness is shown to be more attractive amongst the youngest users. Which leads us to conclude that user’s age is directly related with the perceived benefits practicality of the technology (Venkatesh, Thong, & Xu, 2012). Thus, we hypothesize the following.
8
H6c: Age will moderate the effect of user satisfaction on use, such that the effect will be stronger
among younger.
H6d: Age will moderate the effect of user satisfaction on individual performance, such that the effect
will be stronger among younger.
We have adopted the perceived usefulness definition of Venkatesh, (2012), where people tend to use or not IoT technology to “the extent they believe it will help them perform better”. Past research has already identified that perceived usefulness represents a positive impact in the perceived value of an application (Hsu & Lin, 2016; Kim et al., 2007). Which means, by using our daily devices with IoT technology embedded the end-user expects, to a certain extent, a particular enhancement on his/her individual performance. This will then generate, in our perspective, positive impacts on individual performance.
H7a. The perceived usefulness of IoT has a positive influence on IoT use
H7b. The perceived usefulness of IoT has a positive effect on individual performance
As cutting-edge technologies as IoT will be amplified by the age of the users, consequently and as previously mentioned, the young users will take into consideration the usability of the technology and on other hand the old users will be less sensitive to this innovative technologies and will relate better with the satisfaction. In both cases the impact on use and individual performance will be moderated by age (Bhattacherjee, 2001; Venkatesh, et. al., 2012).
H7c: Age will moderate the effect of perceived usefulness on use, such that the effect will be stronger
among younger people.
H7d: Age will moderate the effect of perceived usefulness on individual performance, such that the
effect will be stronger among youngerpeople.
In our research we purpose two perceived sacrifices which are privacy risk and perceived fee. In accordance with Jung & Park, (2018) the perceived sacrifices can be monetary and nonmonetary. Privacy risk is considered an individual’s belief regarding loss of confidentiality and personal identifying information through the use of devices with IoT technology embedded (Maarof, Senhadji, Labbi, & Belkasmi, 2018). The main concern of end-users related with embedded IoT technology devices are the data collection without prior notice, dishonest use of personal information, and unauthorized profit retained by accessing to personal data by the IoT service providers (providers secondary intentions) (Hsu & Lin, 2016). Therefore, we propose the following:
H8a. The privacy risk of IoT has a negative influence on IoT use
H8b.The privacy risk of IoT has a negative effect on individual performance
Perceived fee is the economical sacrifice needed in order to obtain a device with IoT embedded (Kim et al., 2007). Past theories have proven that studies in perceived price and perceived value are negatively related. Once the perceived benefits are exceeded by the perceived fee, users are not likely to use it (Hsu & Lin, 2016). Thus, we propose the following:
9
H9a. The perceived fee of IoT has a negative influence on IoT use
10
4. METHODOLOGY
4.1. M
EASUREMENTTo test the model presented in Figure 1 we have conducted a survey, based on a study sample of IoT users spanning several countries around the world. Nowadays, IoT is embedded practically in every device we own. Our target population is composed of IoT device users between 18 and 70 years old. To examine the respondents difficulties related to answering the questionnaire we have started by creating a small pilot sample of 40 individuals to assess the measurement instruments, reliability and validity of the scales. The pilot scales evidenced reliability and validity (shown in appendix A). The survey was written in English, was made online, between January and April 2018, and was assessed using a seven-point range scale with one representing “strongly disagree” and seven for “strongly agree”.
4.2. D
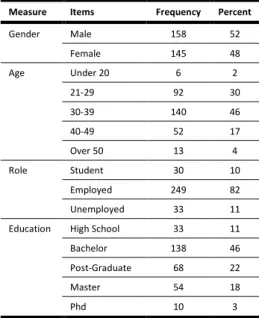
ATAWe have used an online survey to collect the data. Data was collected over a period of sixteen weeks (January to April 2018). 303 valid responses were received from the respondents, 158 (52%) of which were male, 238 (78%) were 39 years old or younger, 82% were employed and 89% had a bachelor’s degree or above. The profile of the sample is shown in Table 1, as well as the sample characteristics. Moreover, we have compared the sample distribution in between to assess any bias possibility.
Measure Items Frequency Percent
Gender Male 158 52 Female 145 48 Age Under 20 6 2 21-29 92 30 30-39 140 46 40-49 52 17 Over 50 13 4 Role Student 30 10 Employed 249 82 Unemployed 33 11 Education High School 33 11 Bachelor 138 46 Post-Graduate 68 22 Master 54 18 Phd 10 3
11
5. RESULTS
We have used structural equation modeling (SEM) to analyze the data. There are two different SEM classifications: (i) covariance-based techniques and (ii) variance-based techniques. We have used variance-based technique and partial least squares (PLS), because these have been considered a method to analyze less developed theories, specially: (i) when not all items in our data are distributed normally (p < 0.01 based on Kolmogorov–Smirnov’s test); (ii) the research model has not been tested in the literature; (iii) the research model is considered complex. SmartPLS 3 (Ringle, Wende, & Becker, 2015) was the software used to analyze the construct relationships in our research model.
5.1. M
EASUREMENT MODELTables 2 and 3 showcase the research model results. We have tested the construct reliability (CR), indicator reliability, convergent validity, and the discriminant validity which was assessed using the average variance extracted (AVE). By applying the composite reliability, we were able to test the construct reliability. As shown in Table 2, the constructs can be considered reliable due to the fact that all have a composite reliability above 0.9 (Straub, 1989). The indicator reliability was assessed based on the criteria that loadings should be higher than 0.7. As shown in Table 3, the loadings (in bold) are greater than 0.7 which represent a good indicator of the research model reliability (Churchill Jr., 1979; Henseler, Ringle, & Sinkovics, 2009). To test the convergent validity we have used the AVE which in our research is higher than 0.5 for every construct, meaning that the average indicators variance is explained by the latent variable in more than half (Fornell & Larcker, 1981; Hair Jr, 2016).
The following criteria was used to calculate the discriminant validity. One is the Fornell-Larcker that compares the square root of the AVE with the correlation of the latent constructs (Fornell & Larcker, 1981). As shown in Table 2 we can identify the square root of AVE (in bold) as higher than the correlation between constructs. The second is the loadings and cross-loadings criterion (Henseler et al., 2009). The results presented in Table 3 demonstrates that all the loadings (in bold) had higher values than their cross loadings.
The construct assessments matched the requirements and were satisfactory, indicating the constructs can estimate the conceptual model and hypothesis.
Mean SD CR CA TaksC TechC TTF Use IndvP UserC PrcvU PrcvR PrcvF
TaskC 4.993 1.215 0.928 0.883 0.901 TechC 4.874 1.125 0.931 0.900 0.800 0.878 TTF 4.962 1.128 0.925 0.878 0.827 0.814 0.896 Use 5.024 1.137 0.932 0.891 0.714 0.637 0.748 0.906 IndvP 4.969 1.186 0.935 0.860 0.761 0.736 0.827 0.804 0.937 UserS 4.777 1.095 0.924 0.836 0.738 0.776 0.814 0.815 0.841 0.878 PrcvU 5.059 1.132 0.958 0.941 0.829 0.765 0.826 0.743 0.810 0.784 0.922 PrcvR 4.349 1.360 0.967 0.954 -0.353 -0.286 -0.380 -0.404 -0.369 -0.385 -0.279 0.937 PrcvF 3.947 1.256 0.949 0.920 -0.389 -0.314 -0.452 -0.434 -0.408 -0.416 -0.410 0.672 0.928 Notes: Standard deviation (SD); Construct reliability (CR), Cronbach’s alpha (CA); Task characteristics (TaskC); Technology characteristics (TechC); Task
technology fit (TTF); Use (Use); Individual performance (IndvP); User satisfaction (UserS); Perceived usefulness (PrcvU); Perceived risk (PrcvR); Perceived fee (PrcvF)
12 Table 2 – Means, standard deviations, correlations, and reliability and validity measures of latent
variables
TaksC TechC TTF Use IndvP UserC PrcvU PrcvR PrcvF
Task characteristics (TaskC) 0.916 0.743 0.744 0.671 0.694 0.673 0.767 -0.298 -0.341
0.917 0.689 0.719 0.636 0.681 0.638 0.720 -0.374 -0.347
0.868 0.726 0.768 0.621 0.679 0.679 0.750 -0.284 -0.361
Technology characteristics (TechC) 0.732 0.918 0.747 0.612 0.700 0.752 0.718 -0.240 -0.293
0.634 0.855 0.688 0.463 0.573 0.618 0.638 -0.112 -0.243 0.738 0.925 0.724 0.587 0.633 0.697 0.695 -0.254 -0.284 0.700 0.809 0.698 0.570 0.642 0.651 0.631 -0.395 -0.281
Task technology fit (TTF) 0.757 0.739 0.909 0.722 0.789 0.773 0.787 -0.341 -0.447
0.700 0.742 0.878 0.571 0.666 0.688 0.706 -0.214 -0.370 0.763 0.711 0.901 0.709 0.760 0.723 0.725 -0.454 -0.394
Use (Use) 0.663 0.618 0.728 0.916 0.752 0.772 0.728 -0.259 -0.420
0.670 0.604 0.661 0.908 0.740 0.765 0.673 -0.424 -0.380 0.604 0.505 0.642 0.894 0.691 0.674 0.613 -0.422 -0.378
Individual performance (IndvP) 0.725 0.691 0.797 0.813 0.942 0.802 0.780 -0.374 -0.398
0.699 0.687 0.751 0.688 0.931 0.772 0.736 -0.314 -0.365
User satisfaction (UserS) 0.715 0.740 0.753 0.815 0.787 0.934 0.739 -0.389 -0.362
0.649 0.696 0.756 0.691 0.771 0.920 0.713 -0.322 -0.412
Perceived usefulness (PrcvU) 0.788 0.719 0.796 0.734 0.773 0.739 0.946 -0.300 -0.367
0.736 0.678 0.737 0.605 0.713 0.687 0.892 -0.241 -0.383 0.776 0.735 0.752 0.699 0.756 0.749 0.936 -0.227 -0.363 0.754 0.686 0.759 0.693 0.743 0.714 0.912 -0.258 -0.400 Perceived risk (PrcvR) -0.344 -0.250 -0.355 -0.384 -0.342 -0.355 -0.249 0.940 0.568 -0.337 -0.272 -0.371 -0.394 -0.344 -0.364 -0.276 0.943 0.613 -0.313 -0.240 -0.336 -0.397 -0.341 -0.355 -0.246 0.961 0.631 -0.331 -0.311 -0.363 -0.339 -0.355 -0.372 -0.275 0.905 0.712 Perceived fee (PrcvF) -0.388 -0.302 -0.431 -0.453 -0.411 -0.437 -0.401 0.693 0.942 -0.362 -0.284 -0.425 -0.406 -0.371 -0.370 -0.386 0.617 0.943 -0.328 -0.288 -0.401 -0.337 -0.348 -0.343 -0.349 0.548 0.899 Table 3 – PLS loading and cross loading
5.2. S
TRUCTURAL MODELThe structural model results can be summarized as follows: we have assessed using path coefficients significance level and R2 calculations. To estimate the significance, we have used a 5,000
bootstrapping resample, and the results of beta, t-values, and R2 are shown in Table 4. The R2 of the
dependent construct explains 74.9%, 71.3% and 80.9% of the variation in task-technology fit, use, and individual performance respectively.
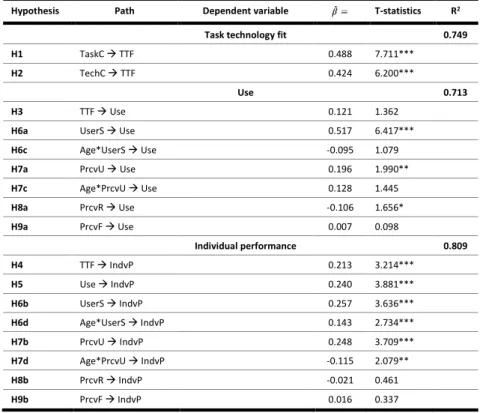
The task characteristics ( = 0.488, p < 0.01) and tech characteristics ( = 0.424, p < 0.01) are statistically significant to explain TTF, hence confirming the hypothesis H1 and H2. The model explains 74.9% of variation in task-technology fit.
TTF is not statistically significant to explain use ( 0.121, p > 0.10), thus hypothesis H3 is not supported to explain use. In the perceived benefits, user satisfaction ( 0.517, p < 0.01) and perceived usefulness ( 0.196, p < 0.05) are both statistically significant for explaining use. Hence,
13 hypothesis H6a and H7a are confirmed. To better assess the importance of the age effect on IoT technology we have considered age as a moderator of user satisfaction ( -0.095, p > 0.10) and perceived usefulness ( 0.128, p > 0.10) on use. Age as moderator of user satisfaction and perceived usefulness on use is not statistically significant, therefore not conforming hypothesis H6c
and H7c. In the perceived sacrifices, perceived risks ( – 0.106, p < 0.10) is significant to explain use. Thus, conforming hypothesis H8a. Conversely, perceived fees ( 0.007, p > 0.10) are not statistically significant for explaining the IoT use, hence, hypothesis H9a is not supported. The model explains 71.3% of variation in IoT use.
TTF explains Individual performance ( 0.213, p < 0.01), thus validating hypothesis H4. Likewise, use explains individual performance ( 0.240, p < 0.01), confirming hypothesis H5. Thereafter, the perceived benefits, and both user satisfaction ( 0.257, p < 0.01) and perceived usefulness ( 0.248, p < 0.01) are statistically significant for explaining the individual performance, thus confirming hypothesis H6b and H7b. Age is statistically significant as moderator of user satisfaction ( 0.143, p < 0.01) on individual performance. Therefore, hypothesis H6d is confirmed. On the other hand, age is statistically significant moderator of perceived usefulness ( -0.115, p < 0.05) on individual performance. However, the sign is the opposite than the one we have hypothesized, and thus, hypothesis H7d is not confirmed. The perceived sacrifices, both perceived risks ( – 0.021, p > 0.10) and perceived fees ( 0.016, p > 0.10) are not statistically significant. Thus, hypothesis H8b
and H9b are not confirmed. The model explains 80.9% of variation in individual performance. This demonstrates that 10 out of the 17 hypotheses presented in our research model are supported.
Hypothesis Path Dependent variable T-statistics R2
Task technology fit 0.749
H1 TaskC → TTF 0.488 7.711***
H2 TechC → TTF 0.424 6.200***
Use 0.713
H3 TTF → Use 0.121 1.362
H6a UserS → Use 0.517 6.417***
H6c Age*UserS → Use -0.095 1.079
H7a PrcvU → Use 0.196 1.990**
H7c Age*PrcvU → Use 0.128 1.445 H8a PrcvR → Use -0.106 1.656* H9a PrcvF → Use 0.007 0.098 Individual performance 0.809 H4 TTF → IndvP 0.213 3.214*** H5 Use → IndvP 0.240 3.881*** H6b UserS → IndvP 0.257 3.636*** H6d Age*UserS → IndvP 0.143 2.734*** H7b PrcvU → IndvP 0.248 3.709*** H7d Age*PrcvU → IndvP -0.115 2.079** H8b PrcvR → IndvP -0.021 0.461 H9b PrcvF → IndvP 0.016 0.337
14
6. DISCUSSION
The current study aims to explain the use and individual performance of IoT. As far as we are aware, this is the first research combining TTF, VAM, and age as moderator of perceived benefits (user satisfaction and perceived usefulness) on IoT use and individuals’ performance.
TTF in our model is explained by task characteristics and tech characteristics. The model explains 74.9% of the variation in TTF. Showing identical outcomes when compared with analogous study’s (Zhou, Lu, & Wang, 2010).
With these results, our study reveals as well that use is explained by TTF, benefits (both user satisfaction and perceived usefulness) and perceived risks. The model explains 71.3% of the variation on use. There are various effects of perceived benefits and sacrifices on IoT that enhances and undermine the perceived value of the end-user. Consequently, they have positive or negative effect on use (Lin & Huang, 2008).
TTF, use, user satisfaction, perceived usefulness, and age moderating the user satisfaction were found to positively impact individual performance. Age also moderate the perceived usefulness to explain individual performance. However this effect is negative, which means that for younger people the perceived usefulness is more important than to older people to explain individual performance. Therefore, the model explains 80.9% of the variation in individual performance. Results shows that users consider IoT as a source of Individual performance as predicted by the proposed model (Ortiz de Guinea & Webster, 2013). In the next section, we will summarize the theoretical and practical implications of our research.
6.1. T
HEORETICAL IMPLICATIONSThe fundamental theoretical contribution of this research for the IoT body is threefold: first it relies on the model produced, which incorporates two different theoretical perspectives (TTF and VAM) to explain how IoT use can lead to individual performance via its perceived value (by opposing perceived benefits and perceived sacrifices).
As referred in previous researches, findings such as those conducted by DeLone & McLean, (1992) state that use related with a specific technology can differ because of the technology quality. Goodhue & Thompson, (1995) determined in their study (where they have built the foundations to the TTF model) that TTF can be a good predictor and a valuable addition to individuals’ performance. Depending on how satisfying the technology fits the user’s needs the better impact it will have on individual performance. As referred by Sonnentag & Frese, (2002) individual performance is something everyone wants to improve and optimize both in the personal and in the organization’s sphere. In addition, the effect of a certain technology impact on individuals’ performance established that this is not directly affected by the TTF (Tam & Oliveira, 2018). Moreover, other external factors such as user satisfaction and perceived usefulness are important predecessors of individual performance. This approach demonstrates that enhancements in individual performance should be considered because IoT is a task-oriented technology (Hsu & Lin, 2016).
Despite its limitations, our study’s second contribution has served to better understand how IoT can influence the use and individual performance from the end-users perspective. Theoretically, based
15 on what is suggested by VAM model’s perceived value effect in individual’s performance, it is necessary to focus on end-users value maximization of a specific product, with embedded technology usage (Lim et al., 2018). This idea simply puts forward the notion of a cost-benefit paradigm. Therefore, an established relationship between perceived benefits and sacrifices will lead to a higher use and individual performance.
Due to the IoT technology specificity, users’ individual performance can be mainly supported by benefits (both user satisfaction and perceived usefulness), materializing in decisive constructs for the research. As expected user satisfaction is shown to be a manifestation of the end user use of the technology and affects directly individual’s performance (Xu & Du, 2018). Moreover, perceived usefulness represents also an important step to understand how likely users are receptive to use IoT technology based in their useful perception (Rothensee, 2008).
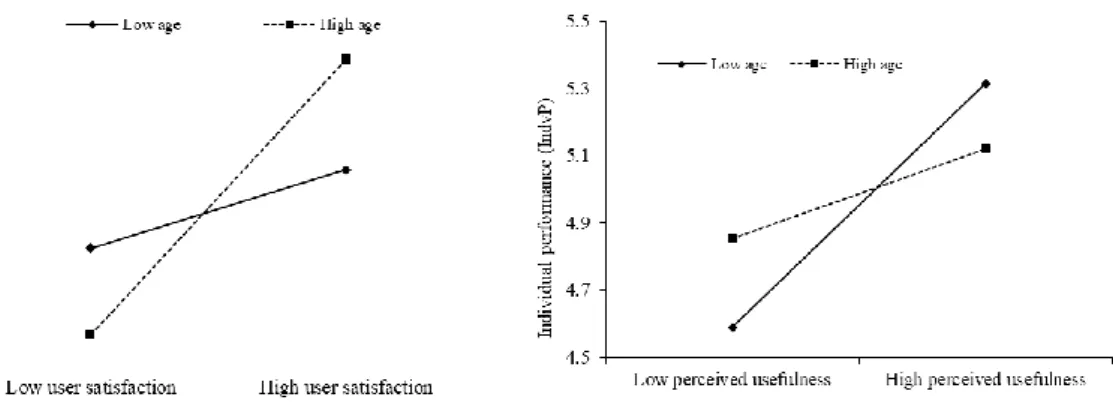
Thirdly, we have also tested the age as moderator of perceived benefits (user satisfaction and perceived usefulness) on use and individual performance, and interesting results were revealed, such as the effect of user satisfaction showing that this construct is highly relevant to explain individual performance amongst older respondents (Figure 2a). In contrast, the effect of perceived usefulness has shown to be higher amongst younger people to explain individual performance.
Figure 2. a – Moderation effect of age on user satisfaction to explain individual performance
Figure 2. b – Moderation effect of age on perceived usefulness to explain individual performance
Differently, our model reveals that the perceived risks had statistically significant negative effect on use of IoT technology while other perceived sacrifices have shown no effect on use and individual performance. Most likely these perceived risks negative impact may be explained by the uncertainty data protection embedded onto IoT technology devices. Seamlessly, the other perceived sacrifices negative impact are related to the fact IoT remains a recent technology as supported by (Hsu & Lin, 2016; Yang et al., 2015). Our theoretical findings may contribute to future research, IoT developers and IoT service managers.
6.2. P
RACTICAL IMPLICATIONSThe practical implications of our research may lead to relationship improvements between managers or IoT service providers and the end-users. First, as stated by Roostika, (2012) and shown by our results, if IoT tasks and technology set of characteristics are aligned, we will necessarily perform better. Based on this we will, supposedly, use this technology more often, which also echoes the postadoption nature of our research (Albalawi et al., 2016). Secondly, we have found that strategies to increment the perceived benefits (user satisfaction and perceived usefulness) should be carried
16 out to avoid what the TTF model postulate (Lu et al., 2018). Having an enormous amount of tools and technologies available will render peoples’ technology preferences volatile or change quickly while the technology moves forward, despite having in common the same intent in the background (Gao & Bai, 2014). Thirdly, the value maximization interrelationship needs to be taken into account because the perceived benefits will affect the consumer perception of IoT technology efficiency (Dijkman et. al., 2015). User satisfaction will increase consumers’ sensitivity of the technology and vendors should promote the IoT strengths and performance improvements specially amongst younger groups (Green et al., 2018). Otherwise, perceived usefulness it’s where the IoT technology providers should address users aims, amusement and joy developments specifically amongst the oldest demographic collectively. Additionally, understanding that age has a moderating effect on perceived benefits (user satisfaction and perceived usefulness) and that it will affect end-users individual performance should be considered a strategic driver as it could be critical when managing IoT technology solutions. For instance, user satisfaction is more effective amongst older groups while amongst younger people the perceived usefulness of a technology is more important to explain individual performance (Sonnentag & Frese, 2002). For this reason, targeting these cutting-edge technologies should have into consideration the age effect onto individual performance. Only upon usage will the consumer be able to understand the performance enhancements. The acceptable notoriety of this technology will lead the consumer to inspire their friends to use it for performance forecasting (Hsieh & Wu, 2018). Finally, consumers perceived risk demonstrates a negative effect on use. Accordingly, focus on enhancing data privacy perception of consumers’ daily life should be considered on devices with embedded IoT technology.
6.3. L
IMITATIONSSome limitation should be taken into consideration. Firstly, it is our assumption that every respondent in the online survey were IoT technology users, which can lead to some biased results. Secondly, this study was conceived in order to reach a vast audience but, in the end, the respondents were mainly Europeans. It will be interesting in future research to understand if the behavior of the IoT users in other countries follows the same path. Lastly, this study uses VAM and TTF models. We have merged a use and an adoption model to understand better the interdependence between perceived value and the task-technology fit on individuals’ performance. Extended studies may propose other theories such as trust or continuation to better understand this impact. We encourage future researchers to address these questions.
17
7. CONCLUSION
This study presents an empirical research that leads to a combination between the TTF and VAM models to identify the effect of IoT on individual’s performance. Throughout the literature review, we have detected a lack of studies in the IoT field specifically focused in understanding its impact on perceived benefits and sacrifices, the use and overall influence on individuals’ performance and, therefore, we have aimed to fill this gap.
The results here stated are based in a sample of 303 questionnaire respondents and confirms that IoT embedded technology leads the end user to performance enhancements. This research also adds the perceived benefits and perceived sacrifices terminology to IoT use and individual performance. We have found that task and tech characteristics influences positively TTF. Use is significantly affected by user satisfaction, perceived usefulness, and perceived risks. Individual performance is influenced positively by TTF, use, user satisfaction and perceived usefulness, and age moderates the path between benefits (both user satisfaction and perceived usefulness) and individual performance. Where age reveals to have different moderating impacts on user satisfaction (higher among older group) and perceived usefulness (higher among younger group). Our research has shown a high confirmation evidence 74.9% of the variation in TTF, 71.3% of the variation in use, and 80.9% of the variation in individual performance.
Thus, our research might be beneficial and provide more impetus to managers of services or products that have IoT technology embedded and to whom end-users individual performance and customer retainment is driven. IoT has been considered one of the cutting-edge technologies, being already part of our daily lives and with foreseeable development in the near future. Understanding how customers can improve their individual performance by having access to this technology will trigger a boost in use and individual performance of our daily devices; for example, by alleviating fees and promoting the utility such as performance winnings.
18
8. BIBLIOGRAPHY
Albalawi, U., Mohanty, S., & Kougianos, E. (2016). Energy-efficient design of the secure better portable graphics compression architecture for trusted image communication in the IoT. In Proceedings of IEEE Computer Society Annual Symposium on VLSI, ISVLSI (Vol. 2016–Septe, pp. 302–307).
Ashton, K. (2009). That ‘internet of things’ thing. RFID Journal, 22(7), 97–114.
Baesens, B., Bapna, R., Marsden, J., Vanthienen, J., & Zhao, J. L. (2016). Transformational issues of big data and analytics in networked business. MIS Quarterly, 40(4), 807–818.
Barua, A., Konana, P., Whinston, A. B., & Yin, F. (2004). Assessing internet enabled business value: An exploratory investigation. MIS Quarterly (Vol. 28).
Bhattacherjee, A. (2001). Understanding information systems continuance: An expectation-confirmation model. MIS Quarterly, 25(3), 351–370.
Brief, A. P., & Aldag, R. J. (1977). Conceptual notes the intrinsic-extrinsic dichotomy : Toward conceptual clarity university of Iowa. The Academy of Management Review, 2(3), 496–500. Calvarda, T. S., & Jeske, D. (2018). Developing human resource data risk management in the age of
big data. International Journal of Information Management, 43, 159–164.
Campbel, J. P., McCloy, R. A., Oppler, S. H., & Sager, C. E. (1993). A theory of performance. Personnel Selection in Organizations 3570, 35–70.
Christensen, C. (2013). The innovator’s dilemma: when new technologies cause great firms to fail. Harvard Business Review Press.
Chui, M., Loffler, M., & Roberts, R. (2010). The internet of things. McKinsey Quarterly, 2, 1–9.
Churchill Jr., G. (1979). A paradigm for developing better measures of marketing constructs. Journal of Marketing Research, 16(1), 64–73.
Davis, F. D. (1989). Perceived usefulness, perceived ease of use, and user acceptance of information technology. MIS Quarterly, 13(3), 319–340.
Deci, E. L. (1971). Effects of externally mediated rewards on intrinsic motivation. Journal of Personality and Social Psychology, 18(1), 105–115.
DeLone, W. H., & McLean, E. (1992). Information systems success: The quest for the dependent variable. Information Systems Research, 3(1), 60–95.
Dijkman, R. M., Sprenkels, B., Peeters, T., & Janssen, A. (2015). Business models for the internet of things. International Journal of Information Management, 35(6), 672–678.
Fichman, R. G., Dos Santos, B. L., & Zheng, E. (2014). Digital innovation as a fundamental and powerful concept in the information systems curriculum. MIS Quarterly, 38(2), 329–343.
19 Fornell, C., & Larcker, D. F. (1981). Evaluating structural equation models with unobservable variables
and mesaurement error. Journal of Marketing Research, 18(1), 39–50.
Gao, L., & Bai, X. (2014). A unified perspective on the factors influencing consumer acceptance of internet of things technology. Asia Pacific Journal of Marketing and Logistics, 26(2), 211–231. Gefen, D., Karahanna, E., & Straub, D. W. (2003). Trust and TAM in online shopping: An integrated
model. MIS Quarterly, 27(1), 51.
Goodhue, D. L., & Thompson, R. L. (1995). Task-technology fit and individual performance. MIS Quarterly, 19(2), 213–236.
Green, S., McKinney Jr., E., Heppard, K., & Garcia, L. (2018). Big data, digital demand, and decision-making. International Journal of Accounting & Information Management.
Hair Jr., J. F., Hult, T. M., Ringle, C., & Sarstedt, M. (2016). A primer on partial least squares structural equation modeling (PLS-SEM). Sage Publications.
Henseler, J., Ringle, C. M., & Sinkovics, R. R. (2009). The use of partial least squares path modeling in international marketing. Emerald Group Publishing Limited.
Hoehle, H., & Venkatesh, V. (2015). Mobile application usability: Conceptualization and instrument development. MIS Quarterly, 39(2), 435–472.
Hsieh, Y.-J., & Wu, Y. J. (2018). Entrepreneurship through the platform strategy in the digital era: Insights and research opportunities. Computers in Human Behavior.
Hsu, C.-L., & Lin, J. (2016). Exploring factors affecting the adoption of internet of things services. Journal of Computer Information Systems, 58(1), 1–9.
Hunt, H. K. (1977). Conceptualization and measurement of consumer satisfaction and dissatisfaction. Marketing Science Institute. Marketing Science Institute.
Jung, Y., & Park, J. (2018). An investigation of relationships among privacy concerns, affective responses, and coping behaviors in location-based services. International Journal of Information Management, 43, 15–24.
Kim, H.-W., Chan, H. C., & Gupta, S. (2007). Value-based adoption of mobile internet: An empirical investigation. Decision Support Systems, 43(1), 111–126.
Koren, I., & Klamma, R. (2018). Enabling visual community learning analytics with internet of things devices. Computers in Human Behavior.
Lee, G., & Xia, W. (2010). An integrated analysis of quantitative and qualitative field data on software development agility. MIS Quarterly, 34(1), 87–114.
Lim, C., Kimb, K.-H., Kimc, M.-J., Heoc, J.-Y., Kimb, K.-J., & Maglio, P. P. (2018). From data to value: A nine-factor framework for data-based value creation in information-intensive services. International Journal of Information Management, 39, 121–135.
20 An integration of social cognitive theory and task technology fit. Information and Management, 45(6), 410–417.
Liu, D., Santhanam, R., & Webster, J. (2017). Toward meaningful engagement: A framework for design and research of gamified information systems. MIS Quarterly, 41(4), 1011–1034.
Lu, Y., Papagiannidis, S., & Alamanos, E. (2018). Exploring the emotional antecedents and outcomes of technology acceptance. Computers in Human Behavior.
Lyytinen, K., & Rose, G. M. (2003). The disruptive nature of information technology innovations: The case of internet computing in systems development organizations. MIS Quarterly, 27(4), 557– 596.
Maarof, A., Senhadji, M., Labbi, Z., & Belkasmi, M. (2018). Authentication protocol for securing internet of things. In In Proceedings of the Fourth International Conference on Engineering & MIS (pp. 29–35).
Malhotra, A., Melville, N. P., & Watson, R. T. (2013). Spurring impactful research on information systems for environmental sustainability. MIS Quarterly, 37(4), 1265–1274.
Marinissen, E. J., Zorian, Y., Konijnenburg, M., Huang, C.-T., Hsieh, P.-H., Cockburn, P., … Reyes, C. (2016). IoT: Source of test challenges. In Proceedings of the European Test Workshop (Vol. 2016–July, pp. 1–10).
Martins, C., Oliveira, T., & Popovič, A. (2014). Understanding the internet banking adoption: A unified theory of acceptance and use of technology and perceived risk application. International Journal of Information Management, 34(1), 1–13.
Maruping, L. M., & Agarwal, R. (2004). Managing team interpersonal processes through technology: A task-technology fit perspective. Journal of Applied Psychology, 89(6), 975–990.
McGill, T. J., & Klobas, J. E. (2009). A task-technology fit view of learning management system impact. Computers and Education, 52(2), 496–508.
Mouloua, M. (1997). Automation and human performance: Theory and applications. Psyccritiques, 42(11), 1041.
Ortiz de Guinea, A., & Webster, J. (2013). An investigation of information systems use patterns: Technological events as triggers, the effect of time, and consequences for performance. Mis Quarterly, 37(4), 1165–1188.
Pura, M. (2005). Linking perceived value and loyalty in location-based mobile services. Managing Service Quality.
Ringle, C. M., Wende, S., & Becker, J.-M. (2015). “SmartPLS 3 (Version 3). Bönningstedt: SmartPLS.” Rivera, J., & Van der Meulen, R. (2014). Gartner says 4.9 billion connected “things” will be in use in
2015. Retrieved October 3, 2017, from https://www.gartner.com/newsroom/id/2905717 Roostika, R. (2012). Mobile internet acceptance among university students : A value-based adoption
21 model. International Journal of Research in Management and Technology, 2(1), 21–28.
Rothensee, M. (2008). User acceptance of the intelligent fridge: Empirical results from a simulation. In the internet of things. In Springer, Berlin, Heidelberg (pp. 123–139).
Sebastian, I., Ross, J., Beath, C., Mocker, M., Moloney, K., & Fonstad, N. (2017). How big old companies navigate digital transformation. MIS Quarterly Executive, 16(3), 197–213.
Shelke, M., Malhotra, A., & Mahalle, P. N. (2018). Congestion-aware opportunistic routing protocol in wireless sensor networks. In In Smart Computing and Informatics (pp. 63–72). Singapore: Springer.
Sonnentag, S., & Frese, M. (2002). Performance concepts and performance theory. In Psychological management of individual performance (pp. 3–25).
Straub, D. W. (1989). Validating instruments in MIS research. MIS Quarterly, 13(2), 147–169.
Sweeney, J. C., & Soutar, G. N. (2001). Consumer perceived value: The development of a multiple item scale. Journal of Retailing, 77(2), 203–220.
Tam, C., & Oliveira, T. (2016). Understanding the impact of m-banking on individual performance: DeLone & McLean and TTF perspective. Computers in Human Behavior, 61, 233–244.
Tam, C., & Oliveira, T. (2018). Does culture influence m-banking use and individual performance? Information and Management.
Tsai, C.-W., Lai, C.-F., & Vasilakos, A. V. (2014). Future internet of things: Open issues and challenges. Wireless Networks, 20(8), 2201–2217.
Urbach, N., Smolnik, S., & Riempp, G. (2010). An empirical investigation of employee portal success. The Journal of Strategic Information Systems, 19(3), 184–206.
Venkatesh, V., Thong, J. L., & Xu, X. (2012). Consumer acceptance and Use of information technology: Extending the unified theory of acceptance and use of technology. MIS Quarterly, 36(1), 157– 178.
Vermesan, O., & Friess, P. (2013). Internet of things: Converging technologies for smart environments and integrated ecosystems. River Publishers.
Virkki, J., & Chen, L. (2013). Personal perspectives: Individual privacy in the IoT. Advances in Internet of Things, 03(02), 21–26.
Voss, G. B., Parasuraman, A., & Grewal, D. (1998). The roles of price, performance, and expectations in determining satisfaction in service exchanges. Journal of Marketing, 62(4), 46.
Woodruff, R. B. (1997). Customer value: The next source for competitive advantage. Journal of the Academy of Marketing Science, 25(2), 139.
Wu, J.-H., & Wang, Y.-M. (2006). Measuring KMS success: A respecification of the DeLone and McLean’s model. Information and Management, 43(6), 728–739.
22 Xu, F., & Du, J. T. (2018). Factors influencing users’ satisfaction and loyalty to digital libraries in
Chinese universities. Computers in Human Behavior, 83, 64–72.
Yang, Y., Liu, Y., Li, H., & Yu, B. Y. (2015). Understanding perceived risks in mobile payment acceptance. Industrial Management and Data Systems, 115(2), 253–269.
Yoo, Y. (2010). Computing in Everyday Life: A Call for Research on Experiential Computing. MIS Quarterly, 34(2), 213–231.
Zhou, T., Lu, Y., & Wang, B. (2010). Integrating TTF and UTAUT to explain mobile banking user adoption. Computers in Human Behavior, 26(4), 760–767.
23
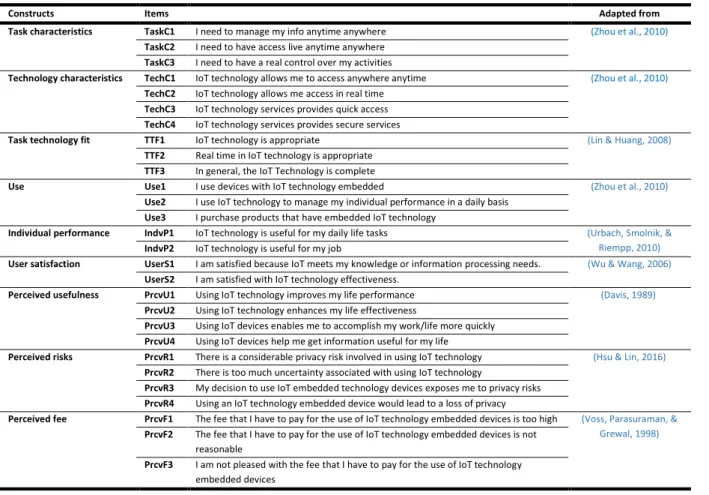
9. APPENDIX A
Constructs Items Adapted from
Task characteristics TaskC1 I need to manage my info anytime anywhere (Zhou et al., 2010)
TaskC2 I need to have access live anytime anywhere
TaskC3 I need to have a real control over my activities
Technology characteristics TechC1 IoT technology allows me to access anywhere anytime (Zhou et al., 2010) TechC2 IoT technology allows me access in real time
TechC3 IoT technology services provides quick access
TechC4 IoT technology services provides secure services
Task technology fit TTF1 IoT technology is appropriate (Lin & Huang, 2008)
TTF2 Real time in IoT technology is appropriate
TTF3 In general, the IoT Technology is complete
Use Use1 I use devices with IoT technology embedded (Zhou et al., 2010)
Use2 I use IoT technology to manage my individual performance in a daily basis
Use3 I purchase products that have embedded IoT technology
Individual performance IndvP1 IoT technology is useful for my daily life tasks (Urbach, Smolnik, &
Riempp, 2010)
IndvP2 IoT technology is useful for my job
User satisfaction UserS1 I am satisfied because IoT meets my knowledge or information processing needs. (Wu & Wang, 2006)
UserS2 I am satisfied with IoT technology effectiveness.
Perceived usefulness PrcvU1 Using IoT technology improves my life performance (Davis, 1989)
PrcvU2 Using IoT technology enhances my life effectiveness
PrcvU3 Using IoT devices enables me to accomplish my work/life more quickly
PrcvU4 Using IoT devices help me get information useful for my life
Perceived risks PrcvR1 There is a considerable privacy risk involved in using IoT technology (Hsu & Lin, 2016)
PrcvR2 There is too much uncertainty associated with using IoT technology
PrcvR3 My decision to use IoT embedded technology devices exposes me to privacy risks
PrcvR4 Using an IoT technology embedded device would lead to a loss of privacy
Perceived fee PrcvF1 The fee that I have to pay for the use of IoT technology embedded devices is too high (Voss, Parasuraman, & Grewal, 1998)
PrcvF2 The fee that I have to pay for the use of IoT technology embedded devices is not reasonable
PrcvF3 I am not pleased with the fee that I have to pay for the use of IoT technology embedded devices