Editorial Tag Endogeneity for News
Websites
Bruno Ribeiroa, Ricardo Morlaa,b, Amílcar Correiac aINESC TEC bFEUP cPúblico SA Jan. 2013
Abstract
Editors and journalists at some news websites label their articles with structure-‐ and content-‐related editorial tags. Each article can have more than one tag and each tag can be used in more than one article. A network of tags can be defined whose edges are all possible pairs of tags in each article. Because editorial tags relate to structure and content rather than individual articles, the analysis of a network of editorial tags could assist editorial decisions to prioritize types of content and articles. In this paper we analyze the network of editorial tags of one of the fastest growing news websites in Portugal, with over 6.1 million visits, 7.6 million page views, and over 1200 editorial tags in 15 months. Standard network characterization reveals a 15.5 average node degree, a 0.794 average clustering coefficient, and a 2.36 average path length, which are indicators of small world and triadic closure effects. We use this tag network to propose endogenous and exogenous models that predict transitions between tags of consecutive article views. The editor can use this tag transition model to prioritize types of articles: articles with endogenous tags to try to promote the reading of articles with similar content, and articles with exogenous tags to try to promote the reading of articles with different content.
1. Introduction
Tagging is widely used by website publishers to improve user experience in content search. Although this is a common practice in general purpose websites, news websites have only started using tags extensively a few years ago. Tags are non-‐hierarchical and help describe a news article. They often extend beyond the article they describe to embody a theme that is common to more than one article. In addition to helping with user search, tags can be useful for editors to
understand when the themes that the tags embody gain popularity. Editors have limited options to develop an article further after the article is published. That is not the case for themes: editors can easily expand a theme by sending out
journalists to investigate the theme and publish resulting articles with corresponding tags; or drop a theme by not publishing articles on the theme.
Understanding which tags are popular is straightforward and requires simple per-‐tag statistics. The fundamental problem this paper addresses is to
understand which tags have the potential to bring in page views of articles with the same theme and which tags have the potential to bring in page view for articles with different themes, thus promoting the reading of articles with
different content and possibly lower popularity. The solution to this problem can be valuable to the Editor and to the extent of our knowledge has not been
addressed before.
We propose two models – one endogenous, the other exogenous – that can be used to predict transitions between tags of consecutive page views. These models use only the information from the network of tags that co-‐ occur in the same article. The endogenous model predicts a transition from the first tag to the second tag, where the second tag is one hop away from the first tag. The
exogenous model considers that the second tag is two hops away from the first tag. Transitions to one hop away tags represent page view transitions between articles that share these tags and are likely to be on the same theme. Transitions to two hop away tags represent page view transitions between articles that do not share tags and are likely to be on different themes.
We start by describing the news website on which we base our study in section 2. We focus on the site’s rationale, structure, and statistics, and provide an
overview of the role of tags in the site. As the endogenous and exogenous models are based on the network of tags that co-‐occur in the same article, we describe this network in section 3 for our analysis period. We discuss the meaning of network metrics for the network of tags and show network statistics and visualizations. We also assess the effect of structure tags on the network statistics. Structure tags are explained in section 2 and are used as markers for where the article is located in the site’s content structure – for example in the Movies sub-‐section within the Culture section. Our models are described in detail in section 4.
2. Target News Website
2.1. Site Rationale and Structure
P3 (http://p3.publico.pt) is a social network and a news website that targets Portuguese-‐speaking adults aged 18 to 35. P3 has 3 major sections: Culture (Cultura), Breaking News (Actualidade) and Addictions (Vicios). In the Culture section we find news about movies, concerts, shows, exhibits, etc. The Breaking News section has news about sports, society, politics, and science. The
Addictions section has news about life and style, traveling, high-‐tech products, beauty products, and TV shows. Each section has its own homepage that contains the most recent articles of that section and the links to its sub-‐sections. Table 1 lists P3’s sub-‐sections. Readers can get to news articles directly via the site’s home page, by navigating through the sections, or via tag or keyword search. A typical news article consists of text, images, video and audio, and tags.
2.2. Site Statistics and Data Collection
P3 had over 6.1 million visitors and 7.6 million page views in the 15 months from September 2011 to November 2012 that we use in this paper.
Figure 1 shows monthly page views in each section of the site during this period. We observe a tendency for an increase in the number of page views throughout the months with large variations especially in the Breaking News section. This may be explained by hot topics that quickly die out and that are more prevalent in this section. Figure 2 shows the monthly average of the number of page views per unique visitor. We observe a steep decline of this number in the initial months that stabilizes at approximately 1.2 page views per visit from January 2012. Note that these statistics were obtained through standard industry mechanisms and represent page views of articles and of site, section, and sub-‐ section home pages. Tag co-‐occurrence in articles was computed directly from the site’s internal article database. Tag transition from consecutive article views were computed from the web server logs.
2.3. Role of Tags
The journalist that creates an article chooses the tags for the article. There are three major rules for choosing tags. 1) Each article must have section and sub-‐ section tags. 2) Tags must be reused. 3) An unspecified yet small number of tags must be used. The first rule makes it possible to search for articles in a given section and sub-‐section. The second rule tries to guarantee that two similar tags are not used to represent the same theme or concept. Journalists are encouraged to search for similar tags in the system before creating a new tag. The final rule tries to make sure that tags do not focus on a small part of the article but are wide enough to cover the whole article.
3. Network of Co-‐occurring Tags
This section describes the network of tags that co-‐occur in the same arti-‐ cle. The data for this network is taken from the news site’s article database. Figure 3 provides an illustration of this network. The radius of the circle that represents each tag increases with the number of connections to other tags. Figure 4 shows local examples of this network: an example of the network of tags that are neighbors of the tag of artist Paula Rego and of the tag ”Animals”. The network for tag ”Paula Rego” is defined by three articles, each of which is responsible for creating the following fully connected sub-‐networks (i.e. in which each node connects to every other node in the sub-‐network): 1) Paula Rego, Souto Moura, Arquitectura, Cultura, 2) Paula Rego, Casa das Historias, Arquitectura, Cultura, and 3) Paula Rego, França, Exposição, Arte, Cultura. The network for tag
”Animals” is larger and more complex. Themes like bull fighting (Tauromaquia), biodiversity, and environmental activism (Activismo, Natureza) can be found in this network.
3.1. Definitions and Interpretation of Network Metrics
In a set of news articles an with n ∈ {1,..,N}, each article an has a set of tags {tnj } with j ∈ {1, .., Mn}. This results in a set of unique tags {tk} with k ∈ {1, .., K } for
the set of news articles {an}. A network tags can be defined over the set of news
articles {an} as a graph whose nodes are the editorial tags {tk} and whose edges
ek1 k2 are defined between two tags tk1 and tk2 if there is at least one article an
whose tag set {tnj } contains both tk1 and tk2. This network is undirected. The
edges of this network can optionally be assigned weights; in that case, edge weight wk1k2 is defined as the number of articles whose tag set contains both tk1
and tk2. As the network is undirected, wk1k2 = wk2k1. The rationale for creating
edges this way is that if tags appear in the same article then the article
intrinsically establishes a relation between the themes that the tags represent. We call ’article-‐relation’ to this relation between tags.
We use the following standard network statistics and concepts, whose definition can be found in any network analysis book e.g. [1]. A) Node degree is the number of edges each node has. The node degree of a tag is the number of other tags that co-‐occur with that tag in all articles, i.e., with which this tag has an article-‐
relation. B) The clustering coefficient of a node is the proportion of the number of edges that exist between the node’s neighbors to the total number of possible edges between the node’s neighbors. A clustering coefficient close to zero indicates that the tag’s neighbors are mostly not article-‐related. A clustering coefficient close to one shows the opposite: almost all neighbor tags are article-‐ related between themselves; this is often used to depict the “friend-‐of-‐a-‐friend” or triadic closure phenomenon. We identify two possible mechanisms for which the triadic closure can happen on a tag. 1) When three or more tags co-‐occur in the same article, which means that the relation between these tags is established within the same article. 2) When it is not the same article that relates the tag with its neighbors and the neighbors between them. C) Average path length is the average of the shortest paths between any two nodes. Path length gives us the shortest distance between any two tags. The meaning of distance is related to the co-‐occurrence of tags in the same article. A path length of two, for example, means that to go from tag A to tag B it should be possible to find an article that relates tag A and another tag C, and another article that relates tag C with tag B. The path length between A and B can then characterize an indirect article-‐
relation between A and B; the longer the path length, the more indirect the relation is. D) Betweenness is a measure of the centrality of a node in the
network. It is related to the number of shortest paths that traverse a node. A tag with higher Betweenness centrality plays a more important role in establishing indirect article-‐relations between other tags.
3.2. Network Statistics
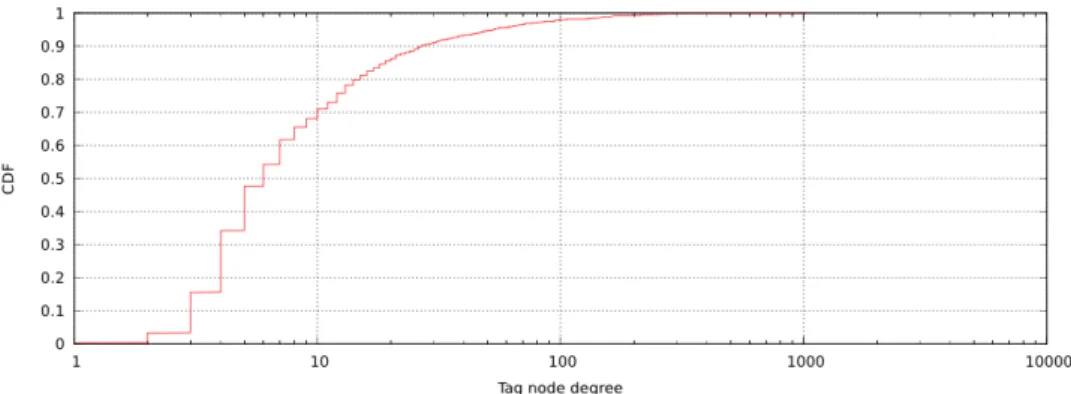
This network of tags has 1892 nodes and 14651 edges. The average node degree is 15.5: on average each tag co-‐occurs with 15.5 other tags in the same or
different articles. However, as we can see in figure 5, the degree distribution is far from uniform: almost half of the tags have node degree below 6 and 39 tags have a node degree higher than 100. Included in the latter are the three section tags and 10 sub-‐section tags.
Figure 6 shows the clustering coefficient distribution, which has an aver-‐ age of 0.794. More than half of the tags have clustering coefficient 1, which means that all their neighbors are directly connected. The node degree of these tags is smaller than 10 and more than 60% of these tags have node degree smaller than 5. Our intuition is that the triadic closure in these tags happens mostly because the tags and all their neighbors appear in the same article and consequently form a fully connected sub-‐graph. The average clustering coefficient drops to 0.571 when we only consider the nodes that don’t have a clustering coefficient equal to one. The three section tags have the lowest clustering coefficients and less than 3% of the tags (out of the total number of tags) have a clustering coefficient below 0.2. These 3% of tags have a high node degree – i.e. a node degree larger than 60, which corresponds to the 5% highest node degree tags. This includes most of the sub-‐section tags, but also other high degree tags.
The average path length is 2.36; this means that the indirect article-‐ relations are established through an average of 2.36 articles. Figure 7 shows the distribution of tag Betweenness centrality. More than 50% of the tags have zero Betweenness centrality. This means that no shortest path between other tags includes these tags, i.e. that no other tag has an indirect article-‐ relation that includes these tags. The three section tags have the highest Betweenness; the first and second
highest Betweenness tags have similar values, the third nearly 40% of the first, and the fourth, the Music sub-‐ section, only 13% of the first. This means that the three section tags play a dominant role in establishing indirect article-‐relations.
Tags ”Paula Rego” and ”Animais” whose neighborhood in shown in figure 4 have the following network statistics: node degree 7 and 21, clustering coefficients 0.714 and 0.319, and Betweenness centrality of both 0. Their relatively high clustering coefficients show that their neighborhood is strongly article-‐related and their centrality shows they are on the edge of the network.
3.3. The Effect of Section Tags
Section tags are an effective means to categorize articles in the news site
structure. However, they are not very useful in understanding theme popularity and in assisting the editor in choosing to further develop a theme, as they are common to a large number of themes. Moreover, network statistics show that section tags have a high node degree and Betweenness centrality, and thus potentially having a strong effect in the properties of the network. In this section we characterize the network of tags without the three section tags and highlight differences to the full network. As we will see in the rest of this section, there are significant differences between the section and non-‐ section networks. As a consequence of these two arguments, in the rest of this paper we use network data without section tags.
An illustration of the network without section tags is shown in figure 8. This illustration shows 1) a large set of high node degree tags with a much smaller hub effect than what can be seen around the section tags in figure 3 and 2) a diversity of topics covered by these high node degree tags – whose translation to English would be music, cinema, arts, festivals, design, architecture, fashion, awards, sports, Lisbon, Porto, technology, Internet, Facebook, entrepreneurship,
employment, youth, crisis, university, science, chronicles. These tags are much closer to a theme that the Editor can pursue than the section tags.
This network has 1889 nodes and 12016 edges. Although the average node degree significantly dropped from 15.5 to 12.7, the node degree distribution remains similar. Almost half of the tags have node degree below 5 (dropped from 6) and the top 36 tags have node degree higher than 100. The former is expected as each article has just one section tag and removing the section tags reduces by 1 the node degree of each node. The average clustering coefficient dropped from 0.794 to 0.742. When the section tags are removed there is an increase from 6 to 65 tags with zero clustering coefficient, i.e. with no triadic closures. The
clustering coefficient of 931 tags remained unchanged after removing the section tags; these were mostly tags with clustering coefficient of one. The average path length increases from 2.36 to 2.83 when we remove section tags. Similar to the network with section tags, more than 50% of the tags have zero Betweenness centrality. The 5% tags with highest centrality more than triple their centrality values when the section tags are removed. To observe a 13% drop in
Betweenness centrality we must go back 28 tags; in the network with section tags a similar 13% drop happened much faster, at the fourth tag.
4. Tag transition models
In this section we describe the two tag transition models that we propose in this paper. The endogenous model will generate random transitions from a starting tag to the tags with which the starting tag has a direct article-‐ relation, i.e. where the target tag is a direct neighbor of the starting tag. Our intuition is that this model can capture consecutive views of articles on the same theme. The exogenous model will generate random transitions to tags that have a 2 hop indirect article-‐relation with the starting tag, i.e. where target tags are neighbors of neighbors of the starting tag. Our intuition is that this model can capture
consecutive views of articles on themes that have some relation but that are not as similar as the themes resulting from the article transition captured by the endogenous model. These models are simple applications of basic network concepts like path length and weighted path length to the tag transition prediction problem.
Each model can use binary tag adjacency or weighted tag adjacency from the network of co-‐occurring tags that was described in section 3. Our models define the probability p(ta → tb) of a transition from tag ta to tag tb. This means
that if tag ta is observed – i.e. if it occurs in an article that has been viewed by a user – then p is the probability that tag tb is observed in the next article that the
same user views. There is no timeout for consecutive article views. We do not consider transitions between the same tag and assume ta ≠ tb. The tag co-‐
occurrence network is undirected; we use notation ta → tb to embody
directionality in our tag transition model. As wab = wba, using directional notation
produces our intended outcome.
Equation 1 describes our endogenous model of the transition probability between tags of consecutive article views. This model defines tag transition probability as the proportion of the weight of the edge between ta and tb to the
sum of weights of all the edges of ta.
Equation 2 describes our exogenous model. We can think about it as an extension of the endogenous model, one in which target tags are 2 hops away from the starting tag. Before going into the model we need to define the weight of a path as the product of the weights of each edge on the path. Now we can compute the sum the weights of all the 2 hop paths that exist from starting tag to target tag. This is an indicator of the magnitude of the indirect article-‐relation between starting and target tags. Finally we normalize by the sum of the
magnitudes of the indirect article-‐relation between starting tag and all other tags that are exactly 2 hops away from the starting tag.
References
[1] D. Easley and J. Kleinberg. “Networks, Crowds, and Markets: Reason-‐ ing About a Highly Connected World”. Cambridge University Press, 2010. ISBN 978-‐ 0521195331