i
Transforming texts to maps: Geovisualizing topics in texts
ii
Transforming Texts to Maps: Geovisualizing
topics in texts
Dissertation supervised by
Francisco Ramos, PhD
Associate Professor
Department of Computer Languages and Systems
University Jaume I
Castellón, Spain
Co-supervised by
Oscar Belmonte Fernández, PhD
Associate Professor
Department of Computer Languages and Systems
University Jaume I
Castellón, Spain
Roberto Henriques, PhD
Assistant Professor
NOVA Information Management School
University of New Lisbon
Lisbon, Portugal
iii
ACKNOWLEDGEMENTS
I would like to thank all those without whom this work would not have been possible. I would like to express my sincere gratitude to Dr. Francisco Ramos, Dr. Oscar Belmonte Fernández and Dr. Roberto Henriques for supervising and co-supervising this research work. I will always be in debt to their guidance. I am also thankful to Edward Pultar for his valuable suggestions.
I am grateful to the Erasmus Mundus program for the opportunity to pursue the course M.Sc in Geospatial Technologies. It was an opportunity to be among inspirational teachers and amicable classmates. I am grateful to all those who have played a part in institutionalizing this course. I sincerely applaud the efforts of this hardworking team. I am also grateful to Charlie Greenbacker and Geoparser.io team for extending the API call limits for geoparsing the text documents..
Finally, I would like to take this opportunity to express my love and gratitude to my family. My all endeavors are the trust of my parents, the encouragement of my sisters and the love of my wife. I dedicate this work to my grandmother.
iv
Transforming Texts to Maps: Geovisualizing
topics in texts
ABSTRACT
Unstructured textual data is one of the most dominant forms of communication. Especially after the adoption of Web 2.0, there has been a massive surge in the rate of generation of unstructured textual data. While a large amount of information is intuitively better for proper decision-making, it also means that it becomes virtually impossible to manually process, discover and extract useful information from textual data. Several supervised and unsupervised techniques in text mining have been developed to classify, cluster and extract information from texts. While text data mining provides insight to the contents of the texts, these techniques do not provide insights to the location component of the texts. In simple terms, text data mining addresses “What is the text about?” but fails to answer the “Where is the text about?” Since textual data have a large amount of geographic content (estimates of about 80%), it can be safely reasoned that answering “Where is the text about?” adds significant insights about the texts. In this study, a collection of news articles from the year 2017 were analyzed using topic modelling, an unsupervised text mining technique. Topics were discovered from the text collections using Latent Dirichlet Allocation method, a popular topic modelling technique. Topics are probability distribution of words which correspond to one of the concepts covered in the text. Spatial locations were extracted from text documents by geoparsing them. Topics were geovisualized as interactive maps according to the probability of each spatial location word which contributed to the corresponding topic. This is analogous to thematic mapping in Geographical Information System. Coordinates obtained from geoparsed words provide basis for georeferencing the topics while the probability of such location words corresponding to the particular topics provide the attribute value for thematic mapping. An interactive geovisualization of Choropleth maps at the level of country was constructed using the Leaflet visualization library. A comparative analysis between the maps and corresponding topics was made to see if the maps provided spatial context to the topics.
v
KEYWORDS
Text Mining Topic Modelling Geoparsing
Natural Language Processing Geoparsing
Geovisualization Spatial Context
vi
ACRONYMS
API - Application Programming Interface KB - Kilobytes
NLP - Natural Language Processing LDA - Latent Dirichlet Allocation LSI – Latent Semantic Indexing
vii
INDEX OF CONTENT
ACKNOWLEDGEMENTS ... iii ABSTRACT ... iv KEYWORDS ... v ACRONYMS ... viINDEX OF CONTENT ... vii
INDEX OF FIGURES ... ix
INDEX OF TABLES ... x
1. INTRODUCTION ... 1
1.1 Background ... 1
1.2 Aims and objectives ... 3
2. THEORETICAL REVIEW ... 4
2.1 Discovering and extracting information from unstructured texts: Text Mining 4 2.2 Discovering concepts in texts: Topics and Topic Modeling ... 6
2.2.1 Topic ... 6
2.2.2 Topic Modelling Algorithms ... 7
2.2.2 Software Implementations for Topic Modelling ... 10
2.3 Natural Language Processing (NLP) ... 11
2.4 Extracting Location Information from Text ... 12
3. RELEVANT WORKS ... 14
3.1 Relevant works in text mining from newspaper articles ... 14
3.2 Relevant works in topic modelling ... 14
3.3 Relevant works in visualizing texts ... 14
4. DATA... 16
viii
5.1 Building Corpus of News Articles ... 19
5.2 Preprocessing Corpus of News Articles... 19
5.3 Building Machine Readable Corpus and Dictionary ... 22
5.4 Extraction of Topic Model ... 24
5.5 Identification of location information from the collection of text ... 26
5.6 Geovisualization... 27
6. RESULTS AND DISCUSSION ... 29
6.1 Topics ... 29
6.2 Geovisualization... 32
6.3 Discussion ... 47
7. CONCLUSION ... 48
ix
INDEX OF FIGURES
Figure 1: Overview of text mining methods (Source:
http://chdoig.github.io/acm-sigkdd-topic-modeling/#/) ... 4
Figure 2 : Sample terms in topics(Source: (D. Blei et al., 2010)) ... 6
Figure 3: Intutitive digram for Topic Modeling using LDA (D. Blei et al., 2010) ... 8
Figure 4: LDA Plate Notation (D. M. Blei, Ng, et al., 2003) ... 9
Figure 5: LDA Generative Process (Source: (D. M. Blei, Ng, et al., 2003)) ... 10
Figure 6: Chart of Overall Methodology ... 18
Figure 7: Graph of topic Coherence and Numbers ... 26
x
INDEX OF TABLES
Table 1 : Text mining functions and methods ... 5
Table 2 : Common topic modelling methods ... 7
Table 3: List of software for topic modelling ... 10
Table 4: List of popular NLP software ... 12
Table 5: List of popular geoparsing applications ... 13
Table 6: Categories and number of news ... 16
Table 7: Dictionary of Corpus built on BOW model ... 22
Table 8: Document and its representation in form of bag-of-words ... 23
Table 9: Average Topic Model Coherence Values ... 25
1
1. INTRODUCTION
1.1 Background
Among various modes of expressing and storing information, information in the form of text is by far the most dominant. A study by Google in 2010 found that there were almost 130 million books. This is almost double the population of United Kingdom as of 2015 which stood at around 65 million(United Nations, Department of Economic and Social Affairs, 2017). Besides books, textual information is also expressed in other mediums such as newspapers, magazines, letters, brochures, posters, etc. The amount of information in the form of text was already overwhelming even before the advent of digital communication technologies. The advent of digital communication technologies has brought about dramatic rise in generation as well as circulation of information in the form of text. In addition to digitization of traditional mediums of textual information such as books into e-books, newer mediums of textual information were devised such as web pages, blogs, emails, etc. One of transformations from traditional medium to digital medium that deserve special attention is the transformation of newspapers from print to online format. Along with the advent of internet technology, newspaper revenues have dwindled and hence propelled newspapers to either reduce or completely stop print versions and transition into digital format(Bothun, 2016).
A much bigger surge was seen in the amount of textual information with the paradigm shift from Web 1.0 to Web 2.0. Web 2.0 allowed users not only the opportunity to view and consume the information but also create and post their own content (O'Reilly, 2012). After the adoption of Web 2.0, an explosion occurred in generation and circulation of textual information especially after the emergence of social networking sites such as Facebook and microblogging sites such as Twitter.
There is no doubt that the advent of internet technology has brought about access to large amount of information which is useful for informed decision-making. While information is definitely the key to proper decision making, excessive amount of information poses challenges to informed decision-making and possibly be detrimental(Buchanan & Kock, 2001). Larger amounts of information demand larger amount of resources for processing both in terms of processing capacity and time.
2
Humans do not possess infinite information consumption capacity. While it is considered that good decisions come from considering all the information, it is not a rational choice given the vast amount of information (Etzioni, 1989). The availability of large amounts of information but limited human capacity to consume them has stimulated the development of tools and techniques for exploring information from textual information. This science of exploring information from text has developed into a new field known as text mining. In some literature, it is also referred as text data mining. Text data mining can also be considered as exploratory data analysis which is useful in discovering unknown information from the texts (Hearst, 1999). It is to be noted that text data mining is distinct from data mining. In terms of input, data mining functions on already well-defined structured data such as a database. On the other hand, text data mining functions on unstructured text data which is comprehensible to humans but not well structured for directly applying data mining techniques.
Text data mining techniques such as text classification, text clustering, information retrieval, etc., have been successfully applied in several fields for exploratory data analysis from unstructured text(Pultar, Raubal, & Goodchild, 2008). However, text data mining techniques have not directly utilized the location component of the texts for exploration of the texts. The location component in unstructured data is quite strong as captured by the common phrase in geospatial sector, “80% of data have location component”. With such a strong component of unstructured text being geographic, there is little doubt that text mining with a geospatial focus would prove useful. It is not a question of will it be useful but how can it be made useful. One of the strong benefits that could possibly be exploited by considering the location component is that the discovered information can be spatially referenced. As expressed by Russian writer Ivan Turgeney, “The drawing shows me at one glance what might be spread over ten
pages in a book.” A combination of text mining and geovisualization provides more
insight into the unstructured text for discovering information from it.
In this study, it is demonstrated that spatial context can be provided to topics generated from topic modeling by mapping them based upon the probability of spatial terms in the topics. A series of topics and maps are prepared which in tandem provide not only insight into the content or collection of news but also provides spatial insight into the news.
3
1.2 Aims and objectives
The primary aim of this research is to demonstrate that a tandem of topics discovered using topic modelling and geovisualization of individual topics can provide both information about the hidden concepts in the collection of text documents as well as provide spatial insight into the collection.
The objectives of the research are as follows:
a. Extract topics from a corpus of news collection using topic modelling.
b. Extract the probability of spatial terms in each topic and aggregate them to prepare interactive geovisualizatios at the scale of country.
c. Demonstrate that the geovisulizations provide spatial context to the topics through comparative analysis between individual topics and corresponding maps.
4
2. THEORETICAL REVIEW
2.1 Discovering and extracting information from unstructured texts:
Text Mining
The massive rate of text data generation along with already existing text data is one of the biggest impetus to the rapid development in the field of text mining. Text data constitutes useful information in various form of books, newspaper, tweets, posts, blogs, etc. However, given the huge amount of text, manual extraction of information from texts is both costly as well as time-consuming. Also, humans have only so much capacity to consume information and can be overloaded with information leading to bad decision making (Buchanan & Kock, 2001). Hence, computer based automatic methods are advisable for extracting information from texts. However, information in texts based on natural language are in a form that it is anything but easy for machines to extract the hidden information (Hearst, 1999). Understanding and making sense of natural language is a trivial matter to humans but making machines do the same is a formidable challenge.
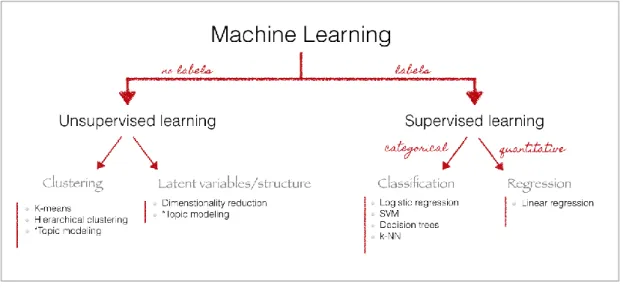
Text mining was first introduced in (Feldman et al., 1998) as the technique to extract non-trivial information from text data(Allahyari et al., 2017). Several text mining methods based on supervised and unsupervised machine learning methods have been developed. The figure below gives a simple overview of some methods in text mining using machine learning. However, it is by no means neither binding nor comprehensive list.
5
Supervised learning methods require labelled training data so as to learn from them and make predictions on the unseen data such as classifying documents into predefined categories. The major limitation in employing supervised learning is the availability of labelled training data that is specific to the purpose and domain of the work. Algorithms based on supervised learning that provide good results for a specific purpose and domain may not provide equally good results for other purposes or different domains. Unsupervised learning in text mining has edge over supervised learning as it does not require training samples. However, unsupervised learning method do not replace supervised learning as all text mining tasks cannot be done only by using unsupervised learning.
The supervised and unsupervised methods developed in text mining are oriented towards fulfilling the following major functions: text categorization; text clustering; concept mining; information retrieval and information extraction(Ghosh, Roy, & Bandyopadhyay, 2012). The major functions in text mining and the methods in accordance to (Allahyari et al., 2017) are presented in the table below.
Table 1 : Text mining functions and methods
Sn. Text mining function Methods used
1 Classification a. Naïve Bayes Classifier b. Nearest Neighbor Classifier c. Decision Tree Classifiers d. Support Vector Machines
2 Clustering a. Hierarchical Clustering Algorithms b. K-means Clustering
c. Probabilistic Clustering and Topic Models
3 Information Extraction a. Named Entity Recognition (NER) b. Hidden Markov Models
c. Conditional Random Fields d. Relation Extraction
6
2.2 Discovering concepts in texts: Topics and Topic Modeling
2.2.1 TopicEach document is a collection of words, the purpose of which is to provide information about various ideas or concepts. An article containing words such as match details, name of players, name of stadiums, etc. is most probably related to sports. Similarly, an article with words such as university, book, lectures, presentation, etc. is most probably related to education. A collection of words that signify a concept or idea is a topic. A collection of document can contain one or thousands of topics. Similarly, a single document can contain one or several topics.
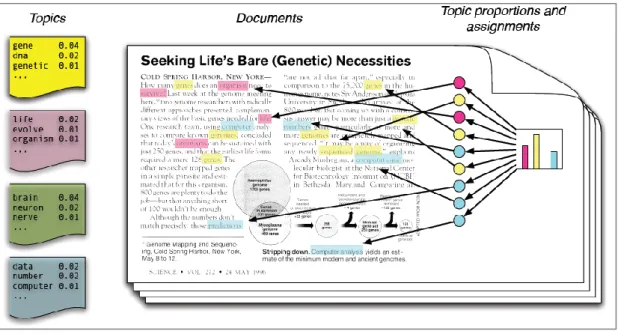
In order to visualize a large collection of texts, it is of prime importance to know the different hidden concepts that the text contains. While it is possible to manually discover the topics, it is not a practical option for large collection of documents. It is where topic modelling comes into play. The outcome of topic modelling is a list of collections of words that provides an idea of concepts covered in the documents. The diagram presented below from the paper (D. Blei, Carin, & Dunson, 2010) gives a lucid example of topic.
7
The top 15 words in each of the four topics are displayed in the above figure. The list of words gives insight to the contents in the collection of texts to a human reader. It is clear from the figure above that the contents of the texts from which the topics were generated covered at least four concepts; namely genetics, evolution, disease and computers.
2.2.2 Topic Modelling Algorithms
The premise of topic modelling is that a collection of text document contains various hidden topics. And each document contains one or more topics at varying proportions(Zhao et al., 2015). Several methods have been proposed and implemented for topic modelling. Some of the common methods used for topic modelling are listed in the table below.
Table 2 : Common topic modelling methods
Sn. Topic Modelling Method
1 Latent Semantic Analysis (LSA)
2 Probabilistic Latent Semantic Analysis (PLSA) 3 Latent Dirichlet Allocation (LDA)
Each of the topic modelling methods has its own strengths and shortcomings. A brief discussion of these methods is presented here.
a. Latent Semantic Analysis (LSA)
LSA was developed with the motivation of automatic indexing and retrieval of documents as querying based on same words were plagued by synonymy and polysemy. Instead of matching words, LSA tries to discover the latent structure of the documents. LSA is based on Singular Value Decomposition (SVD) of a matrix of terms by documents which reduces the dimension of the matrix and essentially creates a semantic space. In this semantic space, terms and documents that are conceptually similar are located close to each other (Deerwester, Dumais, Furnas, Landauer, & Harshman, 1999). LSA is able to discover latent concepts; address synonymy and polysemy; and also considers term dependence (Rosario, 2000). However, the
8
theoretical foundation of LSA not sound and as described by (Thomas, 1999); it is incomplete and unsatisfactory.
b. Probabilistic Latent Semantic Analysis (pLSA)
pLSA is an improvement over LSA with sound statistical foundation. It was introduced by Thomas Hofmann in his paper(Thomas, 1999). pLSA models each word in a document as a sample from a mixture model. The components of the mixture model are the topics. Although, pLSA is an improvement over LSA, it still does not provide probabilistic model at the level of documents(D. M. Blei, Edu, et al., 2003).
c. Latent Dirichlet Allocation (LDA)
LDA is an improvement over pLSA. It is an unsupervised generative probabilistic method for discovering topics where each document is considered as a random mixture of topics and each topic is considered as a distribution of words(D. M. Blei, Edu, et al., 2003). LDA can associate a single document with multiple documents unlike clustering algorithms and is in line with the nature of documents since there is no guarantee that a single document contains only a single topic. Most documents tend to be heterogeneous in nature covering many concepts. This is shown in the figure below which was included in the paper (D. Blei et al., 2010).
9
Although the figure above shows a single document, it is modelled as constituting of finite number of topics. The document is modelled into four topics as shown in the left side of the figure above. In a document, the topics have various proportions depending upon the content of the document. Topics that are extracted using LDA are represented in the form of word probabilities. The words with the highest probabilities indicate the concept of that topic. Let us consider a topic as shown below to elucidate this.
(0.010*"elephant" + 0.008*"ivory" + 0.007*"wildlife" + 0.005*"trade" + 0.005*"ban" + 0.005*"poacher" + 0.005*"poach" + 0.005*"country" + 0.005*"south_africa" + 0.004*"work" + ……….)
In the topic above, the words with highest probabilities suggest that the topic is likely about wildlife smuggling and that too focusing on elephants’ ivory.
Given the solid statistical foundation of LDA, it is the most common method for topic modelling(Zhao et al., 2015). The sheer number of extensions of LDA as presented in (Jelodar, Wang, Yuan, & Feng, 2017) suggest LDA as an effective topic modelling method.
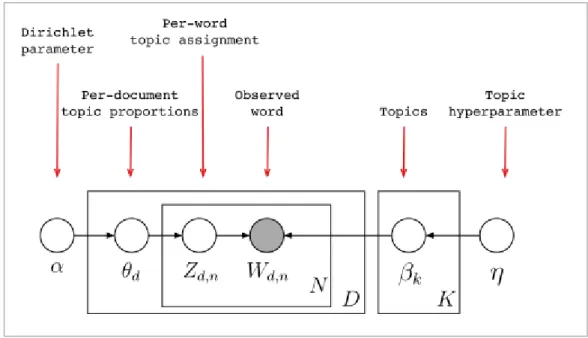
The graphical model of LDA as presented in (D. M. Blei, Ng, & Jordan, 2003) is presented below.
10
The boxes in the figure above are called plates. The outer plate (left side) represents the documents and the inner plate represents topics and words that are in a document. The only observable entities are the words. A sequence of N words makes a document (w) and collection of M documents make a corpus. The generative process followed by LDA as presented in (D. M. Blei, Edu, et al., 2003) is presented in the figure below.
Figure 5: LDA Generative Process (Source: (D. M. Blei, Ng, et al., 2003))
A rigorous mathematical discussion of LDA is avoided here. However, in very simple terms, the following process is follow:
a. Words are randomly assigned to topics.
b. A word w is decided to belong to a topic z in a document D by considering the following conditions:
i. How common is the word w in the topic z in other documents? ii. How common is the topic z in that particular document?
c. Step (b) is repeated for all the words unless consistency is achieved.
2.2.2 Software Implementations for Topic Modelling
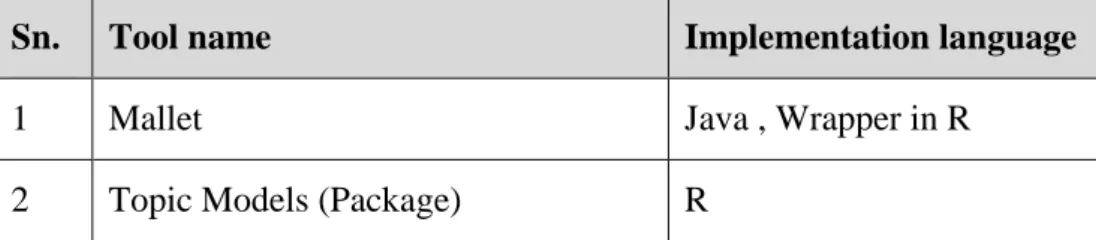
There exists a large number of tools that can perform topic modelling, particularly LDA. These are listed in the table below.
Table 3: List of software for topic modelling
Sn. Tool name Implementation language
1 Mallet Java , Wrapper in R
11
3 LDA (Package) R
4 Gensim Python
5 LDA-C C
6 GibbsLDA++ C and C++
7 Stanford Topic Modeling Toolbox Java
In this study, we selected Gensim as our choice for implementing topic modelling. Gensim is open source python library for topic modelling. It has large user and developers’ community. It supports topic modelling, document indexing and similarity retrieval. Gensim has implementations of Latent Semantic Analysis (LSA), Latent Dirichlet Allocation (LDA) and Hierarchical Dirichlet Process (HDP). The Genism package implements a variation of LDA based upon the paper Online Learning for Latent Dirichlet Allocation (Hoffman, Blei, & Bach, 2010) which allows handling of large amounts of document collection including data that arrives in stream. The choice for Gensim in this study was due to the memory efficiency of the package. The package uses generators and iterators which are part of the Python for streamed data processing. The streamed data processing allows processing of large amount of text data even with lower processing capabilities.
2.3 Natural Language Processing (NLP)
Natural Language Processing (NLP) is a computerized approach to analyze the texts. Some of the most common tasks in natural language processing are word tokenization, sentence tokenization, part of speech tagging, named entity recognition, dependency parsing, coreference resolution, etc. NLP provides tools and techniques for text mining as well as topic modelling. In this study, NLP is used for preprocessing the textual data before they are feed into topic modelling algorithms.
12
Table 4: List of popular NLP software
Sn. Software/Tool/Package Implementation Language 1 Natural Language Toolkit Python
2 Spacy Python
3 Stanford Core NLP Java, Python Wrappers
4 Apache OpenNLP Java
In this study, Spacy was selected as the tool for Natural Language Processing. It is an open source package and has a large user community as well as developer community. It comes with pre-trained statistical models and supports multiple languages. One of the reason for selecting Spacy was that it is implemented in Python which made integrating it to topic modelling much easier.
2.4 Extracting Location Information from Text
While topics extracted using topic modelling provides theme for visualization, location information from texts are essential for georeferencing the topics for geovisualization. While it is a mundane task for humans, automatic location extraction is a challenging field with a large amount of research work. One of the very active research and development field in this field is Named Entity Recognition (NER). NER identifies words that denote person, organization, location, object, etc. Different NER implementations have different classes of entities(Atdaǧ & Labatut, 2013).While NER identifies several classes of entities, only entities having location information are of interest for the purpose of georeferencing the topics. Almost all popular natural language processing software have facility for recognizing named entities. While named entity recognizes the names entities with locations, it is also necessary to extract the geographic location name of the entity. Digital gazetteers are specifically constructed to have unambiguous location information. Digital gazetteers contain structured information about geographic location. Digital gazetteers are particularly useful for automated and unambiguous georeferencing of location information in a text
13
which is called geoparsing(Goodchild & Hill, 2008). Some of the popular geoparsing tools and services are listed in the table below.
Table 5: List of popular geoparsing applications
Sn Software/Tool/Service Implementation
1 Clavin Java
2 Mordecai Python
3 Geoparse.io RESTful web API Python API
In this study, Geoparse.io is used for geoparsing the texts. It is a RESTful web API that returns the information about the locations on the request text as GeoJSON. The Geoparse.io web API uses GeoNames geographical database as digital gazetteer. Although it is not free, it allows 1000 API calls for free per month. Geoparse.io was selected for this study as it has a small learning curve as well as API in python.
14
3. RELEVANT WORKS
3.1 Relevant works in text mining from newspaper articles
There have been several domain specific studies that have utilized topic modelling to discover concepts from collections of texts as topics. Text mining from newspapers is one of the most active research area. Newspaper are the source of unedited and unmodified version of history which arouses interest to researchers who want to get insight to history(Cheney, 2013). The digitization of historical newspapers by libraries has also opened the opportunity for research in this field. The availability of such a data that spans decades if not centuries provides opportunities to study the changes in human history. (Torget, Mihalcea, Christensen, & Mcghee, 2010) used sample of around 230,000 pages of historical newspapers analysing the quantity and quality of the digitized content along with measurement of language pattern. (Godbole & Srinivasaiah, 2007) analysed sentiment from news and blogs. (Akhter, 2015) extracted information related to road accidents and visualized them interactively.
3.2 Relevant works in topic modelling
Studies that have considered both topic modelling and location component have primarily intended to improve topic modelling by segregating the texts based upon the location. (Hu & Ester, 2013) used locations of posts on social media to model user profiles using topic modelling and spatial location for improving location recommendation. (Pölitz, 2015) used spatial locations in newspapers and social media for explore topics in those regions. (Yin, Cao, Han, Zhai, & Huang, 2011) also used documents which were embedded with GPS coordinates for topic modelling to find topics that are coherent in a particular geographic region.
3.3 Relevant works in visualizing texts
A large number of studies exists in text visualizations. Also hundreds of text visualization techniques have been developed. (Cao & Cui, 2016) reviewed more than 200 papers based on text visualization techniques accumulated in Text Visualization
15
Browser (http://textvis.lnu.se/). The paper identified five categories of text visualizations which are listed below.
a. Visualization of document similarity.
b. Visualization for revealing content of the document c. Visualization of sentiments and emotions in the text d. Visualization of the corpus
e. Visualization of domain-specific rich-text corpus
These techniques cover large and wide sectors of visualizing texts. However, even among such a large number of visualization techniques, texts are not visualized with focus on the location. The emphasis is on visualizing “What is the text about?” The component of “Where is the text about?” remains unanswered. There is a compelling motivation for development of text visualization technique that combines both the textual and spatial components of text data and provide spatial insight from large collection of texts.
One of the prominent works in the field of visualization is known as Spatialization. Spatialization is one of the emerging fields in visualization that uses the techniques developed in context of spatial visualization to visualize non-spatial information. Spatialization is efficient approach to visualizing non-spatial information as the audience use their spatial cognition abilities that is associated with the geographic map(Skupin, 2002). While Spatialization is a promising field for text visualization, its focuses on visualization of non-spatial information in a map-like fashion. There is still a void in research works related to geovisualization of concepts in texts.
16
4. DATA
In this section, a brief summary of the news data used in this study is provided. An overview of the collection and filtering process is also discussed.
News from different online news sources were downloaded that belonged to the year 2017. All of the news were semi-automatically downloaded based upon the following seven keywords (category) in Google. The keywords and the number of news articles are presented in the table below.
Table 6: Categories and number of news
Sn. Keyword (Category)
No. of articles
Visual representation of number of articles
1 World Cup 60 2 Wildlife Poaching 35 3 Tornado 84 4 Nuclear War 46 5 Election 98 6 Ebola 91 7 Deforestation 98 Total 512
The articles were downloaded by automatizing the process by writing scripts in Python. The scripts are stored in GitHub and access to it can be provided on request. Newspaper3k python package was used for downloading the articles. The package can
17
be accessed on GitHub at https://github.com/codelucas/newspaper. Significant number of files less than 3KB contained artefacts or were empty. Hence, all files less than 3KB were removed. Also, files larger than 8KB were filtered as geoparsing API header size was limited to 8KB. The above table shows the numbers of articles that persisted after filtered. It is to be noted that although the news articles are downloaded based on several categories, these are feed into topic modelling algorithms without any annotations. The categories are used only for making comparisons between news collection, topics and geovisualizations.
18
5. METHODOLOGY
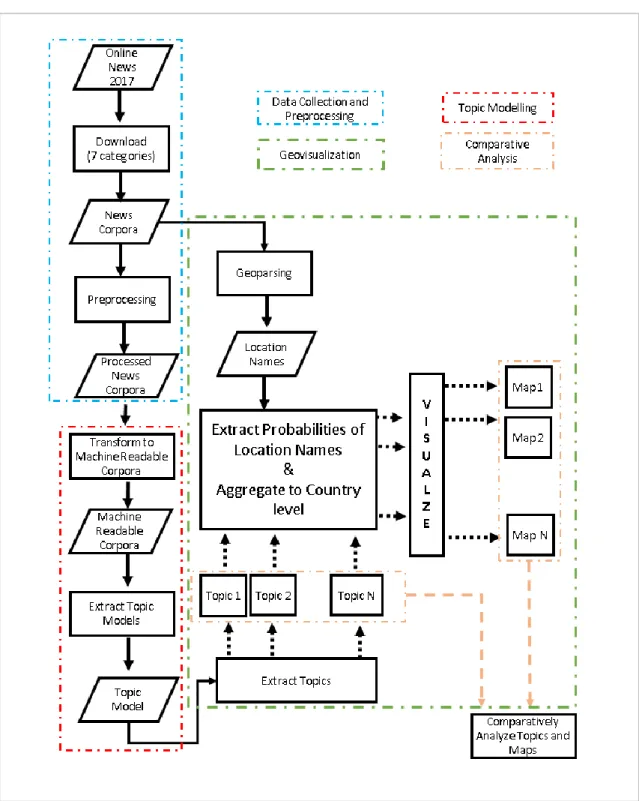
This section elaborates on the process that initiates from collection of the online news articles to geovisualization of the articles in the form of interactive maps. The theoretical background of the methodologies applied here are discussed in chapter 2: theoretical review. A chart of overall methodology is presented in the figure below.
19
5.1 Building Corpus of News Articles
This procedure of collection and filtration of news articles is explained in Chapter 4: Data. Once done through this process, we already have a corpus suitable for our study. In our study, we perform topic modelling using Latent Dirichlet Allocation (LDA) algorithm which is an unsupervised learning algorithm. Hence, the news articles are not annotated based upon their category. The necessity of building our own corpus is well expressed in (Xiao, 2010) which states that although there exits thousands of corpus, these are created for certain research purposes and most are not available publicly. It is one of the most time consuming and costly processes in text mining.
5.2 Preprocessing Corpus of News Articles
Before any textual data is fed into a topic modelling algorithm, it must be preprocessed in order to get rational results. This is fairly expressed in the saying, “Garbage in, Garbage out”. In fact, it is one of the most time consuming processes after the data has been collected. The quality of the results is highly sensitive to the preprocessing steps. Preprocessing of the corpus involves several Natural Language Processing (NLP) tasks. In this study, Spacy was used for preprocessing. The rational for choosing Spacy is explained in Section 2.2.2: Software Implementation. The following preprocessing were applied to the corpus of the news articles.
a. Tokenization
Tokenization is the process of segmenting a document into individual word, punctuations, symbols, etc. Tokenization is based upon series of tokenization rules. These rules dictate when to split the words and when to preserve them.
Example document:
“One of the measures introduced by lawmakers would remove conservation protection from 1.2 million hectares of the Amazon forest, an area larger than Jamaica. U.K. has made expressed its resentment to this decision.”
20 Tokenized document:
[One, of, the, measures, introduced, by, lawmakers, would, remove, conservation, protection, from, 1.2, million, hectares, of, the, Amazon, forest, ,, an, area, larger, than, Jamaica, ., U.K., has, made, expressed, its, resentment, to, his, decision, .]
It can be observed that words such as U.K and number 1.2 are preserved based upon the tokenization rules.
b. Text Lemmatization
Lemmatization converts the words into its canonical or citation form(Bird, Klein, & Loper, 2009). The lemmatized form of sentence mentioned in above example is presented below.
Lemmatized document:
['one', 'of', 'the', 'measure', 'introduce', 'by', 'lawmaker', 'would', 'remove', 'conservation', 'protection', 'from', '1.2', 'million', 'hectare', 'of', 'the', 'amazon',
'forest', ',', 'an', 'area', 'large', 'than', 'jamaica', '.', 'u.k.', 'have', 'make', 'express', '-PRON-', 'resentment', 'to', 'this', 'decision', '.']
These words are lemmatized because words such as “measures”, “Measure”,
“measured” have same meaning in context of topic modelling and hence are
transformed to its canonical form “measure”. Spacy lemmatizes the pronoun such as
“its” to “-PRON-“.
c. Removal of stop-words
Stop-words are such words in a text which do not add any value to the purpose of the study. The purpose of the study dictates whether a word is to be considered stop-word. Each NLP software come with their own set of stop-words. Although, there is some overlap between them, there is no consensus in a universal set of stop-words. In fact, defining stop-words is an iterative process. The results are examined and the words that add no meaning to the results are added to the list of stop-words. The following example shows the document after removal of stop-words.
21
Document after removal of stop-words from the example document in (a :
['one', 'measure', 'introduce', 'lawmaker', 'remove', 'conservation', 'protection', '1.2', 'million', 'hectare', 'amazon', 'forest', ',', 'area', 'large', 'jamaica', '.', 'u.k.', 'express', 'resentment', 'decision', '.']
The words 'of', 'the', 'by', 'would', 'from', 'an', 'than', 'have', 'make', '-PRON-', 'to' and
'this' were removed from the above document as these words add no value to topic modelling in our study.
d. Remove numbers, punctuation marks, symbols
Numbers, punctuation marks and symbols are removed from the text as these do not add any value to the topic modelling but instead act as noise.
Document after removal of numbers, punctuation marks and symbols:
[one, measure, introduce, lawmaker, remove, conservation, protection, hectare, amazon, forest, area, large, jamaica, express, resentment, decision]
e. Detect bigrams and trigrams
A combination of words such as nuclear weapon, tectonic plate, car race, ministry of education, etc., provide different meaning in combination than the individual words. These words, if treated as separate words, would provide different insight than what is intended in the texts. These words are called n-grams. Bigrams are combination of two words and trigrams are combination of three words. N-gram identification is especially important because the study has implemented bag-of-words model for transforming words to vectors as bag-of-words model do not preserve the order of the words. Bigrams and trigrams are highly prevalent in names of locations such as Pacific Ocean, Suez Canal, Kathmandu Valley, Grao de Castellon, etc. As these locations are to be mapped, bigrams and trigrams are identified in the texts and are processed as single entity. In this study, only bigrams and trigrams were considered. However, depending upon the language and the contents in the collection of texts, it is necessary to implement higher level of n-grams.
22
Examples of bigrams and trigrams detected from the study corpus:
[national_team, alexis_sanchez, semi_final, fifa_world_cup, sri_lanka, saudi_arabia, emergency_management_society]
5.3 Building Machine Readable Corpus and Dictionary
Computers are inefficient in processing text data. In text mining, it is common to process thousands of documents. Hence, it is necessary to convert the text corpus into a format which facilitates faster processing. The words are converted into vectors for rapid processing since computers are much more efficient in handling numbers than strings. There are several algorithms for converting words to vectors. Some of the methods consider the grammar and the word order. In our study, bag-of-words (BOW) model was applied to convert words into vectors. The bag-of-words method disregards the grammar as well as the order of the words. It only considers the frequency of words in the text collection. According to this method, every word in a collection of text documents is given a unique integer id. This mapping of word into unique id is called a dictionary. The dictionary is used to map the unique ids back to tokens after the topic models are generated. Each word in a particular document is represented by a 2 dimensional vector. The first element of the vector is the unique integer id and the second element is the frequency of the word in that document. In this way, a document is a collection of 2 dimensional vectors. In Gensim, this collection is represented as a list. Also all of the documents are also represented as lists. Hence, the machine readable corpus implementation in Gensim is a list of lists.
In our study, there are 17446 unique words after preprocessing the corpora of news articles. The dictionary is shown in the table below.
Table 7: Dictionary of Corpus built on BOW model
Sn Word (token) : Unique Token Id
23 2 ‘reexamine’ : 1 3 ‘financial’ : 2 4 ‘commitment’ : 3
.
.
.
.
.
.
.
.
.
.
17445 ‘susceptibility’ : 17444 17446 ‘presser’ : 17445The study data has 512 documents. So, the corpus is a list of 512 lists. A sample of a document and its representation in corpus is shown in the table below.
Table 8: Document and its representation in form of bag-of-words
Document Corpus in form of word vectors
Norway reexamined its financial commitment to the Amazon Fund as a result of Brazil's ever-weakening environmental protection policies. On Friday, Brazilian President Michel Temer met with Norwegian Prime Minister Erna Solberg in Oslo to promote investment in the South American country.
. . .
Other proposed measures include relaxing the environmental licensing rules for big
infrastructure projects, opening sales of farmland to foreigners and loosening rules for approving new mining projects. They are expected to be passed by Brazil's Congress in coming months. [(0, 2.0), (1, 2.0), (2, 2.0), (3, 2.0), (4, 6.0), (5, 5.0), (6, 2.0), (7, 9.0), (8, 2.0), (9, 6.0), (10, 6.0), (11, 3.0), (12, 1.0), (13, 2.0), (14, 3.0), (15, 1.0), (16, 4.0), (17, 2.0), (18, 3.0), (19, 1.0), (20, 1.0), (21, 3.0), (22, 1.0), (23, 1.0), (24, 1.0), (73, 1.0), (74, 1.0), (75, 1.0), (76, 1.0), 1.0), (126, 1.0), (127, 1.0), (128, 1.0), (129, 1.0), (130, 1.0), . . . .(161, 1.0), (162, 1.0), (163, 1.0), (164, 1.0), (165, 2.0), (166, 1.0), (167, 1.0), (168, 2.0), (169, 1.0), (170, 1.0), (171, 1.0), (172, 1.0), (173, 1.0), (174, 1.0), (175, 1.0), (176, 1.0), (177, 1.0), (178, 1.0), (179, 1.0), (180, 1.0)]
24
5.4 Extraction of Topic Model
Topic models are generated from the machine readable corpus (list of list of word vectors). In this study, the topic model was generated using Latent Dirichlet Allocation (LDA). The rationale behind selecting LDA for topic modelling in this study is discussed in section 2.2. The functioning of LDA is explained in section 2.2.1. The implementation was done using Gensim, a python package for topic modelling. The scripts are stored in GitHub and access can be provided on request. While the implementation of a topic model is a routine procedure, deciding the number of topics to build the topic model is still one of the unanswered question. Many methods have been suggested but there is no unanimous method. Traditional methods in determining the number of topics uses measures such as perplexity, held-out likelihood, etc. However, topic models obtained using these measures did not always provided topics that were interpretable to humans and as a result failed the goal of exploration of the corpus(Chang, Gerrish, Wang, & Blei, 2009). Indirect methods requiring human participation were also proposed such as word intrusion and topic intrusion. However, indirect methods require human participation which may not be always practicable. Topic coherence measures were introduced as direct measures to assess the quality of topics and hence can be applied in case of automated implementation(Röder, Both, & Hinneburg, 2015). In this study, UMass coherence implementation of Gensim was applied to measure the average coherence of the topic model. Another parameter to consider in defining topic model is the number of iterations. Again, there is no straight forward method for determining the number of iterations.
The choice of parameters in topic modelling is based upon the purpose of the study. In this study, the purpose is to geovisualize the topics. If the number of topics is minimized, there is a high chance that the geolocation of the topics would overlap. Locations that are irrelevant or less likely to be associated with a topic in reality may contribute to it if there are fewer number of topics due to mixing of the topics. Therefore it is better to maximize the number of topics to avoid overlap as well as maximize the topic coherence. Hence, in this study, numerous topic models were generated with series of topic numbers and iterations while computing topic coherence for each pair of topic number and iteration. The results are presented in the table below.
25
The values highlighted in red is the highest average coherence value for each topic model given the number of topic and number of iterations.
Table 9: Average Topic Model Coherence Values
No. of Topics Iteration 400 500 600 700 800 900 1000 1500 2000 2500 3000 5 Av er ag e T o p ic Mo d el C o h er en ce -1.32 -1.68 -1.25 -2.22 -1.13 -1.33 -1.68 -0.97 -0.94 -1.45 -1.19 6 -1.14 -1.28 -1.09 -1.38 -0.96 -1.26 -1.07 -1.07 -1.54 -1.26 -1.44 7 -1.20 -1.64 -0.87 -1.44 -1.78 -1.12 -0.95 -0.98 -1.60 -0.88 -1.34 8 -1.18 -1.12 -1.34 -1.43 -1.10 -1.42 -0.87 -1.37 -1.51 -0.96 -1.54 9 -1.16 -1.30 -1.50 -1.56 -0.93 -0.94 -1.55 -1.43 -0.87 -1.31 -0.94 10 -1.53 -1.16 -1.20 -1.55 -0.86 -0.86 -1.37 -1.33 -1.47 -1.42 -1.18 11 -1.89 -1.28 -1.27 -1.50 -1.71 -1.83 -1.36 -1.48 -1.37 -2.03 -1.38
The table above indicates that average topic model coherence values for topic model with 10 topics and either 800 or 900 iterations is maximum. However, this approach also has its some setbacks. As the LDA is a generative method, the same parameters do not provide the same topic coherence values each time the model is run. Also, it was observed that concepts with smaller number of documents were not discovered when number of topics was fixed as suggested by the average topic model coherence values.
Hence, a common method followed in topic modelling was adopted which is to set a sufficiently large number of topics but only use the ones with good coherence values. In this way, it is possible to explore topics which have smaller proportion in the corpora. In this study, number of topics was set to 30 which is three times the number of topics based upon the average topic model coherence (table 9). Also we set number of iterations sufficiently large at 3000. Once the topics were generated, topic coherence for each topic was computed. A graph of the topic coherence was prepared which is presented below.
26
Figure 7: Graph of topic Coherence and Numbers
The graph has a breakpoint at serial number 10 with smoothly dwindling value of topic coherence from serial number 10 to 30. There is a massive drop in coherence for the last topic. The topics and hence the geovisualizations must be considered along with the topic coherence for a comprehensive understanding of the concepts in the corpus. The generated topics are presented in the results section along with the geovisualizations.
5.5 Identification of location information from the collection of text
The location information is critical in Geovisualizing the topics as it is used to georeference the topics. The location information is extracted by geoparsing the texts. In this study, Geoparser.io is used for geoparsing the texts. The rationale behind using Geoparser.io is discussed in section 2.4. Geoparser.io is implemented as a RESTful web API. It is not free but provides 1000 free API calls per month. The response of the API call is in GeoJSON format. The response has the following information of interest: name of the location, country, state/province level administrative division, geographic feature type and coordinate. In this study, only the name and coordinate of the location is utilized. A sample geovisualization of the geoparsed text is shown in the figure below. 20 21 27 12 14 13 5 6 22 25 3 16 19 4 8 17 0 2328 2 24 26 29 9 1 18 7 15 11 10 -14.00 -12.00 -10.00 -8.00 -6.00 -4.00 -2.00 0.00 0 1 2 3 4 5 6 7 8 9 10 11 12 13 14 15 16 17 18 19 20 21 22 23 24 25 26 27 28 29 30 31 Top ic C oher
ence Topic Numbers
27
Text Geovisualization of the geoparsed text
“One of the measures introduced by lawmakers would remove
conservation protection from 1.2 million hectares of the Amazon forest, an area larger than Jamaica. U.K. has made expressed its
resentment to this decision.”
Figure 8: Text and visualization of geoparsed text
5.6 Geovisualization
The mapping of topics is analogous to mapping of a thematic layer in cartography. The thematic layer is first georeferenced according to the location it covers. Then it is symbolized according to one of its attribute value. For example, a population map is georeferenced based upon the administrative boundaries. Then the population of each administrative unit is used to symbolize the map. A similar approach is followed in mapping the topics. Each topic is analogous to a thematic layer. It is georeferenced based upon the location words in the topic. To explain this more clearly, let us consider a representative topic derived using LDA. It is a probability distribution of words contributing to the topic. By interpreting the top words (words having highest probabilities), it can be interpreted that the topic represents the concept of poaching elephants for its ivory.
(0.010*"elephant" + 0.008*"ivory" + 0.007*"wildlife" + 0.005*"trade" + 0.005*"ban" + 0.005*"poacher" + 0.005*"poach" + 0.005*"country" + 0.005*"south_africa" + 0.004*"work" + 0.004*”china” + ……….……….)
To georeferenced the topic above, the probabilities of the words that can be georeferenced are considered. In other terms, the probabilities of each word can be
28
assumed as the contribution the topic. Location words with higher probabilities have higher contribution to the topic. Considering the topic above, it can be assumed that South Africa and China have a larger role poaching of elephants for its ivory. This contribution to the topic of location words is analogous to attributes of thematic layer and is used in the same manner for the purpose of geovisualization. In a more formal way, the attribute value of a location word (L) for a topic (T) is the probability of the location L in the topic T.
In this study, the mapping is done at the level of country. While, it is possible to map the individual locations without aggregating to a higher administrative level, the small size of study corpora meant the contribution of individual location word is too small to create distinctive geovisualization.
A web based interactive visualization was built using Leaflet visualization library. Choropleth maps were prepared for geovisualizing the topics. The probabilities of the location words (which are considered as attribute values for geovisualization) are normalized for consistent geovisualization among all the topics. The maps are included in the result section. Also, qualitative analysis of the maps are done to see if they fit the concepts expressed in the collection of newspaper articles. This is done by making comparisons between the top terms in a topic, countries where the topics had higher aggregated probability (contribution) values and the content of the news. This analysis is presented in the discussion section.
29
6. RESULTS AND DISCUSSION
In this chapter, we discuss the results of the topic modelling in Section 6.1. In section 6.2, the geovisualization of topics are presented. Also, a qualitative examination is done to inspect if the geospatial context provided by geovisualization is indeed able to geolocate the topics.
6.1 Topics
Each topic generated using topic modelling consists of probabilistic distribution of word. If the words with the highest probabilities (top words) are coherent and indicates a common concept, only then the topics can reveal human interpretable concepts. As explained in the methodology (Section 5.4: Extraction of Topic Model), there is no universally accepted method for determining the number of topics. In this study, topic models were generated by setting the number of topics as 30 and topic coherence was computed for each topic as explained in the methodology section. These topics are presented in the table below along with the topic number and topic coherence. It is ordered on the basis of topic coherence.
Table 10: Topics generated using LDA
Sn Topic
Number Topic terms
Topic Coherence
1 20
'0.021*"north_korea" + 0.012*"nuclear" +
0.010*"trump" + 0.008*"missile" + 0.007*"military" + 0.006*"kim" + 0.006*"war" + 0.005*"north_korean" + 0.005*"united_states" + 0.005*"nuclear_weapon"'
-0.81
2 21
'0.021*"ebola" + 0.014*"virus" + 0.010*"outbreak" + 0.010*"disease" + 0.007*"sierra_leone" +
0.007*"vaccine" + 0.007*"people" + 0.006*"time" + 0.006*"country" + 0.006*"work"'
-0.89
3 27
'0.027*"tornado" + 0.020*"damage" + 0.018*"storm" + 0.013*"county" + 0.013*"home" + 0.009*"area" + 0.007*"report" + 0.007*"tree" + 0.006*"near" + 0.006*"road"'
-0.93
4 12
'0.020*"election" + 0.019*"party" + 0.011*"vote" + 0.006*"campaign" + 0.006*"coalition" +
0.005*"candidate" + 0.005*"lead" + 0.005*"merkel" + 0.005*"government" + 0.004*"political"'
30
5 14
'0.026*"company" + 0.020*"deforestation" + 0.013*"forest" + 0.012*"palm_oil" + 0.008*"policy" + 0.008*"report" + 0.006*"global" + 0.006*"supply_chain" + 0.005*"government" + 0.005*"risk"'
-1.01
6 13
'0.027*"forest" + 0.012*"deforestation" + 0.009*"area" + 0.008*"land" + 0.007*"carbon" + 0.007*"tree" + 0.006*"year" + 0.005*"study" + 0.005*"country" + 0.005*"government"'
-1.06
7 5
'0.018*"election" + 0.014*"kenyatta" + 0.012*"odinga" + 0.012*"kenya" + 0.009*"result" + 0.008*"opposition" + 0.008*"president" + 0.007*"vote" + 0.007*"country" + 0.006*"supreme_court"'
-1.08
8 6
'0.014*"world_cup" + 0.013*"england" + 0.010*"team" + 0.007*"draw" + 0.006*"final" + 0.006*"play" +
0.005*"pot" + 0.005*"time" + 0.005*"win" + 0.005*"player"'
-1.14
9 22
'0.021*"world_cup" + 0.012*"fifa" +
0.009*"tournament" + 0.009*"brazil" + 0.008*"team" + 0.007*"host" + 0.006*"country" + 0.006*"bid" +
0.006*"morocco" + 0.005*"play"'
-1.16
10 25
'0.023*"group" + 0.015*"team" + 0.014*"play" + 0.012*"win" + 0.011*"world_cup" + 0.010*"final" + 0.010*"place" + 0.009*"russia" + 0.009*"qualify" + 0.008*"match"'
-1.16
11 3
'0.009*"people" + 0.008*"outbreak" + 0.007*"country" + 0.006*"disease" + 0.006*"drc" + 0.005*"program" + 0.005*"year" + 0.005*"study" + 0.005*"health" + 0.004*"way"'
-1.49
12 16
'0.008*"election" + 0.007*"vote" + 0.007*"party" + 0.005*"seat" + 0.004*"moore" + 0.004*"government" + 0.004*"win" + 0.004*"majority" + 0.004*"support" + 0.004*"work"'
-1.79
13 19
'0.012*"forest" + 0.009*"deforestation" + 0.007*"land" + 0.007*"year" + 0.007*"government" + 0.006*"new" + 0.006*"fire" + 0.005*"brazil" + 0.004*"temer" +
0.004*"president"'
-2.33
14 4
'0.012*"elephant" + 0.006*"wildlife" + 0.006*"hsbc" + 0.006*"trade" + 0.006*"government" + 0.006*"poacher" + 0.006*"country" + 0.006*"poach" + 0.005*"ban" + 0.005*"south_africa"'
-2.53
15 8
'0.007*"people" + 0.006*"storm" + 0.006*"county" + 0.005*"area" + 0.005*"damage" + 0.005*"election" + 0.004*"service" + 0.004*"sunday" + 0.004*"president" + 0.004*"tornado"'
31
16 17
'0.007*"china" + 0.006*"new" + 0.005*"state" + 0.005*"country" + 0.004*"peru" + 0.004*"year" + 0.004*"percent" + 0.003*"time" + 0.003*"north_korea" + 0.003*"hattiesburg"'
-2.94
17 0
'0.010*"tps" + 0.008*"people" + 0.008*"status" + 0.007*"country" + 0.006*"paul" + 0.006*"work" + 0.006*"liberia" + 0.005*"area" + 0.005*"job" + 0.005*"memphis"'
-2.98
18 23
'0.014*"ivory" + 0.008*"china" + 0.006*"event" + 0.006*"year" + 0.006*"tiger" + 0.005*"ban" +
0.005*"elephant" + 0.004*"change" + 0.004*"market" + 0.004*"world"'
-3.34
19 28
'0.011*"world_cup" + 0.008*"bbc" + 0.007*"itv" + 0.006*"team" + 0.005*"year" + 0.005*"soccer" + 0.004*"match" + 0.004*"country" + 0.004*"try" + 0.004*"time"'
-3.66
20 2
'0.006*"people" + 0.006*"country" + 0.005*"need" + 0.005*"vaccine" + 0.004*"information" +
0.004*"emission" + 0.004*"odong" + 0.004*"work" + 0.004*"government" + 0.004*"include"'
-4.34
21 24
'0.007*"hurricane" + 0.006*"cerrado" + 0.005*"animal" + 0.005*"wildlife" + 0.004*"year" + 0.004*"loss" + 0.004*"forest" + 0.004*"world" + 0.004*"like" + 0.003*"people"'
-4.47
22 26
'0.007*"area" + 0.006*"redd+" + 0.005*"include" + 0.004*"severe_thunderstorm" + 0.004*"season" + 0.004*"temperature" + 0.004*"initiative" +
0.004*"tornado" + 0.003*"intervention" + 0.003*"high"'
-4.64
23 29
'0.010*"kit" + 0.008*"design" + 0.007*"brazil" + 0.006*"wear" + 0.006*"world_cup" + 0.005*"norway" + 0.004*"year" + 0.004*"time" + 0.004*"look" +
0.004*"red"'
-5.17
24 9
'0.005*"irs" + 0.004*"year" + 0.004*"scam" +
0.004*"email" + 0.004*"hickox" + 0.004*"quarantine" + 0.004*"people" + 0.004*"work" + 0.004*"country" + 0.003*"day"'
-5.46
25 1
'0.009*"air" + 0.007*"people" + 0.006*"france" + 0.006*"party" + 0.006*"macron" + 0.006*"french" + 0.006*"pen" + 0.006*"sensor" + 0.005*"year" + 0.005*"defense"'
-5.90
26 18
'0.009*"tornado" + 0.005*"fema" + 0.005*"year" + 0.004*"time" + 0.004*"state" + 0.003*"myth" + 0.003*"frack" + 0.003*"process" + 0.003*"issue" + 0.003*"area"'
32
27 7
'0.006*"state" + 0.004*"world" + 0.004*"japan" + 0.004*"year" + 0.003*"japanese" + 0.003*"new" + 0.003*"people" + 0.003*"come" + 0.003*"sri" + 0.003*"student"'
-7.08
28 15
'0.007*"drug" + 0.006*"north_carolina" +
0.005*"dengue" + 0.005*"spartanburg" + 0.004*"cell" + 0.004*"einav" + 0.003*"viral" + 0.003*"combination" + 0.003*"mouse" + 0.003*"stanford"'
-8.48
29 11
'0.008*"april" + 0.004*"river" + 0.004*"township" + 0.004*"come" + 0.004*"elver" + 0.004*"storm" + 0.004*"akombe" + 0.003*"bowne" + 0.003*"creek" + 0.003*"tyler"'
-8.80
30 10
'0.012*"prison" + 0.007*"drug" + 0.007*"die" + 0.006*"burial" + 0.005*"der" + 0.005*"und" + 0.005*"riot" + 0.004*"fda" + 0.004*"staff" + 0.004*"record"'
-12.16
The topics generated shows that they are strongly related to the categories of the news corpus. It means that the topics are generated are useful in revealing the different concepts hidden in the corpus. The topics with higher values of topic coherence are much easier to interpret and it is also much easier to relate these topics with the categories of news.
6.2 Geovisualization
Geovisualization of the topic (as obtained in section 6.1) was done using Leaflet visualization library as explained in section 5.6. In this section, the topics and the geovisualized choropleth maps are presented in tandem along with the rank and topic coherence. The order of the maps is based on the coherence value of each topic It is observed that topic with higher ranking (based upon coherence value) are more human interpretable. Also, the spatial context provided by geovisualization is relatable to the topics. It is difficult to relate geovisualizations of topics with lower coherence values to the topics. Hence, geovisualizations of only 14 topics with higher coherence values are presented in this section.
33 (i)
Topic Number: Topic Coherence Topic Rank
20 -0.81 1/30
Topic Terms
'0.021*"north_korea" + 0.012*"nuclear" + 0.010*"trump" + 0.008*"missile" + 0.007*"military" + 0.006*"kim" + 0.006*"war" + 0.005*"north_korean" + 0.005*"united_states" + 0.005*"nuclear_weapon"'
Snapshot of Geovisualization
Countries with larger normalized Contributions North Korea, USA, China
Relatable News Category Nuclear Weapon
Reason for the countries to be highly covered in the news in 2017
North Korea and USA have a long history of adversary over North Korea developing nuclear weapon. China plays a role of middleman with strategic interests over North Korea.
34 (ii)
Topic Number: Topic Coherence Topic Rank
21 -0.89 2/30
Topic Terms
'0.021*"ebola" + 0.014*"virus" + 0.010*"outbreak" + 0.010*"disease" + 0.007*"sierra_leone" + 0.007*"vaccine" + 0.007*"people" + 0.006*"time" + 0.006*"country" + 0.006*"work"'
Snapshot of Geovisualization
Countries with larger normalized Contributions Congo, Sierra Leone
Relatable News Category Ebola
Reason for the countries to be highly covered in the news in 2017
There was an Ebola outbreak in Congo which was later contained. The aftermaths of Ebola outbreak in Sierra Leone was a highlight in the news.
35 (iii)
Topic Number: Topic Coherence Topic Rank
27 -0.93 3/30
Topic Terms
'0.027*"tornado" + 0.020*"damage" + 0.018*"storm" + 0.013*"county" + 0.013*"home" + 0.009*"area" + 0.007*"report" + 0.007*"tree" + 0.006*"near" + 0.006*"road"'
Snapshot of Geovisualization
Countries with larger normalized Contributions USA, UK
Relatable News Category Tornado
Reason for the countries to be highly covered in the news in 2017
USA had one of the most active start to tornado season in 2017. UK has more tornadoes than any other country relative to its size.
36 (iv)
Topic Number: Topic Coherence Topic Rank
12 -0.94 4/30
Topic Terms
'0.020*"election" + 0.019*"party" + 0.011*"vote" + 0.006*"campaign" + 0.006*"coalition" + 0.005*"candidate" + 0.005*"lead" + 0.005*"merkel" + 0.005*"government" + 0.004*"political"'
Snapshot of Geovisualization
Countries with larger normalized Contributions USA, Germany, Russia, Canada
Relatable News Category Election
Reason for the countries to be highly covered in the news in 2017
USA alleged Russia that it hacked the election system and influenced US Presidential election. National elections held in Germany.
37 (v)
Topic Number: Topic Coherence Topic Rank
14 -1.01 5/30
Topic Terms
'0.026*"company" + 0.020*"deforestation" + 0.013*"forest" + 0.012*"palm_oil" + 0.008*"policy" + 0.008*"report" + 0.006*"global" + 0.006*"supply_chain" + 0.005*"government" + 0.005*"risk"'
Snapshot of Geovisualization
Countries with larger normalized Contributions USA, Canada, Indonesia
Relatable News Category Deforestation
Reason for the countries to be highly covered in the news in 2017
38 (vi)
Topic Number: Topic Coherence Topic Rank
13 -1.06 6/30
Topic Terms
'0.027*"forest" + 0.012*"deforestation" + 0.009*"area" + 0.008*"land" + 0.007*"carbon" + 0.007*"tree" + 0.006*"year" + 0.005*"study" + 0.005*"country" + 0.005*"government"'
Snapshot of Geovisualization
Countries with larger normalized Contributions USA, Pakistan, Columbia, Cambodia, Canada, Australia, Congo
Relatable News Category Deforestation
Reason for the countries to be highly covered in the news in 2017
Rise in deforestation in Columbia and Cambodia. Columbia, Cambodia and Congo have tropical rainforests.