Bios: Biological input-output systems
Texto
Imagem
![Figure 2.1 - Closed Circulatory System. [2]](https://thumb-eu.123doks.com/thumbv2/123dok_br/15867294.1087568/17.892.216.659.560.1023/figure-closed-circulatory.webp)
![Figure 2.2 - Inside Heart Chambers. [6]](https://thumb-eu.123doks.com/thumbv2/123dok_br/15867294.1087568/20.892.250.667.420.792/figure-inside-heart-chambers.webp)
![Figure 2.4 - Representation of Five Seconds of an ECG Trace. [10]](https://thumb-eu.123doks.com/thumbv2/123dok_br/15867294.1087568/22.892.238.661.312.638/figure-representation-seconds-ecg-trace.webp)

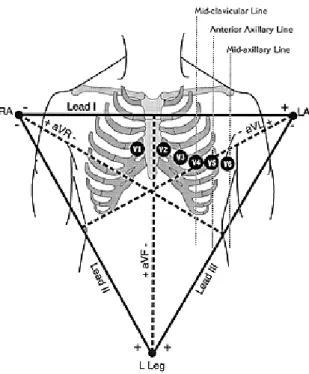
![Figure 2.9 - Representation of Leads I, II and III in an Axial Reference System. [12]](https://thumb-eu.123doks.com/thumbv2/123dok_br/15867294.1087568/28.892.245.675.719.921/figure-representation-leads-i-ii-iii-axial-reference.webp)

Documentos relacionados
Immunochemical FOBTs were superior in sensitivity, specificity, positive predictive value and negative predictive value compared to the toluidine chemical test in evaluating
Table 2 shows the sensitivity, specificity, positive and negative predictive values grouped into different incubation periods for PCR in samples of solid culture medium.. The
Results: We observed sensitivity of 90.7%, specificity of 89.1%, a positive predictive value of 72.1%, a negative predictive value of 96.9% and a positive likelihood ratio of 9.0
Results: The sensitivity, specificity, positive predictive value and negative predictive value obtained during the performance comparison of the two methods (cord factor detection
2 - Characteristics and definitions of the main indices used in the analysis of diagnostic tests: SEM = sensitivity; SPE = specificity; PPV = positive predictive value; NPV =
The specificity, sensitivity, and positive and negative predictive values of audiometric screening conducted with the TS audiometer were high and similar to those obtained with
The sensitivity, specificity, positive predictive value, negative predictive value, likelihood ratio for a positive test, likelihood ratio for a negative test, and accuracy of
Results: The sensitivity, specificity, positive predictive value and negative predictive value obtained during the performance comparison of the two methods (cord factor detection
