1 Computerised respiratory sounds can differentiate smokers and non- smokers
1 2
Ana Oliveira1,3 MSc, PT, [email protected]; Ipek Sen2 PhD, EE, [email protected]; Yasemin P.
3
Kahya2 PhD, EE, [email protected]; Vera Afreixo3,4 PhD, Math, [email protected]; Alda Marques1, 3
4
PhD, PT, [email protected] 5
6
1 Lab 3R – Respiratory Research and Rehabilitation Laboratory, School of Health Sciences 7
(ESSUA), University of Aveiro, Aveiro, Portugal 8
2 Department of Electrical and Electronics Engineering, Bogazici University, Istanbul, Turkey 9
3 Institute for Research in Biomedicine (iBiMED), University of Aveiro, Aveiro, Portugal 10
4 Institute of Electronics and Informatics Engineering of Aveiro (IEETA), Aveiro, Portugal 11
12
Corresponding author: Alda Marques, PT, MSc, PhD, Senior Lecturer, Lab 3R – Respiratory, 13
Rehabilitation and Research, School of Health Sciences, University of Aveiro (ESSUA), Agras do 14
Crasto - Campus Universitário de Santiago, Edifício 30, 3810-193 Aveiro, Portugal. Email: 15
ACKNOWLEDGMENTS 17
This work has been developed within a European Respiratory Society Short Term Fellowship 18
[grant number STRTF 2013-3055] and partially supported by FEDER through COMPETE and FCT 19
under project UID/BIM/04501/2013 and by National Funds through FCT, in the context of the 20
projects UID/CEC/00127/2013 and Incentivo/EEI/UI0127/2014. The authors would also like to 21
acknowledge to all participants involved and to Cátia Pinho and José Semedo for their assistance 22
in data analysis. 23
2 ABSTRACT
1
Purpose: Cigarette smoking is often associated with the development of several respiratory 2
diseases however, if diagnosed early, the changes in the lung tissue caused by smoking may be 3
reversible. Computerised respiratory sounds have shown to be sensitive to detect changes 4
within the lung tissue before any other measure, however it is unknown if it is able to detect 5
changes in the lungs of healthy smokers. This study investigated the differences between 6
computerised respiratory sounds of healthy smokers and non-smokers. 7
Methods: Healthy smokers and non-smokers were recruited from a university campus. 8
Respiratory sounds were recorded simultaneously at 6 chest locations (right and left anterior, 9
lateral and posterior) using air-coupled electret microphones. Airflow (1.0-1.5 l/s) was recorded 10
with a pneumotachograph. Breathing phases were detected using airflow signals and respiratory 11
sounds with validated algorithms. 12
Results: Forty-four participants were enrolled: 18 smokers (mean age 26.2, SD= 7 years; mean 13
FEV1 % predicted 104.7, SD= 9) and 26 non-smokers (mean age 25.9, SD= 3.7 years; mean FEV1
14
% predicted 96.8, SD= 20.2). Smokers presented significantly higher frequency at maximum 15
sound intensity during inspiration [(M=117, SD= 16.2 Hz vs. M= 106.4, SD= 21.6 Hz; t(43) = -2.62, 16
p=0.0081, dz =0.55)], lower expiratory sound intensities (maximum intensity: [(M= 48.2, SD= 3.8 17
dB vs. M= 50.9, SD= 3.2 dB; t(43) = 2.68, p=0.001, dz =-0.78)]; mean intensity: [(M= 31.2, SD= 3.6
18
dB vs. M= 33.7,SD= 3 dB; t(43) = 2.42, p=0.001, dz =0.75)] and higher number of inspiratory
19
crackles (median [interquartile range] 2.2[1.7-3.7] vs. 1.5 [1.2-2.2], p=0.0081, U= 110, r=-0.41) 20
than non-smokers. 21
Conclusions: Significant differences between computerised respiratory sounds of smokers and 22
non-smokers have been found. Changes in respiratory sounds are often the earliest sign of 23
3 disease. Thus, computerised respiratory sounds might be a promising measure to early detect 1
smoking related respiratory diseases. 2
Key-words: computerised auscultation; sound spectrum; crackles, early diagnosis; smoking 3
Abstract word count: 295 4
INTRODUCTION 5
Cigarette smoking is often associated with inflammation, obstruction and destruction of the lung 6
parenchyma and airways [1]. These continuous aggressions to the lung tissue place smokers in 7
a vulnerable position to acquire viral and bacterial respiratory infections (e.g., lower respiratory 8
tract infections). If recurrent, respiratory infections potentiate progressive pathological changes 9
in the small airways that may cause airflow obstruction and ultimately chronic respiratory 10
diseases [2]. Nevertheless, it has been shown that initial changes in the pulmonary tissue caused 11
by smoking may be reversible with optimal management [3]. 12
The early diagnosis of most common chronic respiratory diseases is challenging, mainly due to 13
the lack of sensitivity of the current outcome measures (e.g., chest X ray and lung function tests) 14
[4,5]. Thus, it is essential to find sensitive measures to early detect changes in the lungs of 15
smokers that may indicate respiratory complications. 16
Several studies have been reporting on the potential of computerised respiratory sounds to 17
provide useful clinical information, as they are directly related to movement of air, changes 18
within the lung tissue and position of secretions within the tracheobronchial tree [6-8]. Although 19
few studies exist on the use of computerised techniques to acquire respiratory sounds in 20
smokers, contradictory information is provided. Laird et al., (1974) [9] and Gavriely et al., (1994) 21
[10] studied respiratory sounds of approximately 300 healthy smokers and non-smokers 22
reporting the presence of “abnormal” sound spectrum and wheezes. Conversely, new evidence 23
gathered by Gavriely et al., (1995) [11] and Gross et al., (2000) [12] indicates no differences 24
4 between the sound intensity of smokers and non-smokers. However, these studies focused 1
mainly on normal respiratory sounds and little attention has been given to the presence of 2
adventitious respiratory sounds (i.e., crackles and wheezes), which are often the earliest sign of 3
disease, even before any changes being detected in imaging techniques [13]. Further research 4
is therefore warranted. 5
This study investigated the differences between computerised respiratory sounds, normal and 6
adventitious, of healthy smokers and non-smokers. 7
METHODS 8
Study design and Participants 9
A cross-sectional study with healthy smokers and non-smokers recruited from a university 10
campus was conducted between March and May 2014. Participants were included if they were 11
healthy non-smokers defined as life-long non-smokers, with no medical history suggestive of 12
airway disease (i.e., no known diagnosis of a respiratory disease or chronic medication for the 13
respiratory system) and normal spirometry. Healthy smokers were included using the same 14
criteria as healthy non-smokers, except they were current smokers. Healthy non-smokers were 15
excluded if they were past smokers. Participants, both smokers and non-smokers, were 16
excluded if they were taking medication for the respiratory system, had an acute respiratory 17
disease or presented any acute respiratory symptom (i.e., cough, dyspnoea, sputum) up to one 18
month before data collection, presented chronic respiratory diseases, cardiac diseases, 19
neurological impairments, current/previous history of pulmonary lobectomy, neoplasic disease 20
or immunological disease and/or significant musculoskeletal disorders (e.g., kyphoescoliosis) 21
that could affect respiratory acoustics. 22
Approval for this study was obtained from a national Ethics Committee in compliance with the 23
Declaration of Helsinki. The study was advertised in flyers and distributed in the community. 24
5 Volunteers willing to participate contacted the researchers. In this first contact, researchers 1
provided detailed explanations about the study, verified participants’ eligibility and scheduled 2
an appointment to perform data collection. Written informed consent was obtained from all 3
individual participants included in the study, prior to any data collection. 4
Data collection procedures 5
Socio-demographics (gender, age), anthropometric (height, weight and body mass index - BMI) 6
and clinical (smoking habits in pack‐years) data were collected first with a structured 7
questionnaire. The activities limitation resulting from dyspnoea were assessed with the 8
modified Medical Research Council questionnaire – mMRC [14]. Then, computerised respiratory 9
sounds and lung function, assessed according to the European Respiratory Society guidelines 10
[15], with a portable spirometer (Micro 1, CareFusion, Kent, UK), were recorded. The parameters 11
extracted from the spirometer were the percentage predicted of forced expiratory volume in 12
one second (FEV1 % predicted), the percentage predicted of forced vital capacity (FVC %
13
predicted) and the ratio between both (FEV1 % predicted/FVC % predicted). All assessments
14
were performed by two researchers in a standardised order. 15
Respiratory sounds and airflows were recorded simultaneously and synchronized via a multi-16
channel respiratory sounds data acquisition device custom-developed in the Lung Acoustic 17
Laboratory at Bogazici University, Istanbul, Turkey (see [16] for the technical details of a five-18
channel version of the same device). The system included six air-coupled electret microphones 19
(SONY ECM-44 BPT), a Fleisch type pneumotachograph (Validyne CD379, Northridge, Calif), an 20
analog amplifier-filter unit, an analog-to-digital converter and a laptop computer running a 21
graphical user interface program implemented in LabVIEW. Microphones, located into capsules 22
made of Teflon [17], were attached on the participant’s skin with adhesive tapes (CPK Roll-fix 23
10cm-width) at six chest locations (right and left: anterior, lateral and posterior) [18]. 24
6 The analog amplifier-filter unit used has an overall gain of 200 and a pass-band of 80 - 4000 Hz 1
(a sixth-order Bessel high-pass filter with 80 Hz cut-off to filter out heart and muscle noise, 2
followed by an eight-order Butterworth low-pass filter with 4000 Hz cut-off for anti-aliasing). 3
The airflow signal was passed through a second order unity-gain Butterworth low-pass filter with 4
a cut-off frequency of 35 Hz.The pre-processed analog data (six-channel sound signals and the 5
airflow signal) were simultaneously converted into digital form via a data acquisition card (NI 6
DAQCard-6024E) in 12-bit resolution and a sample frequency in each channel of 11025 samples 7
per second, and transferred to the laptop computer. The recorded data were later converted to 8
.wav format. 9
Each data acquisition session lasted for 20-seconds [19]. Environmental conditions were kept 10
under tight control to prevent external noise during recordings. Participants were in a seated-11
upright position, wearing a nose clip and breathing through a mouthpiece at a standardised 12
airflow (1.0-1.5L/s). Visual feedback regarding airflows and respiratory sounds was obtained via 13
the graphical user interface program. 14
Signal processing 15
Firstly, breathing phases (i.e., inspiration and expiration) were automatically detected using the 16
positive and negative portions of the flow signals recorded, and the sound signals were 17
separated and labelled accordingly. Secondly, for each inspiration and expiration, the power 18
spectra of the normal respiratory sound signals was estimated via the Welch’s method adopting 19
256-point Hamming windows with 50% overlap, and 2^14-point fast Fourier transformation. 20
Thirdly, for each estimated spectrum, the following parameters were calculated: percentile 21
frequencies f25, f50, and f75, maximum intensity (Imax), frequency at maximum intensity 22
(Fmax), mean intensity over the whole frequency range (Imean), and the mean intensities over 23
the following frequency intervals: 100-300 Hz, 300-600 Hz, 600-1200 Hz and 1200-2000 Hz. 24
Finally, the values of each parameter calculated for inspirations were summed and dived by the 25
7 total number of inspirations; and the values of each parameter calculated for expirations were 1
summed and dived by the total number of expirations. The sound intensities were calculated in 2
dB, and the reference used was the baseline noise of the data acquisition system (1.5 * 10-10 3
W). 4
Crackles were detected using a validated algorithm based on the combination of fractal 5
dimension and box filtering techniques [20]. Wheezes were detected using an algorithm based 6
on time-frequency analysis [21]. The number of crackles, initial deflection width (IDW), largest 7
deflection width (LWD), two-cycle duration (2CD), wheeze occupation rate and frequency (Hz) 8
of crackles and wheezes per breathing phase were extracted. Crackle and wheeze detection 9
were performed using Matlab®R2011a. 10
Statistical analysis 11
Descriptive statistics were used to describe the sample. Socio-demographic and clinical 12
characteristics between groups were compared with Independent Samples t-test for continuous 13
normally distributed data (FEV1 % predicted/FVC % predicted ratio), Mann-Whitney U test for
14
continuous non-normally distributed and ordinal data (age, FEV1 % predicted, FVC % predicted,
15
BMI, pack‐years, mMRC) and Fisher's exact test for categorical data (gender). 16
To simplify the interpretability of the findings, for each chest region (anterior, lateral and 17
posterior), the results from the right and left locations were pooled by a simple polling method 18
(i.e., the individual values acquired from right and left locations were averaged and placed in the 19
database under the headings of anterior, lateral and posterior, according to the region from 20
which they have been taken and then the analysis comparing regions between smokers and non-21
smokers was performed as if the data of each region were derived from a single sample) [22,23]. 22
Then, the number of participants with crackles and wheezes in each chest region was calculated 23
8 and Fisher’s exact test was used to investigate the groups’ differences on the number of 1
participants presenting crackles and wheezes. 2
Finally, comparisons between smokers and non-smokers at anterior, lateral and posterior chest 3
regions were performed using Independent Samples t-test for normally distributed data (i.e., 4
normal respiratory sound parameters) and Mann-Whitney U test for non-normally distributed 5
data (i.e., adventitious respiratory sound parameters). Bonferroni corrections were applied for 6
the number of comparisons performed per respiratory sound parameter (i.e., 6 comparisons per 7
respiratory sound parameter) between smokers and non-smokers. Thus, the level of significance 8
was set at 0.0083. 9
Statistical analyses were completed with the estimation of effect sizes via Cohen’s d for 10
Independent Samples t-test [24] and r for Mann-Whitney U test [25]. Cohen’s dz effect sizes were
11
interpreted as a small (≥0.2), medium (≥0.5) or large (≥0.8) [24] and r as small (r ≥0.2), medium 12
(r ≥0.3) or large (r ≥0.5) effects [24]. Statistical analyses were performed using IBM SPSS Statistics 13
version 20.0 (IBM Corporation, Armonk, NY, USA) and plots created using Matlab®R2011a and 14
GraphPad Prism version 5.01 (GraphPad Software, Inc., La Jolla, CA, USA). 15
RESULTS 16
Participants 17
Fifty-four volunteers agreed to participate in the study. However, 1 participant did not complete 18
the assessment and 8 were excluded due to: asthma (n=1), presence of acute respiratory 19
symptoms (i.e., cough, sputum and fatigue) two days prior to data collection (n=1) and past 20
history of smoking habits (n=6). One participant was posteriorly excluded from the data analysis 21
due to poor quality of the sound recording (i.e., movement artefacts and external noise). In total, 22
44 healthy participants were enrolled: 18 smokers (mean age 26.2, SD= 7 years; mean FEV1 %
23
predicted 104.7, SD= 9) and 26 non-smokers (mean age 25.9, SD= 3.7 years; mean FEV1 %
9 predicted 96.8, SD= 20.2). All participants presented normal body composition and lung 1
function, however, smokers reported significantly higher levels of dyspnoea at the mMRC 2
questionnaire (median [interquartile range] 0.5 [0-1] vs. 0 [0], U= 135, p=0.002, r=-0.47). No 3
differences were observed for the remaining variables (Table 1). 4
(Please insert table 1 about here) 5
Computerised respiratory sounds 6
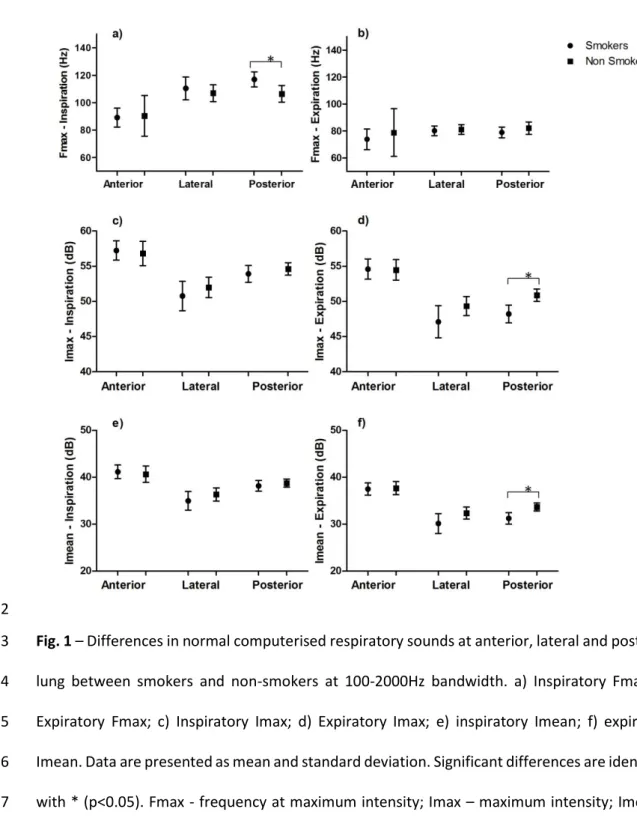
Differences in normal respiratory sounds between smokers and non-smokers were only 7
observed at the posterior region. Smokers presented significantly higher inspiratory Fmax 8
[(M=117, SD= 16.2 Hz vs. M= 106.4, SD= 21.6 Hz; t(43) = -2.62, p=0.0081, dz =0.55)] and lower 9
expiratory intensity, both Imax [(M= 48.2, SD= 3.8 dB vs. M= 50.9, SD= 3.2 dB; t(43) = 2.68, 10
p=0.001, dz =-0.78)] and Imean [(M= 31.2, SD= 3.6 dB vs. M= 33.7,SD= 3 dB; t(43) = 2.42, p=0.001, 11
dz =0.75)] (Figure 1). Figure 2 shows the average spectrum of the respiratory sounds recorded 12
form all participants at anterior, lateral and posterior chest. 13
(Please insert figure 1 about here) 14
(Please insert figure 2 about here) 15
Most participants presented at least one crackle per breathing cycle in all the assessed chest 16
locations, however no differences were found between groups for the number of participants 17
with crackles (p>0.05). Significant differences in the number of crackles were found at the 18
anterior/upper region, where smokers presented significantly higher number of inspiratory 19
crackles (2.2 [1.8-3.7] vs. 1.5 [1.2-2.2], p=0.0081, U= 110, r=-0.41) than non-smokers (Figure 3). 20
No differences were found for the remaining crackle parameters. Fig. 4 shows a respiratory 21
sound presenting a crackle acquired at posterior chest from a smoker participant. 22
10 (Please insert figure 3 about here)
1
(Please insert figure 4 about here) 2
Wheezes were observed in a reduced number of participants, mainly at the posterior regions of 3
smokers [n= 10 (56%)]. No differences were found between groups regarding the number of 4
participants with wheezes or the characteristics of wheezes (p>0.05). Fig. 5 shows spectrograms 5
of RS recorded at anterior chest from a smoker, presenting wheezes, and a non-smoker 6
participants. 7
(Please insert figure 5 about here) 8
A detail description of normal respiratory sounds, crackles and wheezes characteristics in each 9
group can be found in the online supplementary material. 10
DISCUSSION 11
According to the authors’ best knowledge, this is the first study comparing normal and 12
adventitious computerised respiratory sounds between healthy smokers and non-smokers. The 13
main findings indicated that smokers present significantly higher inspiratory Fmax, lower 14
expiratory sound intensity and higher number of inspiratory crackles than non-smokers. 15
Frequency at maximum power provides information on the frequency range of the sound 16
activity [26], and its increase during histamine challenges is often related with airway narrowing 17
in patients with asthma and COPD [27]. In the present study, such increase was already found 18
during normal breathing manoeuvres in the posterior lower lung of very light smokers (i.e., less 19
than 5 pack‐years), which may indicate some degree of early bronchial constriction in the 20
smaller airways of this population. Nevertheless, previous literature, has reported no 21
differences in this variable between healthy and diseased populations [12,28,27]. The 22
differences between these previous studies and the present one, may be explained by 23
11 methodologic and recruitment dissimilarities. It is known that Fmax depends mainly on the cut-1
off frequency of the high-pass filter [12], which in the present study was lower (80Hz) than in 2
the previous literature (100Hz) [28,27] in order to also analyse adventitious respiratory sounds 3
[29]. Also, previous studies tended to have older populations [12,28] and to include light 4
smokers in the non-smokers group [12]. The present results should however be interpreted with 5
caution and further studies with similar standardised protocols are yet needed. 6
Maximum and mean respiratory sound intensities have been reported as an objective indicator 7
of regional pulmonary ventilation, with high sound intensities indicating strong pulmonary 8
ventilation [30,8]. Nevertheless, this variable is also dependent on the respiratory flows 9
achieved during the breathing manoeuvre [30,8], and for that reason each participant’s 10
inspiratory and expiratory flow was standardized at 1-1.5 l/s. This respiratory flow should result 11
in a lung volume of approximately 30% of vital capacity, which, in young subjects, is the lung 12
volume at which all airways are open and when breath sound intensity corresponds to 13
pulmonary ventilation [31]. In the present study, smokers presented lower Imax and Imean than 14
non-smokers for the same airflow, which might already indicate poorer pulmonary ventilation. 15
Crackles have been associated with a variety of lung diseases, such as pulmonary fibrosis, 16
congestive heart failure and pneumonia [7,32] and one recent systematic review has indicated 17
that particularly inspiratory crackles are often reported in the computerised auscultation of 18
patients with COPD [33]. This is particularly relevant for the present study, as smokers presented 19
significantly more inspiratory crackles than non-smokers. It is known that tobacco smoking is 20
the leading cause of COPD [34], and thus the detection of inspiratory crackles in smokers may 21
be a promising method for the early diagnosis of this disease. Nevertheless, these results should 22
be interpreted with caution, as no significant differences in the number of crackles were found 23
between smokers and non-smokers in the study of Alzahrani, M. (2011)[35]. There are 24
methodological reasons that might explain the dissimilarities observed. In the study of Alzahrani, 25
M. (2011), the airflow was not controlled, respiratory sounds were acquired with a digital 26
12 stethoscope and crackles were analysed with the Vannuccini, et al (1998)[36] algorithm, 1
whereas in the present study, airflow was controlled, respiratory sounds were acquired with a 2
multichannel microphones equipment and crackles were analysed with Pinho, et al 3
algorithm[20]. Therefore, these methodological options may have influenced the results and 4
consequent differences observed. More research with larges samples, respiratory volume/flow 5
control and similar acquisition and analysis methods are needed to draw stronger conclusions 6
about crackles ability to distinguish between smokers and non-smokers. 7
The absence of wheezes in the present study was expected as it is known that the effects of 8
smoking are firstly detected in the smaller airways [37] and wheezes are only generated by 9
airflow limitation in larger airways (until the 7th generation of the tracheobronchial tree) [38].
10
Nevertheless, it should also be noticed that wheezes might occur when there is flow limitation, 11
but flow limitation is not necessarily accompanied by wheezes [38], and thus it could have 12
happened that the respiratory flow used in this study was not enough to generate wheezes. 13
Studies involving forced manoeuvres and higher flow levels are needed to further explore the 14
presence of wheezes in smokers. 15
The mechanisms for changes in respiratory sounds caused by tobacco smoking are not well 16
understood however, it may be attributed to the development of inflammatory processes in the 17
smaller airways. Tobacco smoke contains toxic gases which when inhaled into the lungs might 18
originate both local and systemic inflammatory responses by stimulating alveolar macrophages 19
to release inflammatory mediators [1]. Consequently, these macrophage cells release protease 20
to break down connective tissue in the lung parenchyma and also stimulate mucus 21
hypersecretion around damaged tissue, ultimately leading to airway obstruction and 22
emphysema. Airway obstruction is likely to affect the distribution and extent of turbulence and 23
flow within the bronchi, causing poor regional ventilation, and consequently lower respiratory 24
sound intensity [11]. Emphysema might have an impact on the air movement in the distal 25
13 airways causing some of them to close and open irregularly depending on the air volume, 1
generating crackles. 2
Differences in sound amplitude and in the number of crackles are often audible by the human 3
ear in severe respiratory conditions, such as pneumonia and interstitial lung diseases [30]. 4
Although statistically significant and with medium effect sizes, the differences between smokers 5
and non-smokers were of approximately 2dB and 1 crackle per breathing cycle which would 6
probably not be detected by human ear. This highlights the potential of using computerised 7
respiratory sounds especially in primary care settings for the early diagnosis of respiratory 8
diseases among smokers. 9
It should also be noticed that smokers already presented some degree of activities limitation 10
resulting from dyspnoea. Dyspnoea is the most common symptom limiting activities 11
performance and the major reason for referral to respiratory rehabilitation programs in patients 12
with chronic respiratory diseases [39]. The fact that such light and young smokers already exhibit 13
this symptom should be a call for early intervention in educational fields (i.e., universities, 14
colleges, high schools) to advice for the effects of tobacco smoking. Further studies involving 15
dyspnoea reports during exercise are needed to confirm this finding. 16
This study has some limitations that need to be acknowledged. Firstly, respiratory sounds from 17
right and left regions were pooled to compute comparisons. Differences in lung acoustics 18
between right and left lung are well documented in the literature [26,40,41], however the main 19
aim of this study was to detect differences between two populations and not to establish 20
reference values. Thus, because the same methodology was used for both groups, it is not 21
believed that this could have affected the results. Nevertheless, health professionals should be 22
aware of these differences when assessing patients in clinical practice. Moreover, the three 23
chest regions were studied separately however, it is still unknown if the same sound was being 24
captured in the different regions, as respiratory sounds were collected simultaneously. This 25
14 could have influenced our findings. Nevertheless, this methodology was used in both groups and 1
this is a relatively unexplored area where further research is yet needed to understand its clinical 2
implications. 3
Secondly, “healthy smokers’” were selected based on a pure clinical definition and although this 4
criteria has been used by others [11,42,35], it is recognised that it presents some limitations, as 5
it cannot be guaranteed that these participants do not have an undiagnosed respiratory 6
condition or will not develop one in the near future. However, smoker participants were very 7
light smokers compared to those enrolled in previous research (pack‐years 2.2 [0.9-5.5] vs. 8
25±17 [11] vs. 5.6 ± 4.9 [42]), and presented similar spirometry values than non-smokers, which 9
provides confidence to rely that a respiratory condition was absent. 10
Thirdly, many comparisons were conducted on the respiratory data and this could have 11
increased type I error, i.e., rejecting the null hypothesis when it should not be rejected. However, 12
because comparisons were only carried out between smokers and non-smokers (no 13
comparisons were conducted among regions and respiratory phases within each group), we 14
believe that the likelihood of increasing this error was controlled. Nonetheless, Bonferroni 15
corrections have also been applied to control for this type of error. 16
Fourthly, the sample size used in this study was exploratory and might not have been sufficient 17
to detect truly significant changes between smokers and non-smokers in other parameters. 18
Thus, studies with sample size estimations are needed. This exploratory study is a first step 19
towards the use of computerised respiratory sounds in the screening of respiratory diseases 20
among smokers and could be used as a pilot study to compute sample sizes in future studies. 21
Finally, the complex set up used to record respiratory sounds and airflow may be perceived as a 22
limitation to the use of computerised respiratory sounds in the clinical practice, namely in 23
15 primary care settings. Future research should focus in developing technologies for acquiring high 1
quality data at bedside with minimal setup. 2
CONCLUSION 3
Computerised respiratory sounds allowed to detect differences in the sound intensity and 4
number of crackles of healthy smokers and non-smokers, indicating that light smokers already 5
present significantly lower sound intensity and higher number crackles than non-smokers. Thus, 6
it can be suggested that computerised respiratory sounds may be successfully implemented in 7
clinical practice as a useful method for early diagnosis smoking related respiratory diseases. 8
Funding: This work has been developed within a European Respiratory Society Short Term 9
Fellowship [grant number STRTF 2013-3055]. This work was also partially supported by FEDER 10
through COMPETE and FCT under project UID/BIM/04501/2013 and by National Funds through 11
FCT, in the context of the projects UID/CEC/00127/2013 and Incentivo/EEI/UI0127/2014. 12
Conflict-of-interest statement: The authors declare that they have no conflict of interest. 13
Ethical approval: “All procedures performed in studies involving human participants were in 14
accordance with the ethical standards of the institutional and/or national research committee 15
and with the 1964 Helsinki declaration and its later amendments or comparable ethical 16
standards.” 17
16 REFERENCES
1
1. Milner D (2004) The physiological effects of smoking on the respiratory system. Nurs Times 2
100 (24):56-59 3
2. Saldías F, Díaz O (2011) Cigarette Smoking and Lower Respiratory Tract Infection. In: Martin-4
Loeches I (ed) Bronchitis. InTech. doi:10.5772/17652 5
3. Beane J, Sebastiani P, Liu G et al. (2007) Reversible and permanent effects of tobacco smoke 6
exposure on airway epithelial gene expression. Genome Biol 8 (9):R201. doi:10.1186/gb-2007-7
8-9-r201 8
4. Marques A, Bruton A, Barney A (2006) Clinically useful outcome measures for physiotherapy 9
airway clearance techniques: a review. Physical Therapy Reviews 11 (4):299-307. 10
doi:10.1179/108331906X163441 11
5. Parkes G, Greenhalgh T, Griffin M et al. (2008) Effect on smoking quit rate of telling patients 12
their lung age: the Step2quit randomised controlled trial, vol 336. vol 7644. 13
doi:10.1136/bmj.39503.582396.25 14
6. Baughman RP, Loudon RG (1985) Lung sound analysis for continuous evaluation of airflow 15
obstruction in asthma. Chest 88 (3):364-368. doi:10.1378/chest.88.3.364 16
7. Piirila P (1992) Changes in crackle characteristics during the clinical course of pneumonia. 17
Chest 102 (1):176-183. doi:10.1378/chest.102.1.176 18
8. Kiyokawa H, Pasterkamp H (2002) Volume-dependent variations of regional lung sound, 19
amplitude, and phase. Journal of applied physiology (Bethesda, Md : 1985) 93 (3):1030-1038. 20
doi:10.1152/japplphysiol.00110.2002 21
9. Laird CW, Homburger F, Ishikawa S (1974) Letter: Breath-sound changes after cigarette 22
smoking. Lancet 1 (7861):808. doi:10.1016/S0140-6736(74)92876-1 23
10. Gavriely N, Nissan M, Cugell DW et al. (1994) Respiratory health screening using pulmonary 24
function tests and lung sound analysis. The European respiratory journal 7 (1):35-42. 25
doi:10.1183/09031936.94.07010035 26
11. Gavriely N, Nissan M, Rubin AH et al. (1995) Spectral characteristics of chest wall breath 27
sounds in normal subjects. Thorax 50 (12):1292-1300. doi:10.1136/thx.50.12.1292 28
12. Gross V, Dittmar A, Penzel T et al. (2000) The relationship between normal lung sounds, age, 29
and gender. American journal of respiratory and critical care medicine 162 (3 Pt 1):905-909. 30
doi:10.1164/ajrccm.162.3.9905104 31
13. Bohadana A, Teculescu D, Martinet Y (2004) Mechanisms of chronic airway obstruction in 32
smokers. Respir Med 98 (2):139-151. doi:Mechanisms of chronic airway obstruction in smokers 33
14. Doherty DE, Belfer MH, Brunton SA et al. (2006) Chronic Obstructive Pulmonary Disease: 34
Consensus Recommendations for Early Diagnosis and Treatment. Journal of Family Practice:S1 35
15. Miller MR (2005) Standardisation of spirometry. European Respiratory Journal 26 (2):319-36
338. doi:10.1183/09031936.05.00034805 37
16. Sen I, Kahya YP (2005) A multi-channel device for respiratory sound data acquisition and 38
transient detection. Conference proceedings : Annual International Conference of the IEEE 39
Engineering in Medicine and Biology Society IEEE Engineering in Medicine and Biology Society 40
Annual Conference 6:6658-6661. doi:10.1109/iembs.2005.1616029 41
17. Kraman SS, Wodicka GR, Oh Y et al. (1995) Measurement of respiratory acoustic signals. 42
Effect of microphone air cavity width, shape, and venting. Chest 108 (4):1004-1008 43
18. Rossi M, Sovijarvi ARA, Piirila P et al. (2000) Environmental and subject conditions and 44
breathing manoeuvres for respiratory sound recordings. European Respiratory Review 10 45
(77):611-615 46
19. Vyshedskiy A, Murphy R (2012) Crackle Pitch Rises Progressively during Inspiration in 47
Pneumonia, CHF, and IPF Patients. Pulmonary medicine 2012:240160. 48
doi:10.1155/2012/240160 49
17 20. Pinho C, Oliveira A, Jácome C et al. (2015) Automatic Crackle Detection Algorithm Based on 1
Fractal Dimension and Box Filtering. Procedia Computer Science 64:705-712. 2
doi:http://dx.doi.org/10.1016/j.procs.2015.08.592
3
21. Taplidou SA, Hadjileontiadis LJ (2007) Wheeze detection based on time-frequency analysis 4
of breath sounds. Computers in Biology and Medicine 37 (8):1073-1083. 5
doi:10.1016/j.compbiomed.2006.09.007 6
22. Jacome C, Oliveira A, Marques A (2015) Computerized respiratory sounds: a comparison 7
between patients with stable and exacerbated COPD. The clinical respiratory journal. 8
doi:10.1111/crj.12392 9
23. Kompis M, Pasterkamp H, Oh Y et al. Distribution of inspiratory and expiratory respiratory 10
sound intensity on the surface of the human thorax. In: Engineering in Medicine and Biology 11
Society, 1997. Proceedings of the 19th Annual International Conference of the IEEE, 1997 1997. 12
pp 2047-2050 vol.2045. doi:10.1109/IEMBS.1997.758750 13
24. Cohen J (1988) Statistical Power Analysis for the Behavioral Sciences. 2nd edn. Lawrence 14
Earlbaum Associates, Hellsdale, New Jersey 15
25. Fritz CO, Morris PE, Richler JJ (2012) Effect size estimates: current use, calculations, and 16
interpretation. Journal of experimental psychology General 141 (1):2-18. doi:10.1037/a0024338 17
26. Jones A, Jones RD, Kwong K et al. (1999) Effect of positioning on recorded lung sound 18
intensities in subjects without pulmonary dysfunction. Physical therapy 79 (7):682-690 19
27. Malmberg LP, Sovijarvi AR, Paajanen E et al. (1994) Changes in frequency spectra of breath 20
sounds during histamine challenge test in adult asthmatics and healthy control subjects. Chest 21
105 (1):122-131. doi:10.1378/chest.105.1.122 22
28. Malmberg LP, Pesu L, Sovijarvi AR (1995) Significant differences in flow standardised breath 23
sound spectra in patients with chronic obstructive pulmonary disease, stable asthma, and 24
healthy lungs. Thorax 50 (12):1285-1291. doi:10.1136/thx.50.12.1285 25
29. Vanuccini L, Earis J, Helisto P et al. (2000) Capturing and pre-processing of respiratory sounds. 26
Eur Respir Rev 10 (77):616-620. 27
30. Pasterkamp H, Kraman SS, Wodicka GR (1997) Respiratory sounds. Advances beyond the 28
stethoscope. American journal of respiratory and critical care medicine 156 (3 Pt 1):974-987. 29
doi:10.1164/ajrccm.156.3.9701115 30
31. Leblanc P, Macklem PT, Ross WR (1970) Breath sounds and distribution of pulmonary 31
ventilation. Am Rev Respir Dis 102 (1):10-16 32
32. Vyshedskiy A, Ishikawa S, Murphy RL, Jr. (2011) Crackle pitch and rate do not vary 33
significantly during a single automated-auscultation session in patients with pneumonia, 34
congestive heart failure, or interstitial pulmonary fibrosis. Respiratory care 56 (6):806-817. 35
doi:10.4187/respcare.00999 36
33. Jacome C, Marques A (2014) Pulmonary rehabilitation for mild COPD: a systematic review. 37
Respiratory care 59 (4):588-594. doi:10.4187/respcare.02742 38
34. Rennard SI, Drummond MB (2015) Early chronic obstructive pulmonary disease: definition, 39
assessment, and prevention. Lancet 385 (9979):1778-1788. doi:10.1016/s0140-6736(15)60647-40
x 41
35. Alzahrani M (2011) Quantifying crackles in the lung of smoking and non-smoking young 42
adults., University of Southampton, 43
36. Vannuccini L, Rossi M, Pasquali G (1998) A new method to detect crackles in respiratory 44
sounds. Technology and health care : official journal of the European Society for Engineering and 45
Medicine 6 (1):75-79 46
37. Strulovici-Barel Y, Omberg L, O'Mahony M et al. (2010) Threshold of biologic responses of 47
the small airway epithelium to low levels of tobacco smoke. American journal of respiratory and 48
critical care medicine 182 (12):1524-1532. doi:10.1164/rccm.201002-0294OC 49
38. Bohadana A, Izbicki G, Kraman SS (2014) Fundamentals of lung auscultation. The New 50
England journal of medicine 370 (8):744-751. doi:10.1056/NEJMra1302901 51
18 39. Stendardi L, Binazzi B, Scano G (2007) Exercise dyspnea in patients with COPD. International 1
Journal of Chronic Obstructive Pulmonary Disease 2 (4):429-439 2
40. Pasterkamp H, Patel S, Wodicka GR (1997) Asymmetry of respiratory sounds and thoracic 3
transmission. Medical & biological engineering & computing 35 (2):103-106. 4
doi:10.1007/BF02534138 5
41. Kraman S (1983) Lung sounds: Relative sites of origin and comparative amplitudes in normal 6
subjects. Lung 161 (1):57-64. doi:10.1007/BF02713842 7
42. Kanezaki M, Ebihara S, Nikkuni E et al. (2010) Perception of urge-to-cough and dyspnea in 8
healthy smokers with decreased cough reflex sensitivity. Cough (London, England) 6:1-1. 9
doi:10.1186/1745-9974-6-1 10
19 Figures captions
1
2
Fig. 1 – Differences in normal computerised respiratory sounds at anterior, lateral and posterior 3
lung between smokers and non-smokers at 100-2000Hz bandwidth. a) Inspiratory Fmax; b) 4
Expiratory Fmax; c) Inspiratory Imax; d) Expiratory Imax; e) inspiratory Imean; f) expiratory 5
Imean. Data are presented as mean and standard deviation. Significant differences are identified 6
with * (p<0.05). Fmax - frequency at maximum intensity; Imax – maximum intensity; Imean – 7
mean intensity. 8
9
20 1
Fig. 2 – Average spectrum of the respiratory sounds recorded form all participants at anterior 2
(a, b), lateral (c, d) and posterior (e, f) chest during inspiration (a, c, e) and expiration (b, d, f). 3
21 1
Fig. 3 – Differences in the number of crackles at anterior, lateral and posterior lung between 2
smokers and non-smokers. a) Mean number of inspiratory crackles; b) Mean number of 3
expiratory crackles. Data are presented as median and interquartile range. Significant 4
differences are identified with * (p<0.05). 5
6
22 1
Fig. 4 – Time amplitude plot of a respiratory sound presenting an expiratory crackle, recorded 2
at posterior chest from smoker. 3
4
23 1
Fig. 5 – Spectrogram of respiratory sounds recorded at anterior chest from (a) a smoker 2
participant presenting expiratory wheezes and (b) a non-smoker participant. 3
24 Table captions
1
Table 1 - Socio-demographic, anthropometric and clinical characteristics of the participants 2 (n=44). 3 Characteristics Smokers (n=18) Non-smokers (n=26) p Age (years) 26.2 (7) 25.9 (3.7) 0.40 Gender (male), n(%) 11(61%) 18(69%) 0.75 Pack‐years, M[IQR] 2.2 [0.9-5.5] - - mMRC, M[IQR] 0.5 [0-1] 0 [0] 0.002* BMI (kg/m2) 23.5 (3.3) 22.3 (2.3) 0.29 FEV1 (% predicted) 104.7 (9) 96.8 (20.2) 0.11 FVC (% predicted) 102.5 (9.3) 100.1 (10.2) 0.53 FEV1/FVC (% predicted) 105.1 (7.4) 103.5 (7.2) 0.62
Values are shown as mean (standard deviation) unless otherwise indicated. 4
mMRC, modified British Medical Research Council questionnaire; M, median; IQR, interquartile range; BMI, body mass index; FEV1, 5
forced expiratory volume in one second; FVC, forced vital capacity; * statistical significance forp<0.05 6