ONION DRYING: KINETIC STUDY AND CHEMICAL
CHARACTERIZATION
Luciano, C. S. G.; Guiné, R. P. F.*; Barroca, M. J.
Department of Food Engineering, ESAV, Polytechnic Institute of Viseu Quinta da Alagoa, Estrada de Nelas, Ranhados, 3500-606 Viseu, Portugal. Telef: +351232480600, Fax: +232426536 e-mail: [email protected]
Keywords: onion, drying, chemical composition, kinetic model
Abstract: The present work aimed the experimental study of the drying kinetics of onions at constant
temperature (40ºC, 60ºC and 70 ºC) to obtain the drying curves, which were then fitted to different kinetic models of moisture ratio from literature. The experimental data for the moisture ratio content with time was fitted using the software Sigma Plot, v8.0 (SPSS, Inc.).
The study was complemented with the chemical characterization of the onions in fresh and after drying at the lowest and highest temperatures, for evaluation of the effect of drying and drying temperature on the chemical composition of the product. In this way, the analyses made were: moisture content, sugar content, proteins, ash, fibre, acidity and vitamin C.
The results obtained for the nutritive values of dried onion showed that the total sugars, vitamin C and acidity were lost during the drying process and their reduction was increased when temperature raised from 40ºC to 70ºC. Moreover, to obtain a similar safe moisture content the drying time was reduced about 70% when the temperature was increased from 40ºC to 70ºC.
1. INTRODUCTION
Onion in the general sense can be used for any plant in the genus Allium but used without qualifiers usually means Allium cepa, also called the garden onion. Onions (usually but not exclusively the bulbs) are edible with a distinctive strong flavour and pungent odour which is mellowed and sweetened by cooking. They generally have a papery outer skin over a fleshy, layered inner core. Used worldwide for culinary purposes, they come in a wide variety of forms and colours. Despite the variation of nutritive values in some onions varieties described in literature[1,2,3], these values clearly demonstrate a considerable amount of moisture as well as fairly large amounts of carbohydrates and small amounts of protein and fat. In addition, the onion appear to be at least somewhat effective against colds, heart disease, diabetes, osteoporosis, and other diseases and contain anti-inflammatory, anticholesterol, anticancer, and antioxidant components such as quercetin[4,5].
Onions are available in fresh, frozen, canned, and dehydrated forms. Onions can be used usually chopped or sliced, in almost every type of food, including cooked foods and fresh salads, and as a spicy garnish; they are rarely eaten on their own, but usually act as accompaniment to the main course. In the commercial-scale manufacture of soups, sauces, packet food and many other convenience foods, dehydrated onion is generally preferred to its fresh counterpart, since it has better storage properties and is easy to use[6]. Furthermore, the preservation of vegetables, such as onion, in the dried form is commonly practised to reduce the bulk handling, to facilitate transportation and to allow its use during the off-season.
Drying of food materials is a complex process involving simultaneous coupled heat and mass transfer phenomena occurring in the material being dried. These coupled phenomena make the analysis of the drying process a complex problem, and the theoretical models available for heat and mass transfer can not describe the process with accuracy. Moreover, the exact application of these principles to a food product becomes difficult due to its complex structure
and to the physical and chemical changes that occur during drying. Drying models (either empirical or mechanistic) describe the mechanism of heat and mass transport and correlate the influence that certain process variables exert on the moisture removal process. The representation of the material moisture content as a function of time under constant drying conditions constitutes the so-called drying curve.
2. MATERIALS AND METHODS
The commercial onions used in this study had, in the fresh state, a moisture content of 88.7%. The fresh and dried onion samples were analysed in respect of moisture content, acidity, sugars, proteins, ash, crude fiber and vitamin C. The onions for the experiments were handpeeled and washed and to obtain the dried samples the onion was sliced into 2.0-3.0 mm thick slices, and dehydrated in a ventiated chamber at constant temperature. The chemical analysis of both fresh and dried pulp onion was done, in triplicate, with milled samples.
Moisture content of fresh onions was determined by vacuum oven method[7] and to dried samples was used a Halogen Moisture Analyzer (Mettler Toledo HG53). Acidity and vitamin C was estimated by a volumetric titration. Total sugars were measured in ºBrix trough a refractometer apparatus. Protein content was estimated by the micro-Kjeldhal digestion procedure according to previous established methodologiesand crude fibers by sequential hot digestion of the sample with dilute acid and alkaline solutions[7].
3. RESULTS AND DISCUSION 3.1 Chemical characterization
The drying process was carried out at constant temperatures of 40ºC, 60ºC and 70ºC until the onion samples reached a safe moisture content below 5%. Moreover, to analyse the effect of this operational condition on the nutritive value of the dried product, the samples obtained by drying with the lowest and highest temperatures were characterized in chemical terms.
The moisture content of the fresh onion was around 88.7% and, after drying at 40ºC and 70ºC was 3.3% and 3.1% respectively. The results of the nutritive value of both fresh and dried onion samples are presented in Table 1, and the values are expressed in a dry weight basis. The chemical composition revealed that fresh onion is rich in water and carbohydrates and has small amounts of protein. The variation of nutritive values of this onion as compared with other results described in literature can be attributed to different varieties[1,2,3].
Table 1 - Chemical composition of the fresh and dried onion at 40 ºC and 70 ºC
(expressed as a percentage of the dry mass)
Fresh Dried at 40ºC Dried at 70ºC
Protein 0.4 0.1 0.08 Crude fibre 5.3 6.1 4.8 Ash 3.4 5.3 5.1 Total sugar 55.4 40.3 33.4 Vitamin C 1.6 0.14 0.09 Acidity* 37,6 20.8 15.9 * ml/100g dry mass
As it can be seen, the drying process has no significant effect on the nutritive value of onion, except on total sugars, vitamin C and acidity. In fact, their values were reduced with temperature since the reaction of sugars, vitamin C and the evaporation of volatile compounds are dependent of this operating condition. Thus, increasing the temperature from 40ºC to 70ºC increases the loss of sugars, acidity and specially vitamin C.
3.2 Kinetic model
The batch drying curves obtained for the temperatures of 40ºC, 60ºC and 70ºC revealed a similar kinetic behaviour, but with a decreasing stabilization time: around 13.3, 8.0, and 4.0 hours, respectively, to reach a final moisture contents of 4.3%, 4.7% and 2.5%.
The moisture ratio (MR=(W-We)/(W0-We)) in dry basis versus time (t) for the three
temperatures studied was fitted to four models (Table 2) well documented in the literature[4,8], namely the Henderson and Pabis, Logaritmic, Newton and Modified Page approaches, using the software Sigma Plot, v8.0 (SPSS, Inc.). The equilibrium moisture content was determined from the drying curve, taken for a higher time, assuming no more moisture was exchanged from the samples to the surrounding atmosphere of the chamber.
Table 2 – Kinetic models applied to the moisture ratio values.
Model Equation Parameter
Henderson and Pabis MR = a exp(-kt) a, k Logarithmic MR = c + a exp(-kt) c, a, k
Newton MR = exp(-kt) k
Modified Page MR = exp (-(kt)n) k, n
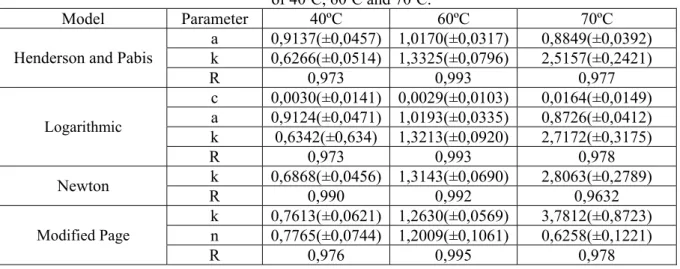
To compare the performance of the four models the respective correlation coefficient (R) as well as the standard deviation of each parameter of the corresponding model were determined. As shown in Table 3, the values obtained for the correlation coefficient with the different fittings of the models to the three temperatures present a variability between 0.967 and 0.995. This coefficient was one primary criterion for selecting the best equation to describe the convective drying curves of onion samples.
Table 3 – Results of the fitting to the different kinetic models, to temperatures
of 40ºC, 60ºC and 70ºC.
Model Parameter 40ºC 60ºC 70ºC
a 0,9137(±0,0457) 1,0170(±0,0317) 0,8849(±0,0392) k 0,6266(±0,0514) 1,3325(±0,0796) 2,5157(±0,2421) Henderson and Pabis
R 0,973 0,993 0,977 c 0,0030(±0,0141) 0,0029(±0,0103) 0,0164(±0,0149) a 0,9124(±0,0471) 1,0193(±0,0335) 0,8726(±0,0412) k 0,6342(±0,634) 1,3213(±0,0920) 2,7172(±0,3175) Logarithmic R 0,973 0,993 0,978 k 0,6868(±0,0456) 1,3143(±0,0690) 2,8063(±0,2789) Newton R 0,990 0,992 0,9632 k 0,7613(±0,0621) 1,2630(±0,0569) 3,7812(±0,8723) n 0,7765(±0,0744) 1,2009(±0,1061) 0,6258(±0,1221) Modified Page R 0,976 0,995 0,978
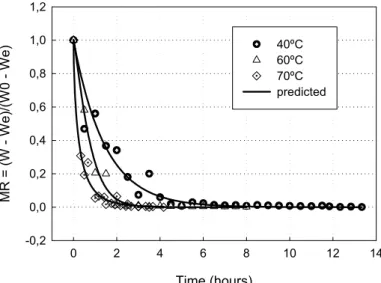
Afterwards, by analyzing the standard variation of the equations parameters and the capacity to describe the experimental results to each temperature we can conclude that Newton and Modified Page are the best to represent the onion drying curves at 40ºC, 60ºC and 70ºC. Figure 1 ilustrates the experimental moisture ratio for the different temperatures and the predictions obtained using the best model to each drying temperature. As it can be seen the models have a good performance to reproduce the experimental data throughout the entire range of values. Time (hours) 0 2 4 6 8 10 12 14 MR = (W W e )/( W 0 - W e ) -0,2 0,0 0,2 0,4 0,6 0,8 1,0 1,2 40ºC 60ºC 70ºC predicted
Figure 1 - Profile of experimental and predicted moisture ratio curves at different temperatures.
As shown in the figure, the kinetic behavour is similar for all temperatures, but it is clear that increasing the temperature acelerates tehd rying process considerably. The drying time, to reach a safe moisture, decreased of 13.3 to 4.0 hours when temperature was increased of 40ºC to 70ºC. It is still clear that the higher percentage of weight loss occurs during the first drying stage, when the slope of the curves is higher.
References
[1] - Abhayawick, L.; Laguerre, J. C.; Tauzin, V.; Duquenoy, A. Physical properties of three onion varieties as affected by the moisture content, Journal of Food Engineering, 55: 253-262 (2002). [2] - Rapusas, R. S.; Driscoll, R. H. Thermophysical properties of fresh and dried white onion slices,
Journal of Food Engineering, 24: 149-164 (1995).
[3] - Mota, C. I. L. Caracterização e estudo da desidratação da cebola, Trabalho Final de Curso, pp. 71 (2002).
[4] - Van Boekel, M. A. J. S.; Jongen, W. M. F. Product quality and food processing: how to quantify the healthiness of a product, Cancer Letters, 114: 65-69 (1997).
[5] - Ewald, C.; Fjelkner-Modig, S.; Johansson, K.; Sjoholm, I.; Akessson, B. Effect of processing on major flavonoids in processed onion, green beans and pears, Food Chemistry, 64: 231-235 (1999).
[6] - Rapusas, R. S.; Driscoll, R. H.; Srzednicki, G., S. Bulk density and resistance to sliced onions, Journal of Food Engineering, 26: 67-80 (1995).
[7] - Association of Official Analytical Chemists (AOAC). Official Methods of Analysis, 15th Ed., Arlington (1990).
[8] - Yaldýz, O.; Ertekýn, C. Thin layer solar drying of some vegetables, Drying Technology, 19: 583-597 (2001).