Service Quality – A Competing Value in the Health and Wellness Industry
Joana A. Quintela, University of Aveiro, Portugal
Anabela G. Correia, Polytechnic Institute of Setúbal & University of Aveiro, Portugal Joaquim G. Antunes Polytechnic Institute of Viseu, Portugal
Abstract
This study examined the impact of service quality on clients’ satisfaction. The empiric data were collected through surveys administrated to the users of five Portuguese thermal units and a hotel Spa. The investigation was based on SERVQUAL scale presented by Parasuraman, Zeithaml and Berry (1985). Necessarily, this model was adapted to the nature and characteristics of health and wellness industry. The dimensions of the service quality scale were reduced to the more significant ones for the studied units (attendance, assurance and tangibles). The results showed that are the aspects related to assurance and attendance that give more satisfaction to the users, that service quality is an antecedent of clients’ satisfaction and it has an impact on users’ loyalty.
Introduction
Health and Wellness Tourism is considered by PENT (2006-2015)1 as one of the most important markets for the future development of tourism in Portugal. So, through this study we intend to contribute to the development of the Health and Wellness touristic organizations, as well as to increase their service quality.
Service quality and satisfaction as been critical concepts in the field of tourism and leisure, as well as in the marketing because of the fact they can be used as productivity indicators, constituting a guarantee to achieve the organizational objectives with success. Service quality and satisfaction are seen as essential aspects, with a growing importance to the touristic companies in the sense they valorize their services and they can compete effectively in the market. The potential consequences to the companies to in achieving high levels of consumer satisfaction regarding with service quality are well studied and documented (Parasuraman, Zeithaml and Berry, 1996).
Relation between satisfaction and service quality
These concepts were always related, because they present strong similarities at the conceptual level (Cronin & Taylor, 1992; Spreng & Mackenzie, 1996).These concepts are so many times related that Liljander (1994) defends that they are synonymous, in the way that both refers to “an evaluation process in which the client compares the service experience with some previous expectations.” Besides that, both concepts have in common the fact of considering as a central aspect the point of view of the consumers in the moment they evaluate the services offered by a specific company.González et al (2004:5) also contributes to this perspective,
verifying the existence of a great similitude between them, mainly when defines quality service as “the satisfaction of clients’ expectations.”
On the specific case of health and wellness tourism, and recognizing the increase of the number of people interested in having leisure times with quality, becomes evident and necessary that the supply should give special attention to this question, as an answer to the needs and wishes of consumers, as well as the fulfillment of their satisfaction levels. Nowadays and according to Antunes (2008), service quality represents a competing value in this industry. In this sense, this study focuses on identifying the relation Health and Wellness Tourism and its relation with clients’ satisfaction and its’ impact on consumers’ loyalty. Otherwise, these objectives lead to a final goal that consists in giving to those units a deeper knowledge of the market, so that they may define a proper supply to the needs, wishes and attitudes of their market targets, looking for a better use of their potentialities. This perspective is seen as a determinant factor in what concerns to the competitiveness which allows the regional development of the inner regions of Portugal, where this kind of touristic offer can mainly be found.
Methodology
According to the established objectives, a quantitative analysis was made to attempt to analyze the satisfaction. The empiric research consisted in the interpretation of surveys, administrated to the users of five thermal units and a hotel with Spa facilities situated in Viseu – a Portuguese central region, well-known by its thermal and touristic potential. The survey was constituted by four groups and it was administrated to 400 users of those units. It had a rate of answer of 64,5%, making a total of 258 valid surveys.
The SERVQUAL scale
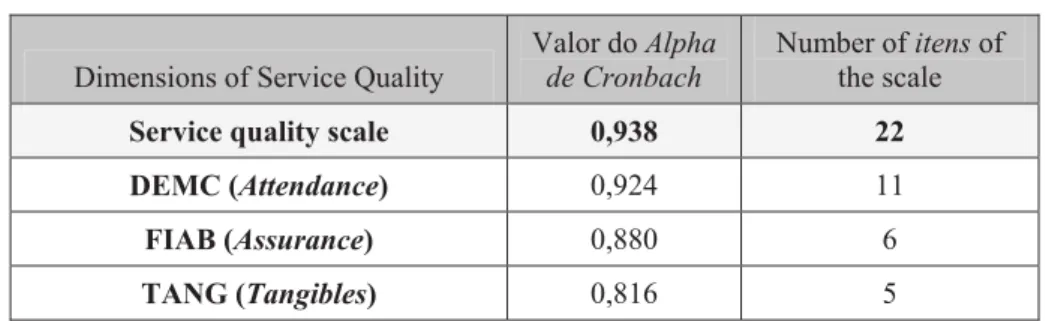
To analyze the service quality perceived by users we used the SERVQUAL scale presented by Parasuraman, Zeithaml & Berry (1985). Originally, this scale was created to measure the service quality in lodging and it’s composed by five dimensions, with a total of 22 items. Necessarily, the 22 items that composes the service quality scale were adapted according to the nature and characteristics of Health and Wellness Tourism, where each one was evaluated by the users in a Likert scale of five points. To assure the fidelity of the scale of measurement we calculated the Cronbach’s Alpha and we obtained a high level of fidelity for the service quality scale, as well as for each one of the three dimensions of service quality (Table 1).
Table 1 – Cronbach’s Alpha of the service quality scale
Dimensions of Service Quality
Valor do Alpha de Cronbach
Number of itens of the scale
Service quality scale 0,938 22
DEMC (Attendance) 0,924 11
FIAB (Assurance) 0,880 6
The dimensions of the scale of service quality were reduced by factorial analysisto the more significant ones for the clients of the studied units (Table 2).
Table 2 – Factorial analysis of principal components
Factors Eigenvalue % Acumulated Variance
DEMC (Attendance) 6,319 28,722
FIAB (Assurance) 3,912 46,501
TANG (Tangibles) 3,431 62,096
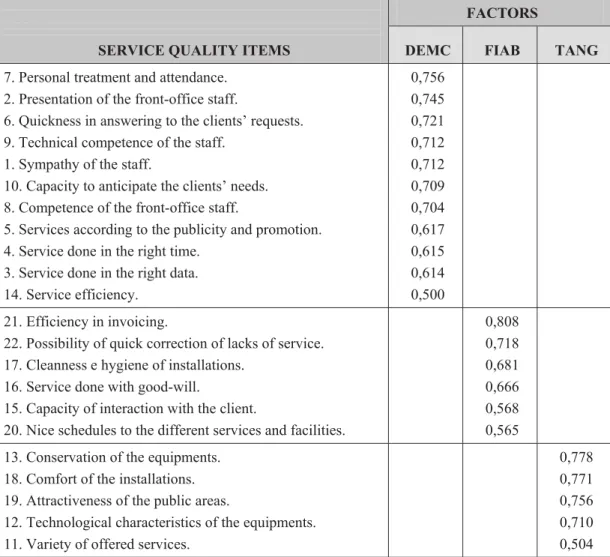
To identify the items that compose the main dimensions or factors of service quality in Health and Wellness units we used the factorial analysis with a principal component of Varimax rotation (Table 3).
Table 3 – Matrix of components after Varimax rotation
FACTORS
SERVICE QUALITY ITEMS DEMC FIAB TANG
7. Personal treatment and attendance. 2. Presentation of the front-office staff.
6. Quickness in answering to the clients’ requests. 9. Technical competence of the staff.
1. Sympathy of the staff.
10. Capacity to anticipate the clients’ needs. 8. Competence of the front-office staff.
5. Services according to the publicity and promotion. 4. Service done in the right time.
3. Service done in the right data. 14. Service efficiency. 0,756 0,745 0,721 0,712 0,712 0,709 0,704 0,617 0,615 0,614 0,500 21. Efficiency in invoicing.
22. Possibility of quick correction of lacks of service. 17. Cleanness e hygiene of installations.
16. Service done with good-will.
15. Capacity of interaction with the client.
20. Nice schedules to the different services and facilities.
0,808 0,718 0,681 0,666 0,568 0,565 13. Conservation of the equipments.
18. Comfort of the installations. 19. Attractiveness of the public areas.
12. Technological characteristics of the equipments. 11. Variety of offered services.
0,778 0,771 0,756 0,710 0,504
Results Analysis
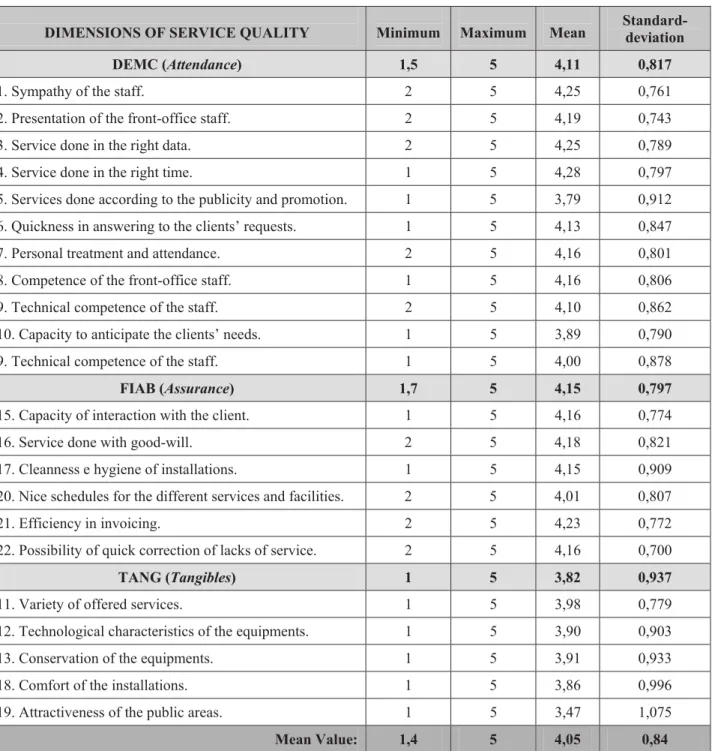
To analyze the satisfaction of users about the service quality perceived, we followed the study of Sarmento (2003), determining the mean, the standard deviation, the minimum and the maximum of the three dimensions of service quality found after the factorial analysis (Table 4).
Table 4 – Relation betweenservice quality dimensions and users’ satisfaction
DIMENSIONS OF SERVICE QUALITY Minimum Maximum Mean Standard-deviation
DEMC (Attendance) 1,5 5 4,11 0,817
1. Sympathy of the staff. 2 5 4,25 0,761
2. Presentation of the front-office staff. 2 5 4,19 0,743
3. Service done in the right data. 2 5 4,25 0,789
4. Service done in the right time. 1 5 4,28 0,797
5. Services done according to the publicity and promotion. 1 5 3,79 0,912
6. Quickness in answering to the clients’ requests. 1 5 4,13 0,847
7. Personal treatment and attendance. 2 5 4,16 0,801
8. Competence of the front-office staff. 1 5 4,16 0,806
9. Technical competence of the staff. 2 5 4,10 0,862
10. Capacity to anticipate the clients’ needs. 1 5 3,89 0,790
9. Technical competence of the staff. 1 5 4,00 0,878
FIAB (Assurance) 1,7 5 4,15 0,797
15. Capacity of interaction with the client. 1 5 4,16 0,774
16. Service done with good-will. 2 5 4,18 0,821
17. Cleanness e hygiene of installations. 1 5 4,15 0,909
20. Nice schedules for the different services and facilities. 2 5 4,01 0,807
21. Efficiency in invoicing. 2 5 4,23 0,772
22. Possibility of quick correction of lacks of service. 2 5 4,16 0,700
TANG (Tangibles) 1 5 3,82 0,937
11. Variety of offered services. 1 5 3,98 0,779
12. Technological characteristics of the equipments. 1 5 3,90 0,903
13. Conservation of the equipments. 1 5 3,91 0,933
18. Comfort of the installations. 1 5 3,86 0,996
19. Attractiveness of the public areas. 1 5 3,47 1,075
Based in the study of Sarmento (2003), we calculated a new variable, that’s the mean (4,05) of the cases or units that compose the several dimensions that regulates satisfaction. In this study satisfaction was measured by a scale of five points.
Observing the results of the Graphic 1, we can conclude that satisfaction level of the users of the studied health and wellness units in what concerns to service quality perceived origins an intermediate to a high level of satisfaction (Xm=4,05 and standard-deviation=1,06).
Besides that, analyzing the dimensions of quality of service, we verified that Assurance – FIAB (4,15) and Attendance – DEMC (4,12) are the ones that give more satisfaction to the users of the studied units. On the other hand, the service quality dimension Tangibles – TANG (3,82) is the one that gives less satisfaction to the users.
Graphic 1– Mean of clients’ satisfaction with service quality in health and wellness units.
b). The relation between service quality and satisfaction
According to the literature (e.g. Bitner, 1990; Bolton & Drew, 1991; Oliver, 1981), satisfaction leads to service quality. Although, some studies in marketing demonstrates that service quality, in reality, contributes to satisfaction (Caruana & Leyland, 1997). For that reason, mostly of the authors suggest that service quality and satisfaction are different constructs that establish a permanent relation (Bitner, 1990; Bolton & Drew, 1991; Oliver, 1980; Carman, 1990; Taylor & Baker, 1994; Spreng & Mackoy, 1996).
In this study, through linear regression we can confirm, through the significant values obtained, that service quality comes before satisfaction (sig<0,05).
c). The impact of satisfaction on customers’ loyalty
According to Chen & Gursoy (2001) in consumer research, loyalty is measured by different indicators, including the intention of keeping buying the same product or service and the will to recommend the product or service to others. In this relation, some authors defend that service quality and satisfaction have independent effects in the future behaviour of users (Cronin & Taylor, 1992). Although, Bloemeret al. (1998) in their analysis of the structural
relation between loyalty, product’s image, service quality and satisfaction, concluded that exists an indirect relation between loyalty and service quality that leads to satisfaction.
To analyze the impact of service quality in the users’ intentions of returning and recommending, we used the linear regression, considering the service quality perceived as the independent variable, evaluated through the 3 factors DEMC, FIAB and TANG and as dependent variable the intention of return and of recommend. The results show that service quality explains through the Adjusted R Square 2,7% of the users’ intention of recommend the service to others and influences only 0,60% the users will in return to that unit (Table 5).
Table 5 – Linear regression
Model R R Square Adjusted R Square Std. Error of the Estimate Intention of recommend 1 ,194(a) ,038 ,027 ,483
Intention of return 1 ,132(a) ,017 ,006 ,493
a Predictors: (Constant), TANG, DEMC, FIAB
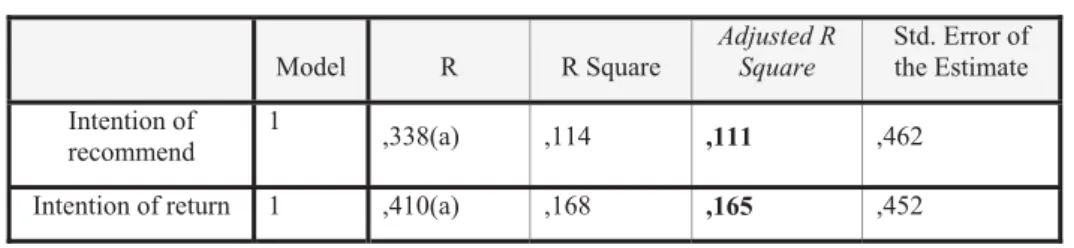
To analyze the impact of satisfaction in the users’ intentions of returning and recommending, we also used the linear regression, considering satisfaction level as the independent variableand as dependent variable the intention of return and of recommend. The results show that satisfaction explains through the Adjusted R Square 11,1% of the users’ intention of recommend the service to others and influences 16,5% the users will in returning to use the services again (Table 6).
Table 6 – Linear regression
Model R R Square Adjusted R Square Std. Error of the Estimate Intention of recommend 1 ,338(a) ,114 ,111 ,462
Intention of return 1 ,410(a) ,168 ,165 ,452 a Predictors: SATISFACTION LEVEL
Finally, the results of the study confirm the influence that satisfaction has on the fidelity of the users and in its buying intentions. Besides that, this study confirms that the influence of satisfaction in the purchase intention is greater than service quality (Baker & Crompton, 2000). Although, service quality represents a global and long term relation with the company, through multiple service experiences, and satisfaction is associated to a transitory judgment that can be changed in any new transaction (e.g. Cronin & Taylor, 1992; Bitner, 1990; Bolton & Drew, 1990; Carman, 1990).
Conclusions
In a practical perspective, the results of this study gives important contributions in what concerns to the evaluation of clients’ satisfaction of health and wellness units, permitting to verify if it is according with the expectations and desires of their clients.
Besides that, this kind of information can help to improve the global quality of the offered services. Once it’s difficult to answer to all the desires and necessities of the clients, we can prioritize objectives according with the aspects of the service that as a lower evaluation, obtaining the maximum benefit.
Besides some limitations, we think the conclusions about the satisfaction levels of the users of Health and Wellness Tourism in the region of Viseu, constitutes the base for a larger investigation in the near future. This kind of investigation seems to us justified because of the existence of so many Thermal units that as contributed so much for the touristic development of this Portuguese region.
In this study we can consider some limitations in what concerns to methodological options. Among it, we identified some of the questions of the survey that should follow the same type of scale in every options of answer to facilitate the analysis of the variables and the statistical treatment of the data.
On the other hand, we should refer that the items of the SERVQUAL scale can be revised in another study in the future, because this scale was adapted to the study of health and wellness and not to lodging, as originally was conceived and applied. We recognize that in what concerns to the analysis of global satisfaction, we agree that should be more convenient the measure of satisfaction thru a bigger scale that can give a big objectivity of results.
Although, service quality and satisfaction have been critical concepts in the fields of tourism and leisure, as well as in the field of marketing, as we referred before, these concepts haven’t systematically applied yet to health and wellness tourism that’s why this study has got an exploratory character. Besides that, as refers Mueller and Kaufmann (2000), are not yet defined the tools of quality management applied to Health and Wellness Tourism. Because of that and because of the fact that wellness is a complex and multidisciplinary concept, this study as an exploratory and a sectorial character, being limited to a defined and specific geographic area, that although it is very representative of the reality, it’s not possible to generalize the results.
References
Antunes, J. G. (2008). Turismo de Saúde e Bem-estar em Portugal: Estratégias para o seu Desenvolvimento, in 14.º Congresso da Associação Portuguesa para o Desenvolvimento Regional, 4 a 6 de Julho de 2008, 2103-2129.
Baker, D.A. & Crompton, J.L. (2000). Quality, satisfaction and behavioral intentions. Journal of Travel Research, Vol. 27, No. 3, July, 785-804.
Bitner, M.J. (1990). Evaluating Service Encounters: The Effects of Physical Surroundings andEmployee Responses. Journal of Marketing. 54:2 (1990), 69-82.
Bloemer, Jose & Ruyter, Ko de (1998). On the relationship between store image, store satisfaction and store loyalty. European Journal of Marketing, no. 32 (5-6), 499-513.
Bolton, R.N. & Drew, J.H. (1991). A longitudinal Analysis of the Impact of Service Changes onCustomers Attitudes. Journal of Marketing. 55:1 (1991a), 1-9.
Carman, J.M. (1990). Consumer Perceptions of Service Quality: An Assessment of the SERVQUAL Dimensions.Journal of Retailing. 66(1) (1990), 33-55.
Chen, J. S. & Gursoy, D. (2001). An Investigation of tourist’s destination loyalty and preferences. International Journal of Contemporary Hospitality Management 13/2, 79-85.
Cronin J. & Taylor, S. (1992). Measuring Service Quality: a Reexamination and Extension.Journal of Marketing. 56:3 (July), 55- 88.
González, M. Elisa Alén; Castro, Andrés Mazaira & Brea, José Antonio Fraiz (2004). Calidad de Servicio y Satisfacción – Antecedente o Consecuente? Su evaluación en el Ámbito del Turismo Termal. Vigo: Facultad de Ciencias Empresariales, 1-30.
Liljander, Veronica (1994). Modeling Perceived Service Quality Using Different Comparison Standards. Journal of Consumer Satisfaction, Dissatisfaction and Complaining Behavior, Vol. 7, 126-142.
Mueller, H. & Kaufmann, E. L. (2001). Wellness tourism: Market analysis of a special health tourism segment and implications for the hotel industry. Journal of Vacation Marketing, 7:1, 5-17.
Oliver, Richard L. (1981). Measurement and Evaluation of Satisfaction Processes in Retail Settings. Journal of Retailing, 57 (3), 25-48.
Parasuraman, A.; Zeithaml, V. & Berry, L. (1985). A conceptual model of service quality and its implications for future research. Journal of Marketing, 49, 41-50.
PENT – Plano Estratégico Nacional do Turismo – Para o Desenvolvimento do Turismo em Portugal (2006). Ministério da Economia e Inovação, Turismo de Portugal, Lisboa. Sarmento, Manuela (2003). Gestão pela Qualidade Total na Indústria do Alojamento
Turístico. Lisboa: Escolar Editora.
Spreng, Ricard A. & Mackoy, Robert D. (1996). An Empirical Examination of a Model of Perceived Service Quality and Satisfaction, Journal of Retail, 72 (2), 201-214.
Spreng, Ricard A.; Mackenzie, Scott B. & Olshavsky, Ricard W. (1996). A Re-examination of the Determinants of Consumer Satisfaction, Journal of Marketing, 60 (July 1996), 15-32.
Taylor, Steven A. & Baker, Tomas L. (1994). An Assessment of Relationship Between Service Quality and Customer Satisfaction in the Formation of Consumers’ Purchase Intentions, Journal of Retailing, 70 (2), 163-178.
Zeithaml, V. A., Berry, L. L., & Parasuraman, A. (1996). The behavioral consequences of service quality. Journal of Marketing, 60(2), 31–46.