Copyright © 2016 by Lectito BV, Netherlands ISSN: 2468-2071
*Correspondence to: [email protected]
Assessing and explaining local e-government
maturity in the Iberoamerican community
Gustavo Gouvêa Maciel
1*, Hélder Gomes
1& Gonçalo Paiva Dias
11University of Aveiro, PORTUGAL
ABSTRACT
This paper assesses local e-government maturity in the Iberoamerican community. Sixty Andorran, Argentinian, Brazilian, Chilean, Colombian, Costa Rican, Mexican, Portuguese, Spanish, and Uruguayan cities were considered in this study. A demographic criterion was adopted to define the municipalities observed within those countries and a three-dimensional model was used to evaluate each municipal website. Then, we conclude that local e-government still has a substantial room for improvement in the region and that population density is relevant to explain local e-government maturity, albeit only in its intrinsic Information and Participation dimensions.
Keywords e-government, local government, maturity, population density, Iberoamerican countries, municipalities Received: Revised: Accepted: 26 Jan 2016 14 Feb 2016 4 Mar 2016 DOI: 10.20897/lectito.201616 INTRODUCTION
Technology has been enhancing democratic governance. Indeed, e-government, i.e., “the use of (…) [such] technology to support government operations, engage citizens, and provide government services” (Cook et al., 2002, p. 3), has become a powerful way to “facilitat[e] access to massive amounts of data that can be collected, distributed, and transformed by (…) the public” (Ferreira da Cruz et al., 2015, p. 3). Central governments, national parliaments, and even supreme courts have been reorienting their institutional actions toward a more transparent modus operandi. However, most transactions between government and citizens (G2C) do not seem to take place in a national scale (Socitm & IDeA, 2002, p. 6).
E-government research is then facing a problem: local government websites remain substantially underdeveloped when compared to their national counterparts (Fan, 2011, p. 926). In other words, scholars have already perceived how important it is to provide municipal electronic solutions for citizens (Cegarra-Navarro et al., p. 469; Miranda et al., 2009, pp. 425–426; Pina et al., p. 1137), but they still know little about what really affects local e-government maturity, especially in a cross-country perspective1.
In this sense, this paper aims to (i) present a comparison of local e-government maturity among selected Andorran, Argentinian, Brazilian, Chilean, Colombian, Costa Rican, Mexican, Portuguese, Spanish, and Uruguayan municipalities, and (ii) explain what affects such maturity level in the region. A three-dimensional model was adopted (Dias & Costa, 2013) and used to introduce a promising variable: the population density in municipal areas, i.e., the number of inhabitants per square kilometer.
1 This article represents the efforts to extend and unravel with greater detail a tentative paper entitled Evaluating local e-government maturity in selected Iberoamerican countries (Maciel, Gomes, & Dias, 2015) and presented at the 10th Iberian Conference on Information Systems and Technologies (CISTI’2015), held in Águeda, Portugal between the 17th and 20th of June 2015.
92
© 2016 Lectito BVThe remaining of this paper is organized as follows. First, a detailed literature review presents how local e-government has been both studied and explained. Second, we define the methods used. Third, we present the results and discuss them in four different perspectives: (a) drawing a cross-national evaluation, (b) considering all municipalities as a single group of study, (c) analyzing the observations in population density groups, and (d) using population density to explain local e-government maturity and its intrinsic dimensions. Finally, we contextualize the limitations of the work and present our conclusions about local e-government maturity for this particular set of Iberoamerican municipalities.
LITERATURE REVIEW
Many efforts were done during the last two decades in order to measure or at least assess e-government maturity worldwide. An orthodox approach has been providing lots of useful information about major national public websites, such as executive (e.g., central governments agencies, presidential and/or prime minister’s cabinets), legislative (e.g., congresses, parliaments, and/or assemblies), and judicial offices (e.g., national supreme courts). Both the Global E-government Report, annually organized by Brown University2 and the E-Government Development Index, developed by the United Nations3, represent hallmarks in this field of study and become powerful tools to understand a significant tendency toward isomorphism4. In accordance with Podder (2013, p. 198), ‘external stakeholders exert pressure on the development and implementation of e-government and cause mimetic pressure by monitoring the progress of e-government development as a whole’. Any attempt to measure e-government also determines a pathway to mimesis, because best practices are put in evidence and make clear what should be implemented in order to enhance website provision. In sum, seeing how others deal with e-government forces the least technology-based regions to boost their own supply for G2C solutions.
Other relevant projects have tried to assess e-government in a cross-national perspective, albeit not in a local or municipal level. Kim (2007) explored the determinants of global e-government performance in 163 different countries by conducting multivariate statistical analysis. His work considered only national government websites and found that economic wealth, education, urbanization, civil liberties, government effectiveness, and the interaction between Internet usage and economic wealth determine e-government maturity. Domínguez et al. (2011) analyzed the development of e-government in the national governments of 192 countries and also found that socio-economic factors influence public website quality. Lau et al. (2008) discussed about the adoption of e-government in three Latin American countries: Argentina, Brazil, and Mexico. They evaluated 44 federal, state and local websites to observe the status of e-government development in the region. Martinuzzo (2008) analyzed the quality of the national websites in the Mercosur region and evidenced an underutilization of interactive e-government solutions.
Comparing e-government in a national scale is certainly relevant, but extremely limitative to understand the phenomenon. Different regions and municipalities within a country may present completely distinct levels of digital governance. It is therefore problematic to accept a one-size-fits-all model to both local and national levels of government (Shackleton et al., 2004, p. 8). For this reason, many specialists decided then to assess how e-government works in a microscale. Many studies have been conducted in the field to explore municipal characteristics and determinants of the e-government process. Most of them focused on analyzing locations only in a single country and a few others tried to perform cross-national municipal comparisons. Table 1 presents prominent single-country researches that somehow evaluated e-government maturity or at least any dimension of it, especially in the Iberoamerican region. Additionally, Table 1 also shows what kind of factors were considered relevant to explain e-government maturity in each study.
In sum, researchers basically discovered that G2C municipal solutions usually begin with an informational approach and then move towards complex interaction (D’Agostino et al., 2011, pp. 19–21; Dias & Costa, 2013, p. 295; Dias & Gomes, 2014, p. 4; Edmiston, 2003, p. 26; Fan, 2011, pp. 931–932; Lappas et al., 2015, p. 135). They also evidenced that both socioeconomic (Cegarra-Navarro et al., 2012; Cruz et al., 2012; Dias & Costa, 2013; Gandía & Archidona, 2008; Moon, 2002; Norris & Reddick, 2013; Torpe & Nielsen, 2004; Weare et al., 1999) and political (Cegarra-Navarro et al., 2012; Ferreira da Cruz et al., 2015; Karkin & Janssen,
2 Such project have collected e-government data for 198 nations around the world between 2001 and 2008. More
information is available at http://www.insidepolitics.org/egovtdata.html.
3 For more information about the project, visit https://publicadministration.un.org/egovkb. 4 For more information about isomorphism and its peculiarities, see DiMaggio & Powell (1983)
© 2016 Lectito BV
93
2014; Moon, 2002; Norris & Reddick, 2013; Sheffer Corrêa et al., 2014; Weare et al., 1999) factors influence local e-government development in specific countries.
Moreover, Shackleton et al. (2004, p. 8) observed that national and local maturity models of e-government need different explanations. Sheffer Corrêa et al. (2014, p. 183) noted that technological development does not influence local e-government in high population municipalities in Brazil, while Cegarra-Navarro et al. (2012) found robust evidences to consider it explicative in the Spanish context. Contrary to expectations, Salazar et al. (2010, p. 99) noticed that “Internet connections and municipal budgets in Chilean comunas, do not determine the level of development of e-services”. In Portugal, Dias & Gomes (2014, p. 4) observed an increasing gap among municipalities when local website maturity was considered. Civic engagement was then pointed as a powerful explanatory variable for Spanish local governance (Cegarra-Navarro et al., 2012, p. 476) and transparency appeared as a crucial research subject in the Portuguese context (Ferreira da Cruz et al., 2015). In the United States, e-government “adopting cities are larger, wealthier, (…) and their citizens are more likely to be members of social elites and to be registered voters” (Weare et al., 1999, p. 15). All these contributions have certainly helped scholars to better comprehend local e-government maturity and to orientate scientific research. It would be impossible to establish municipal comparisons among nations without recognizing such a robust set of single-country findings.
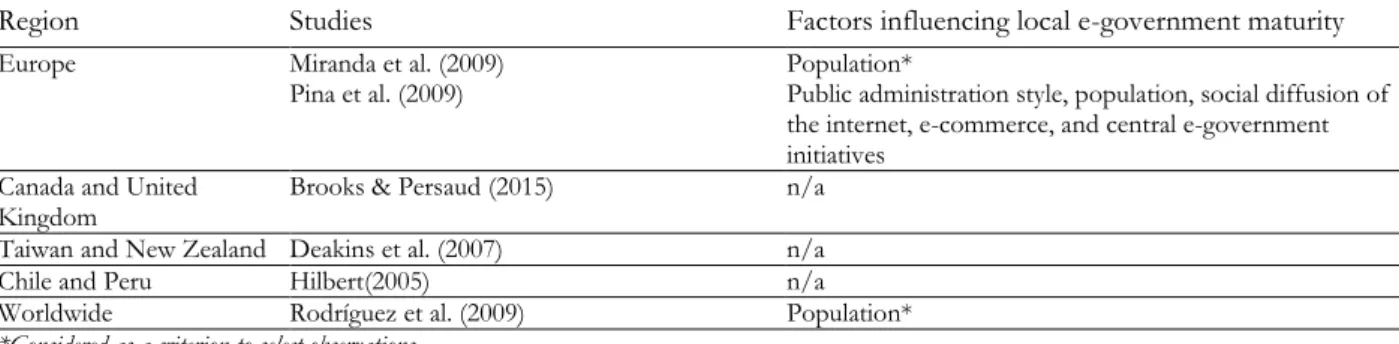
However, are these single-country findings still observable in a broader geographic scale? Cross-national municipal studies have been thus conducted recently to answer this question. Albeit less frequent, this approach tries to perceive if there are tendencies and patterns in a global or at least in a regional level. Table 2 presents a set of studies that assessed local e-government in a multiple-country perspective.
Table 1. Prominent single-country municipal website studies
Country Studies Factors influencing local e-government maturity
Australia Shackleton et al. (2004) n/a
Fan (2011) Population** and diversity**
Brazil* Cruz et al. (2012) Socioeconomic conditions and population** Sheffer Corrêa et. al (2014) Administrative autonomy and population**
Chile* Salazar et al. (2010) n/a
Denmark Torpe & Nielsen (2004) Population and income per inhabitant
Greece Lappas et al. (2015) n/a
Mexico* Sandoval-Almazan & Gil-Garcia
(2010) Population**, political relevance of the city**, and urbanization** New Zealand Cullen et al. (2003) n/a
Podder (2013) n/a
Peru Santana (2009) n/a
Portugal* dos Santos & do Amaral (2012) n/a
Dias & Costa (2013) Population, participation in e-government development projects, school dropout, location
Dias & Gomes (2014) n/a
da Cruz et al. (2015) Transparency
Saudi Arabia Al-Aama (2011) n/a
Spain* Gandía & Archidona (2008) Municipal wealth, leverage, public media, technology, education, and population
Cegarra-Navarro et al. (2012) Information communication technologies, civic engagement, and population**
Sardà et al. (2013) n/a
Turkey Karkin & Janssen (2014) Public values and population**
United States Weare et al. (1999) Population, government resources, concentration of social-economic elites, and voter registration
Musso et al. (2000) n/a
Moon (2002) Population and type of government D’Agostino et. al (2011) Population**
Norris & Reddick (2013) Population, type of government, form of government, region, metropolitan status, median household income, ethnicity, and professional degree
*Iberoamerican countries whose municipalities were assessed in this article. For more information about the proposed geographical coverage, see methods section.
94
© 2016 Lectito BVMiranda et al.5 (2009) and Pina et al.6 (2009) focused on evaluating European municipal websites. The first only showed the current status of local e-government maturity in Europe, while the second evidenced that some single-country findings were still valid in a cross-national perspective. Public administration style, population, social diffusion of the internet, e-commerce, and central e-government initiatives were presented as valid explanatory variables for municipal e-government.
Assessing Europe is certainly a great strategy in order to avoid discrepant levels of socioeconomic development among municipalities, but a risky tactic in order to control cultural heritage. In other words, Europe can be seen as a macro-region that covers heterogeneous cultures with homogeneous high levels of development if compared to other regions of the world.
A few other researchers have evaluated local e-governance beyond European boundaries. Brooks & Persaud (2015) established a descriptive comparison between eight Canadian and British municipalities, but did not test empirically explanatory variables. Hilbert (2005) performed a similar research in 106 Chilean and 77 Peruvian municipalities, albeit also without recognizing what affects municipal website maturity. Rodríguez et al. (2009) conducted a preliminary analysis of municipal website maturity worldwide7, but again without an detailed quantitative exploration of causalities.
In sum, the existing cross-national municipal studies generally present two non-concurrent basic limitations: (i) they tend to produce simple descriptive comparisons with no hypotheses testing, or (ii) they build up robust econometric models to assess local government website maturity only in countries with similar socioeconomic conditions, albeit culturally diversified.
The Iberoamerican community provides an alternative condition to evaluate local e-government maturity: it refers to a group of countries with a common Iberian heritage. In contrast to studies conducted in Europe, this approach aims to reorient the analysis to verify if municipal website quality continues to be impacted by social implications, such as the population factors; even in an environment with striking social development disparities among countries and also within municipalities in each country. “[C]ulture affects e-government development and participation” (Zhao et al., 2014, p. 1015) and, for this purpose, should be controlled. A common Iberian heritage aims to mitigate the noises caused by such cultural patterns. That is why the objective of this study is to assess maturity of local e-government in selected Iberoamerican municipalities and to find out how it is influenced by population patterns.
METHODS
The Iberoamerican countries, whose municipalities were evaluated, have been selected based on the 2014 United Nations E-government Development Index8. The top ten countries in this ranking were considered for
5 This study evaluated 84 cities with more than 300,000 inhabitants of the following European countries: Austria,
Belgium, Bulgaria, Czech Republic, Denmark, Finland, France, Germany, Greece, Hungary, Ireland, Italy, Macedonia, Netherlands, Norway, Portugal, Romania, Slovakia, Spain, Sweden and the United Kingdom.
6 This research assessed 75 local websites of 15 EU countries (the capital and the four biggest cities for each one):
United Kingdom, Ireland, Denmark, Finland, Sweden, Netherlands, Austria, Germany, Belgium, France, Greece, Italy, Luxembourg, Portugal, and Spain.
7 Three municipalities with high, moderate and low number of inhabitants from Argentina, Australia, Bolivia, Chile,
Colombia, Costa Rica, Ecuador, Spain, United States, France, Luxembourg, Mexico, Nigeria, Peru, Puerto Rico, and Venezuela were considered in this study.
8 For full access to the 2014 E-government Development Index ranking, see United Nations (2015).
Table 2. Prominent cross-country municipal website studies
Region Studies Factors influencing local e-government maturity
Europe Miranda et al. (2009) Population*
Pina et al. (2009) Public administration style, population, social diffusion of the internet, e-commerce, and central e-government initiatives
Canada and United Kingdom
Brooks & Persaud (2015) n/a Taiwan and New Zealand Deakins et al. (2007) n/a
Chile and Peru Hilbert(2005) n/a
Worldwide Rodríguez et al. (2009) Population*
© 2016 Lectito BV
95
analysis. Thus, Andorran, Argentinian9, Brazilian, Chilean, Colombian, Costa Rican, Mexican10, Portuguese, Spanish, and Uruguayan11 local governments took part in the research.
A demographic criterion was adopted to select the three most populous and the three less populous capital municipalities of the first-level administrative subdivisions of the previous countries. In this sense, we accessed 6012 official municipal websites to evaluate their respective maturity by considering only information and services publicly available. In addition, only official national statistics13 were used to determine both municipal population and geographic area.
In this paper, we decided to use a website content evaluation to characterize e-government development because of its alignment with the previous works carried out in this field, especially in Portugal (Dias & Costa, 2013; Dias & Gomes, 2014; Dias, 2011a; dos Santos & do Amaral, 2012). For this purpose, websites were classified according to a multidimensional maturity model, which is largely supported by a great number of e-government scholars (Dias & Costa, 2013; Dias & Gomes, 2014; Dias, 2011a, 2011b; Panopoulou et al., 2008; Pina et al., 2009; Torpe & Nielsen, 2004). We decided to use the methodology proposed by Dias & Costa (2013), which encompasses three complementary dimensions: online information (Information), online services (Service) and online participation (Participation). Nevertheless, some specific modifications were made to expand this methodology, originally designed to fit the Portuguese reality. Table 3 shows such three-dimensional adapted method for our Iberoamerican analysis.
This three-dimensional model represents a path to state that e-government is not linear (Coursey & Norris, 2008). Each dimension can be developed simultaneously and independently. In this sense, “results in one dimension do not necessarily depend on good results in the others” (Dias & Costa, 2013) and websites can produce completely different solutions to enhance G2C transactions that lead to the same level of website maturity.
Considering this approach, we verified if these municipalities fulfilled each dimensional requisite by simply accessing their websites. The electronic addresses of the pages were annotated whenever evidences of compliance with the characteristics in Table 3 were found.
Another essential task to construct this methodological approach is to define the calculation method used. The Municipal Website Maturity Index (MWM) presents a score range that varies from 0 (minor score) to 1 (maximum score) and considers the particularities illustrated in Table 4.
The main goal of this calculation is to give the same weight to each dimension. Therefore, this approach guarantees that there is no overvalued dimension in the composition of the MWM Final Result.
9 In alignment with the research conducted by Rodríguez et al. (2009) and due to a particular geopolitical condition, the
website of the Ciudad Autónoma de Buenos Aires was considered in order to evaluate the city of Buenos Aires as a whole.
10 Mexico City was not considered as an indivisible territory. In order to assess local e-government maturity in this
region, the delegación of Iztapalapa, which is the most populous location in Mexico City, was then selected for analysis.
11 Uruguay has a third administrative level, the municipios, financially subordinated to the second-level administrative
division called departamentos (Schiavi, 2013, p. 91). However, this political organization based on three levels is something relatively recent and applicable only to part of the national territory (see Oroño & Gil de Vargas, 2012; Schiavi, 2013). Traditionally, local government has always been associated with the departamentos in Uruguay (Goldfrank, 2011, Chapter 2; Rosales & Carmona, 2009, p. 177), and, for this reason, their websites were considered when gathering data for this research.
12 The cantón of Limón in Costa Rica did not have an official website, albeit its inexistence was considered for statistical
purposes.
13 Data on population and area for each municipality was provided by national statistical institutes and/or specialized
national bodies. For Andorra, see the references for Departamento de Estadística de Andorra (2015). For Argentina, see Instituto Nacional de Estadística y Censos de Argentina (2010). For Brazil, see Instituto Brasileiro de Geografia e Estatística (2015). For Chile, see Biblioteca del Congreso Nacional de Chile (2012). For Colombia, see Departamento Administrativo Nacional de Estadística de Colombia (2015) and Federación Colombiana de Municipios (2015). For Costa Rica, see Instituto Nacional de Estadística y Censos de Costa Rica (2011, 2014). For Mexico, see Instituto Nacional de Estadística y Geografía de Mexico (2011). For Portugal, see Instituto Nacional de Estatística de Portugal (2015). For Spain, see Instituto Nacional de Estadística de España (2015) and Instituto Geográfico Nacional de España (2015). And for Uruguay, see Instituto Nacional de Estadística de Uruguay (2013) and Pritsch (2012). Only population statistics relating to estimations and projections for the year 2014 were considered, except for Argentinian, Chilean and Mexican municipalities, where data from their last official census (2010, 2012, and 2010, respectively) was accessed, due to technical limitations.
96
© 2016 Lectito BVWe also clustered the results by population density groups in order to confront them with previous research findings in the field that “suggest a positive relationship between population [patterns] and e-government capacity at local level” (Miranda et al., 2009, p. 432; see also Moon & DeLeon, 2001; Moon, 2002; Musso et al., 2000; Weare et al., 1999). Our previous literature review also pointed in the same direction: six single-country studies (Cegarra-Navarro et al., 2012; Cruz et al., 2012; D’Agostino et al., 2011; Fan, 2011; Karkin & Janssen, 2014; Sandoval-Almazan & Gil-Garcia, 2010; Sheffer Corrêa et al., 2014; Torpe & Nielsen, 2004) used any kind of direct or indirect evaluation of population to explain local e-government maturity and other seven studies at least adopted high population criteria to select observable municipalities. Even considering a very limited body of cross-national literature available, population still appeared as relevant to assess local e-government maturity (see Miranda et al., 2009). Furthermore, Dias & Costa (2013, p. 304) took population density into account in their maturity model for the Portuguese case and found that the size of municipalities matter to explain the phenomenon. Additionally, Rodríguez et al. (2009, p. 728) used population density as a criterion to select observations for their comparative research about local e-government around the world. It also represented a valid explanation for the adoption of transparency of sustainability information in Spanish regional governments (Alcaraz-Quiles et al., 2014, p. 189) and also influenced on municipal efficiency in Spain (Benito et al., 2010, p. 526). For this purpose, Table 5 categorizes each density group and enables us to evaluate such relevant variable statistically.
Finally, an econometric model was proposed to verify if population density affects local e-government maturity in a homogeneous cultural ambiance provided by a common Iberian heritage throughout the entire set of municipalities. Table 6 shows our main hypothesis and its three other complimentary hypotheses.
It was built a model in which we assume a non-linear relation between population density and MWM Final Result, i.e., we wanted to go beyond mainstream precepts that accepts a linear implication between population factors and local e-governance. Towards accomplishing such hypotheses verification, it was then used an adapted Ordinary Least Squares (OLS) method to fit the following generic relation:
Table 3. Three-dimensional municipal website evaluation
Dimensions Evaluated content*
Information General information, Documents for public access, Text based search tools, Semantic search tools, Real-time citizen support, News services register, Presence in social networks, Compliance
with accessibility rules, Privacy policy, Multilingual function, Availability of consolidated public transparency webpage
Service Information on services, Query status of service provision, Form submission, Complete online transaction, Public online payment information, Electronic authentication
Participation Complaints and/or suggestions submission, Opinion or free discussion participation, Public discussion participation, Participatory budgets
*This is an adapted usage of the three-dimensional maturity evaluation proposed by Dias & Costa (2013). Contents in bold were part of their original formulation.
Table 4. MWM Index calculation method
Dimensions Calculus Range of variation
Information Service Participation
For each dimension:
(number of observed contents) x [(1/3) / (total number of contents available for this dimension)]
Values for each dimension vary from 0 to 0.33, where 0 represents the lowest score and 0.33, the highest.
MWM
Final Result Info.+ Serv.+ Part.
Final Result varies from 0 to 1, where 0 represents the lowest score and 1, the highest.
Table 5. Population density groups of evaluation
Dimensions Range of analysis(in people/km²)
Ultra-high density [5000,+∞[
Very high density [500,5000[
High density [50,500[
Moderate density [10, 50[
© 2016 Lectito BV
97
𝒇(𝒚) = 𝜶𝟏+ 𝜶𝟐[𝐥𝐨𝐠𝟏𝟎(𝑷𝑫)] + 𝜶𝟑[(𝐥𝐨𝐠𝟏𝟎(𝑷𝑫)]𝟐+ 𝜺
Where 𝒇(𝒚) refers to each dependent variable to be tested (MWM Final Result, Information, Service, and Participation); 𝜶𝟏, 𝜶𝟐, and 𝜶𝟑 are the respective coefficients of the equation; PD refers to population density, our explanatory variable throughout the proposed hypotheses; and 𝜺 refers to the stochastic error.
Due to a severe incompatibility among datasets, other socioeconomic independent variables, which are widely accepted as reasonable determinants for local e-government (e.g., municipal budget, education, and technology) could not be tested. Future works should try to overcome such limitation by adding new variables to the explanation. However, as proposed here, they must took population patterns into consideration, especially the population density.
Data was collected in two stages: the first one occurred between September 15th, 2014 and January 30th, 2015 and included the municipalities of the following countries: Andorra, Argentina, Brazil, Chile, Colombia, Portugal and Spain. The second occurred during February 2016 and added Costa Rican, Mexican, and Uruguayan localities to the research. Websites were accessed exclusively during the abovementioned periods and any unavailability, change, and/or upgrade after reported was not considered.
RESULTS AND DISCUSSION
This section will first evaluate the results and discuss them in a cross-national perspective. Next, it will focus on presenting all municipal results as a single group of study, regardless of their country. Then, it will assess and analyze the observations in population density groups. Finally, it will use population density to explain local e-government maturity and its intrinsic dimensions.
A cross-national evaluation of local e-government maturity
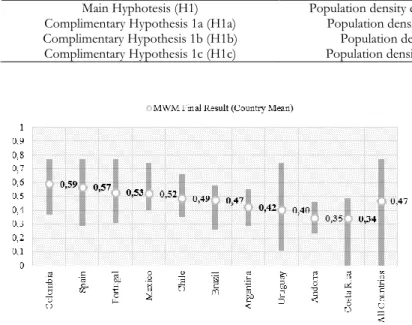
As a preliminary approach, we grouped all the MWM results by countries. Figure 1 shows a comparative evaluation of nations, with their MWM average scores and amplitudes. Colombia presented the best average results (0.59), followed by Spain (0.57), Portugal (0.53), and Chile (0.49). On the other side, Costa Rica (0.34), Andorra (0.35), Uruguay (0.40), and Argentina (0.42) had the lowest grades. Brazil (0.47) reached exactly the global average score of the group.
Uruguay’s heterogeneity was remarkably high (0.63), with values ranging from 0.11 to 0.74. Costa Rica followed this tendency with a discrepant 0.49 of variation among municipalities. Both Spain and Portugal presented high variation among results: the first presented values between 0.77 and 0.29 (a variation of 0.48), and the second between 0.77 and 0.31 (a variation of 0.46). In the opposite direction, Andorra presented the
Table 6. Hypotheses investigated in the study
Hypotheses Definitions
Main Hyphotesis (H1) Population density exerts a quadratic influence on MWM Final Result Complimentary Hypothesis 1a (H1a) Population density exerts a quadratic influence on Information Complimentary Hypothesis 1b (H1b) Population density exerts a quadratic influence on Service
Complimentary Hypothesis 1c (H1c) Population density exerts a quadratic influence on Participation
98
© 2016 Lectito BVmost homogeneous results, with values ranging from 0.23 to 0.46 (a variation of 0.23). Mexico, Chile, Brazil, and Argentina produced similar websites (values ranged from 0.40 to 0.74, 0.35 to 0.66, 0.26 to 0.58, and 0.29 to 0.55, respectively).
Every country presented at least one case of low quality website (any result lower than 0.40). Only five countries scored high (any result above 0.6). Colombia, Spain, Portugal, Mexico, and Chile achieved this level of maturity. However, in general terms, even the highest results were still lower than the expected, because no website reached a 0.80 final score.
Looking at the results on each dimension, Colombia had the highest scores in Information (0.24) and Participation (0.24). On the other hand, Chile scored higher (0.18) than any other country in Service. Colombia, Costa Rica, Andorra, and Portugal presented remarkable deficiencies in a specific dimension. Colombia failed in providing Service (0.12) in accordance to the high quality observed in the other two dimensions (0.24 for both Information and Participation). Portugal and Andorra also produced low quality websites when considering Service (0.06 and 0.11, respectively). The reduced Andorran territory should explain the almost inexistent Service provision. In contrast, Portugal must reorganize its Service orientation to harmonize it with its high level of financial development when compared to Argentina, Brazil, Chile, Colombia, and Mexico (see World Economic Forum, 2012, p. 12). Costa Rica, albeit in a different dimension, offered little solutions for Participation. Figure 2 illustrates these dimensional differences between the studied Iberoamerican nations.
Argentina, Brazil, Chile, Mexico, Spain, and Uruguay produced an interesting tendency: no significant differences among results by dimension were evidenced. In other words, each dimension contributed almost the same for the MWM Final Result.
A single group of analysis: all municipalities ranked
Another way to see the results is by focusing on local governments, regardless of their country. In this sense, we present the five highest scores and the five lowest scores obtained for each dimension and for the MWM Final Results (Tables 7, 8, 9, and 10)14.
14 The cantón of Limón in Costa Rica was omitted, because it scored 0 for all criteria.
© 2016 Lectito BV
99
Table 7. Results in the Information dimension (highlights)Highest scores* Lowest scores*
Municipality Score Municipality Score
Madrid ESP 0.30 Escaldes-Engord. AND 0.09
Mitú COL 0.27 Santa Rosa ARG 0.09
Puerto Carreño COL 0.27 Valparaíso CHL 0.09
Valencia ESP 0.27 Coimbra POR 0.09
Lisboa POR 0.27 Viedma ARG 0.09
Alajuela CRC 0.09
La Plata ARG 0.06
Treinta y Tres URU 0.06
Rio Negro URU 0.03
*All municipalities with the same score were considered to construct this table.
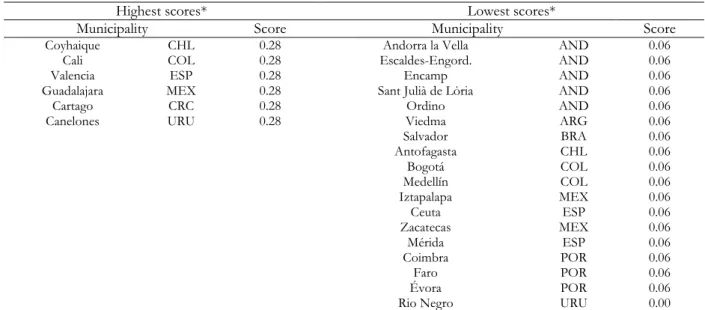
Table 8. Results in the Service dimension (highlights)
Highest scores* Lowest scores*
Municipality Score Municipality Score
Coyhaique CHL 0.28 Andorra la Vella AND 0.06
Cali COL 0.28 Escaldes-Engord. AND 0.06
Valencia ESP 0.28 Encamp AND 0.06
Guadalajara MEX 0.28 Sant Julià de Lòria AND 0.06
Cartago CRC 0.28 Ordino AND 0.06
Canelones URU 0.28 Viedma ARG 0.06
Salvador BRA 0.06 Antofagasta CHL 0.06 Bogotá COL 0.06 Medellín COL 0.06 Iztapalapa MEX 0.06 Ceuta ESP 0.06 Zacatecas MEX 0.06 Mérida ESP 0.06 Coimbra POR 0.06 Faro POR 0.06 Évora POR 0.06
Rio Negro URU 0.00
*All municipalities with the same score were considered to construct this table.
Table 9. Results in the Participation dimension (highlights)
Highest scores* Lowest scores*
Municipality Score Municipality Score
Barcelona ESP 0.33 Andorra la Vella AND 0.08
Lisboa POR 0.33 Escaldes-Engord. AND 0.08
Montevideo URU 0.33 Rio Negro URU 0.08
La Plata ARG 0.25 Córdoba COL 0.08
Medellín COL 0.25 Santa Rosa ARG 0.08
Cali COL 0.25 Salvador BRA 0.08
Mitú COL 0.25 Valparaíso CHL 0.08
Inírida COL 0.25 San José CRC 0.08
P. Carreño COL 0.25 Colima MEX 0.08
Madrid ESP 0.25 Canelones URU 0.08
Mérida ESP 0.25 Punta Arenas CHL 0.08
Porto POR 0.25 Valencia ESP 0.08
Pta. Delgada POR 0.25 Ceuta ESP 0.08
Évora POR 0.25 Faro POR 0.08
Guadalajara MEX 0.25 Treinta y Tres URU 0.08
Puebla MEX 0.25 Durazno URU 0.08
Iztapalapa MEX 0.25 Tlaxcala MEX 0.08
Cartago CRC 0.00
Alajuela CRC 0.00
100
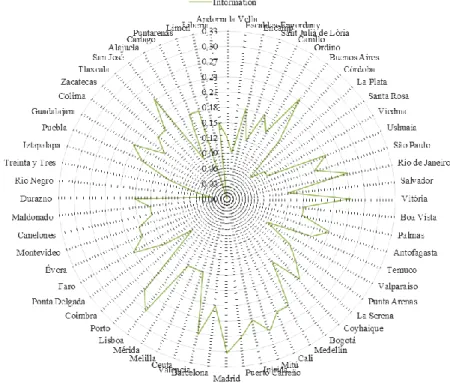
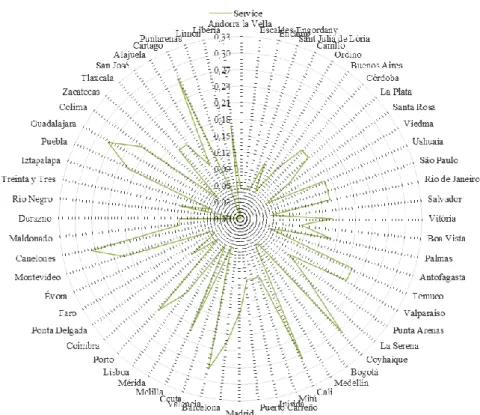
© 2016 Lectito BVTables 7 to 10 expand data analysis to a local perspective by showing specific municipal website characteristics. Almost all top-5 municipalities are Colombian (nine observations in each dimension and in the final results), Spanish (7 observations), Portuguese (6 observations) and Mexican (5 observations), except for two Uruguayan cases (one in Service and other in the MWM Final Result), and other three cases: one Chilean, other Argentinian and another Costa Rican in Service dimension. In contrast, when analyzing the lowest scores, we found at least one municipality for each country evaluated. Figures 3, 4, and 5 present dimensional municipal scores, while Figure 6 shows Final MWM municipal scores.
Also interesting is to mention that there were some observations that scored extremely high in Information and also in Participation. In Information, we highlight the result for the municipality of Madrid, which scored 0.30 in 0.33 possible. In Participation, Barcelona, Lisboa, and Montevideo all scored 0.33 (the highest score possible). In Service, the highest score was Chilean, but still lower if compared to the other two dimensions. Clearly, all results were lower in Service, what evidenced an underdevelopment of this dimension and confirmed previous findings pointed by the literature in the field, such as the evidenced pathway to electronic development: municipalities focus on Information and then they move towards Participation and Service provision (Dias & Costa, 2013, p. 295). Participation provision was dramatically influenced by the usage of social media. Forty-four localities offered any kind of open discussion in external websites commonly accessed by citizens (e.g., Facebook and Twitter), what expands the conclusions of Bonsón et al. (2016, p. 73) for the European space and reafirms that the use of Facebook has become a commonplace in Iberoamerican muncipalities, although not directly related with effective social engagement. Moreover, municipalities appears to be using such social media tools to increase transparency and to boost the trust in local government operation (see Song & Lee, 2016).
Table 10. MWM Final Results (highlights)
Highest scores Lowest scores
Municipality Score Municipality Score
Barcelona ESP 0.77 Andorra la Vella AND 0.26
Cali COL 0.77 Salvador BRA 0.26
Lisboa POR 0.77 Treinta y Tres URU 0.25
Guadalajara MEX 0.74 Escaldes-Engord. AND 0.23
Montevideo URU 0.74 Alajuela CRC 0.20
Rio Negro URU 0.11
© 2016 Lectito BV
101
Figure 4. Results in Service dimension by municipality102
© 2016 Lectito BVNo municipality appeared in all top-5 rankings, whereas three localities presented systematic low results in all dimensions and in the aggregate final score: Escaldes-Engordany (Andorra), Rio Negro (Uruguay), and Limón (Costa Rica). Alajuela (Costa Rica), Andorra la Vella (Andorra), Salvador (Brazil), and Treinta y Tres (Uruguay) also scored low in all three dimensions, even though they do not appear in Table 10. Valparaiso (Chile), Viedma (Chile), Santa Rosa (Argentina), Faro (Portugal), Coimbra (Portugal), and Ceuta (Spain) appeared twice with low grades.
Clustering the observations in population density groups
In this subsection, we analyze the results from another perspective. Population density is certainly a valid way to assess population patterns as whole and, as hypothesized in this paper, it affects local e-government maturity. Figure 7 suggests a parabolic dynamic for the municipal average scores obtained when grouping
Figure 6. MWM Final Results by municipality
© 2016 Lectito BV
103
observation by population density. We can see that ‘low’ density municipalities presented a higher mean when compared to their ‘moderate’, ‘high’ and ‘very high’ counterparts. Surprisingly, places with ‘low’ and ‘ultra-high’ population density seem to build better local government websites.
Three groups presented extremely heterogeneous results: the ‘very high’, the ‘high’, and the ‘low’ population density municipalities. The ‘very high’ density group presented a 0.57 point of difference between the highest (0.77) and the lowest (0.20) scores. The ‘high’ density group presented a variation of 0.51 with results ranging from 0.51 to 0.00. The ‘low’ density group also offered remarkable discrepancies, because scores varied from 0.65 to 0.11 (a variation of 0.54). On the other hand, ‘ultra-high’ and ‘moderate’ population density groups were much more homogeneous, presenting variations of 0.35 and 0.23, respectively. In summary, the means for ‘ultra-high’ density municipalities were higher than for the others, as expected; while ‘low’ density localities also provisioned high quality solutions, contrary to expectations. Literature, as previously observed, considered local e-government linearly influenced by population patterns (Dias & Costa, 2013; Gandía & Archidona, 2008; Moon, 2002; Norris & Reddick, 2013; Torpe & Nielsen, 2004; Weare et al., 1999). In our Iberoamerican context, population density established a more complex relation with e-government maturity: a quadratic relation that will be better investigated in the next subsection of this paper.
In more detail, it was also observed how each population density group scored in Information, Service, and Participation dimensions. A gap in Service provision was then observed, except for the ‘very high’ density average result. Figure 8 shows this behavior.
Consequently, population density seems to be associated with a minimum level of maturity for the local websites evaluated in the study. There were no ‘ultra-high’ density municipalities with a score lower than 0.43, which means that there is evidence to believe that huge populations combined with very reduced areas do not produce incomplete local government websites. They will provide at least basic Information and Participation tools to enhance transparency and democracy. Table 11 shows all ‘ultra-high’ density municipalities and their MWM Final scores.
There are seven countries represented in this ‘ultra-high’ density group. Only Andorra, Chile, and Uruguay did not appear in this list, because even their most dense municipalities were not considered as ‘ultra-high’ localities. Only two municipalities scored below 0.50 (Iztapalapa and San José), while 11 other localities scored above this baseline. Special attention should be given to the five highest grades (Barcelona, Lisboa, Guadalajara, Madrid, and Porto), because they all scored above 0.70.
104
© 2016 Lectito BVDoes population density explain local e-government maturity?
Explaining social phenomena is not an easy task. The complex interaction between political and psychological factors pose a remarkable difficulty to the hypothesis testing process. In fact, history has been shaping economy, culture, and also technology. Consequently, local e-government has been influenced by such complexity and, as any other social phenomenon, should be understood as an adaptable construct. Population density has then appeared as a powerful element to unveil municipal e-government. Even considering major limitations to access socioeconomic standardized municipal data, such variable proved to be relevant and necessary.
Avoiding complexity, our model is potentially simple. It only tried to capture how population density influences MWM Final Results and its implicit dimensions (Information, Service, and Participation). We found robust evidence to confirm Hypothesis 1, because a quadratic relation between MWM Final Results and population density was observed when running the model (see Table 12).
In fact, this model fits well. Both statistical significance of the parameters at the 0.05 level and an evidenced R² of 0.246 for a single-variable model allow us to state that population density does not have a random effect on local e-government maturity and that it certainly matter to understand how municipalities react to the provision of web-based solutions for citizens.
However, is this quadratic relation evidenced in all e-government dimensions? The answer is no. Population density determines a polynomial interaction with Information and Participation elements, but not with Service provision. Tables 13, 14, and 15 show the results of a quadratic testing procedure for these three dimensions.
Population density certainly produced effect on Information and Participation patterns. Table 13 and 15 presented well-fitted p-values at the 0.05 level for both Information and Participation, what makes possible to confirm hypotheses 1a and 1c, i.e., we can state that population density is significant to determine the amount
Table 11. MWM Final Results for Ultra-High Density municipalities
Municipality Population density (people/km²) Score
Barcelona ESP 16,350.88 0.77 Lisboa POR 5,114.11 0.77 Guadalajara MEX 9,874.45 0.74 Madrid ESP 5,223.16 0.72 Porto POR 5,365.81 0.71 Valencia ESP 5,825.36 0.63
Rio de Janeiro BRA 5,389.46 0.58
Medellín COL 6,307.81 0.55
Melilla ESP 6,500.69 0.54
Buenos Aires ARG 14,307.68 0.52
São Paulo BRA 7,820.53 0.52
San José CRC 7,418.62 0.49
Iztapalapa MEX 16,005.17 0.43
Table 12. Testing a quadratic relation between MWM Final Results and Population density
Dependent variable: MWM Final Results
Independent Variables Coefficient Standard Error p-value
Constant 0.561 0.072 0.009*
[𝐥𝐨𝐠𝟏𝟎(𝐏𝐃)] -0.190 0.070 0.001*
[𝐥𝐨𝐠𝟏𝟎(𝐏𝐃)] ² 0.050 0.015 0.000*
Coefficient of Determination (R²) = 0.246
*Statistically significant (5% level).
Table 13. Testing a quadratic relation between Information and Population density
Dependent variable: Information
Independent Variables Coefficient Standard Error p-value
Constant 0.227 0.028 0.000*
[𝐥𝐨𝐠𝟏𝟎(𝐏𝐃)] -0.089 0.027 0.002*
[𝐥𝐨𝐠𝟏𝟎(𝐏𝐃)] ² 0.022 0.006 0.000*
Coefficient of Determination (R²) = 0.249
© 2016 Lectito BV
105
of information available and the level of participation maturity of the evaluated municipal websites.
In the opposite direction, it was evidenced that population density does not affect Service provision in this set of Iberoamerican municipalities. Table 14 confirms such finding, because p-values did not present statistical significance for the relevant parameters and the R² analysis displayed no robust evidence to consider population density determinant for Service maturity in municipal websites of the region.
LIMITATIONS
Explaining local e-government is not an easy task. In fact, many socioeconomic factors were previously categorized as relevant to comprehend e-government maturity15. It is significantly simpler to compare municipalities using a single-country perspective. Many parameters and variables (e.g., education level, local budget, urbanization, etc.) would be easily found in national statistics and official censuses. In Europe, it is also possible to gather municipal data, because there are at least common socioeconomic datasets that adopt similar measurements and offer similar information about their countries and respective local governments.
However, municipal data is definitely not standardized beyond national borders, or at least beyond European borders. A scarce and incompatible amount of information is available for different periods, using distinct methodologies, and considering also different variables to measure relevant socioeconomic factors. In summary, population density appeared as a tangible way to configure a preliminary, albeit partial, cross-country explanation for local e-government in the region. More variables should be considered to enhance our proposed explanation for the phenomenon, but it is extremely difficult to homogenize decentralized information provided by different institutions with diversified interests.
CONCLUSIONS
In this paper, we presented an exploratory study of local e-government maturity for Andorra, Argentina, Brazil, Chile, Colombia, Costa Rica, Mexico, Portugal, Spain, and Uruguay. We concluded that Colombia, Spain, Portugal, and Mexico appeared as the countries with more complete municipal websites when considering an average approach. As a ratification of the findings presented by Dias & Costa (2013) about local e-government maturity in Portugal and as an extension of the observed association between municipal efficiency and population density in Spanish localities provided by Benito et al. (2010), we conclude that population density is relevant and necessary to explain local e-government in Iberoamerica.
Despite the fact that we found good MWM results for some municipalities, we can also agree with Dias & Gomes (2014) and Salazar et al. (2010) by saying that local e-government remains substantially underdeveloped in this group of countries and that municipalities seem to favor the development of simpler
15 Tables 1 and 2 offer a detailed compendium of information about influencing factors that have been used to explain
local e-government maturity.
Table 14. Testing a quadratic relation between Service and Population density
Dependent variable: Service
Independent Variables Coefficient Standard Error p-value
Constant 0.114 0.037 0.003*
[𝐥𝐨𝐠𝟏𝟎(𝐏𝐃)] -0.011 0.036 0.754
[𝐥𝐨𝐠𝟏𝟎(𝐏𝐃)] ² 0.006 0.008 0.399
Coefficient of Determination (R²) = 0.093
*Statistically significant (5% level).
Table 15. Testing a quadratic relation between Participation and Population density
Dependent variable: Participation
Independent Variables Coefficient Standard Error p-value
Constant 0.220 0.037 0.000*
[𝐥𝐨𝐠𝟏𝟎(𝐏𝐃)] -0.090 0.036 0.016*
[𝐥𝐨𝐠𝟏𝟎(𝐏𝐃)] ² 0.022 0.008 0.006*
Coefficient of Determination (R²) = 0.150
106
© 2016 Lectito BVfacilities, instead of providing services or complex participation forms of interaction. In addition, all MWM Final Results were lower than 0.77, inasmuch as these scores are still far from the ideal.
We also verified that the gap between the municipalities with higher scores and the ones with lower scores seems to remain, even for Colombia, Spain, Portugal and Mexico. In sum, every country presented at least one case of low MWM Final Result.
For a good comprehension of the results, two special situations must be quoted here. First, Colombia has a territorial e-government strategy that involves the constant development and improvement of local websites by offering new Information and Communications Technology (ICT) solutions (see Casasbuenas et al., 2009; MinTIC Colombia, 2015). Second, Chile has a well-established Tax Administration Service – SII (Servicio de Impuestos Internos) that works as an important tool for e-government Service dimension and represents a fundamental point to understand why many Chilean municipalities (not all of then provide direct access to SII) scored higher in this dimension (see Kana & Barraza, 2001).
Moreover, it is clear that population patterns, and especially population density, matter to explain municipal website maturity. Albeit still limitative, population density must be took into account when evaluating local e-government. In a quadratic perspective, both ‘ultra-high’ density and ‘low’ density localities presented better average MWM Final Results. ‘Ultra-high’ density implies a minimum level of maturity and ‘low’ density is associated with high levels of maturity if supported by national or regional e-government development projects.
Population density is statistically significant to explain both Information and Participation dimensions in a quadratic mode. Municipalities apparently offer general information and simple participation facilities in order to make citizens believe in the political operation of the locality. However, Service provision does not follow the same tendency. Population density is not relevant to determine a more complex service-centered local website provision.
Other necessary note should be made: Portugal was the only country that presented extremely high scores in the other two dimensions with low scores in Service provision, when compared to the other evaluated Iberoamerican nations. This finding must reinforce the necessity to harmonize the Portuguese high level of financial development with new forms of municipal on-line payments.
Future works may verify if other variables enhance the explanatory power of the proposed model. Even though our results show that population density matters, at least for the Iberoamerican observations collected, we still have to find other reasons that help us to better explain local e-government maturity as a whole. Literature offers us many other variables to be tested. We must only find new solutions to harmonize data in a municipal scale, either by creating academic forums to discuss about this specific limitation, or by developing research networks to facilitate access to more municipal data from different Iberoamerican countries and perhaps from many other countries in the world.
REFERENCES
Al-Aama, A.Y., 2011. Evaluating Saudi Municipal portal sophistication. Asian Transactions on Science & Technology, 1(5), pp. 1–13.
Alcaraz-Quiles, F.J., Navarro-Galera, A., and Ortiz-Rodríguez, D., 2014. Factors influencing the transparency of sustainability information in regional governments: An empirical study. Journal of Cleaner Production, 82(1), pp. 179– 191. doi:10.1016/j.jclepro.2014.06.086
Benito, B., Bastida, F., and García, J.A., 2010. Explaining differences in efficiency: An application to Spanish municipalities. Applied Economics, 42(4), pp. 515–528. doi:10.1080/00036840701675560
Biblioteca del Congreso Nacional de Chile., 2012. Reportes Estadisticos Comunales 2012. Retrieved January 28, 2015, from http://reportescomunales.bcn.cl/2012
Bonsón, E., Ratkai, M., and Royo, S., 2016. Facebook use in Western European local governments: An overall view. In M. Z. Sobaci (Ed.), Social media and local governments (pp. 59–77). New York, NY, USA: Springer International Publishing. doi:10.1007/978-3-319-17722-9
Brooks, L., and Persaud, A., 2015. Comparing local e-government websites in Canada and the UK. In Lecture Notes in Computer Science (including subseries Lecture Notes in Artificial Intelligence and Lecture Notes in Bioinformatics) (Vol. 9248, pp. 291–304). London, UK: Springer. doi:10.1007/978-3-319-22479-4_22
Casasbuenas, G.J., Barrera, G.A., and Paz, M.O.P., 2009. From the internet for accountability project to the territorial e-government strategy in Colombia. In Proceedings of the 3rd International Conference on Theory and Practice of Electronic Governance - ICEGOV ’09 (pp. 315–320). New York, NY, USA: ACM Press. doi:10.1145/1693042.1693108 Cegarra-Navarro, J.G., Pachón, J.R.C., and Cegarra, J.L.M., 2012. E-government and citizen’s engagement with local
affairs through e-websites: The case of Spanish municipalities. International Journal of Information Management, 32(5), pp. 469–478. doi:10.1016/j.ijinfomgt.2012.02.008
© 2016 Lectito BV
107
Cook, M.E., LaVigne, M.F., Pagano, C.M., Dawes, S.S., and Pardo, T.A., 2002. Making a Case for Local E-Government. Albany, NY, USA: Center for Technology in Government.
Coursey, D., and Norris, D.F., 2008. Models of e-government: Are they correct? an empirical assessment. Public Administration Review, 68(3), pp. 523–536. doi:10.1111/j.1540-6210.2008.00888.x
Cruz, C.F., Ferreira, A.C. de S., da Silva, L.M., and Macedo, M.Á. da S., 2012. Transparência da gestão pública municipal: um estudo a partir dos portais eletrônicos dos maiores municípios brasileiros. Revista de Administração Pública, 46(1), pp. 153–176. doi:10.1590/S0034-76122012000100008
Cullen, R., O’connor, D., and Veritt, A., 2003. An evaluation of local government websites in New Zealand. Journal of Political Marketing, 2(3-4), pp. 184–211. doi:10.1300/J199v02n03_11
D’Agostino, M.J., Schwester, R., Carrizales, T., and Melitski, J., 2011. A study of e-government and e-governance: an empirical examination of municipal websites. Public Administration Quarterly, 35(1), pp. 3–28.
Deakins, E., Dillon, S., and Chen, W., 2007. A Comparison between e-government practices in Taiwan and New Zealand. Communications of the ICISA, 8(2), pp. 1–24.
Departamento Administrativo Nacional de Estadística de Colombia., 2015. Estimación y proyección de población nacional, departamental y municipal total por área 1985-2020. Retrieved January 28, 2015, from http://www.dane.gov.co/index.php/poblacion-y-demografia/proyecciones-de-poblacion
Departamento de Estadística de Andorra., 2015. Censos parroquiales de los Comuns - Población Estimada por
Parroquia 2014. Retrieved January 28, 2015, from
http://www.estadistica.ad/serveiestudis/web/banc_dades4.asp?formules=inici&any1=01/01/2014&any2=01/01 /2014&codi_divisio=2162&codi_tema=2&lang=2&codi_subtemes=233&ordre_descripcio=2
Dias, G.P., 2011a. Local e-government information and service delivery. In Proceedings of the 6th Iberian Conference on Information Systems and Technologies - CISTI’2011 (pp. 1–6). Chaves, Portugal: IEEE.
Dias, G. P., 2011b. Q-Model: um modelo bidimensional de maturidade para o e-government. Revista Ibérica de Sistemas E Tecnologias de Informação, 7, pp. 33–46.
Dias, G.P., and Costa, M., 2013. Significant socio-economic factors for local e-government development in Portugal. Electronic Government, an International Journal, 10(3/4), 284–309. doi:10.1504/eg.2013.058785
Dias, G.P., and Gomes, H., 2014. Evolution of local e-government maturity in Portugal. In Proceedings of the 9th Iberian Conference on Information Systems and Technologies - CISTI’2014 (pp. 1–5). Barcelona, Spain: IEEE. doi:10.1109/CISTI.2014.6877041
DiMaggio, P. J., & Powell, W. W., 1983. The iron cage revisited: Institutional isomorphism and collective rationality in organizational fields. American Sociological Review, 48(2), pp. 147–160.
Domínguez, L.R., Sánchez, I.M.G., and Álvarez, I.G., 2011. Determining factors of e-government development: A worldwide national approach. International Public Management Journal, 14(2), pp. 218–248. doi:10.1080/10967494.2011.597152
dos Santos, L.D., and do Amaral, L.A.M., 2012. Avaliação da presença na Internet das câmaras municipais portuguesas em 2009. Guimarães, Portugal: Gávea - University of Minho.
Edmiston, K.D., 2003. State and local e-government: Prospects and challenges. The American Review of Public Administration, 33(1), pp. 20–45. doi:10.1177/0275074002250255
Fan, Q., 2011. An evaluation analysis of e-government development by local authorities in Australia. International Journal of Public Administration, 34(14), pp. 926–934. doi:10.1080/01900692.2011.615550
Federación Colombiana de Municipios., 2015. Información Básica Municipal. Retrieved January 30, 2015, from https://www.fcm.org.co/DirectorioDeContactos/Paginas/Directorio-de-Contactos.aspx
Ferreira da Cruz, N., Tavares, A.F., Marques, R.C., Jorge, S., and de Sousa, L., 2015. Measuring local government transparency. Public Management Review, pp. 1–28. doi:10.1080/14719037.2015.1051572
Gandía, J.L., and Archidona, M.C., 2008. Determinants of web site information by Spanish city councils. Online Information Review, 32(1), pp. 35–57. doi:10.1108/14684520810865976
Goldfrank, B., 2011. Deepening local democracy in latin america: Participation, decentralization, and the left. University Park, PA, USA: Pennsylvania State University Press.
Hilbert, M., 2005. Development trends and challenges for local e-governments: Evidence from municipalities in Chile and Peru. Retrieved February 13, 2015, from http://hdl.handle.net/11362/31922
Instituto Brasileiro de Geografia e Estatística., 2015. Cidades@. Retrieved January 28, 2015, from http://www.cidades.ibge.gov.br/xtras/home.php
Instituto Geográfico Nacional de España., 2015. Sistema de Información Geográfico Nacional de España. Retrieved January 30, 2015, from http://signa.ign.es/signa/
Instituto Nacional de Estadística de España., 2015. INEbase/Estadísticas territoriales. Retrieved January 28, 2015, from http://www.ine.es/FichasWeb/Welcome.do
Instituto Nacional de Estadística de Uruguay., 2013. Población por sexo y edad, 1996-2025. - Indicadores de estructura por sexo y edad de la población, 1996-2025. Retrieved February 21, 2016, from http://www.ine.gub.uy/web/guest/estimaciones-y-proyecciones
Instituto Nacional de Estadística y Censos de Argentina., 2010. Resultados del Censo 2010. Retrieved January 28, 2015, from http://censo2010.indec.gov.ar/resultadosdefinitivos.asp
108
© 2016 Lectito BV Instituto Nacional de Estadística y Censos de Costa Rica., 2011. Población total por grupos de edades, según provincia y cantón2011-2025. Retrieved January 30, 2015, from http://www.inec.go.cr/
Instituto Nacional de Estadística y Censos de Costa Rica., 2014. Indicadores demográficos cantonales 2013. Retrieved January 30, 2015, from http://www.inec.go.cr/flipbook/idc2013/index.html
Instituto Nacional de Estadística y Geografía de Mexico., 2011. México en Cifras: Información Nacional, por Entidad Federativa y Municipios. Retrieved February 5, 2016, from http://www3.inegi.org.mx/sistemas/mexicocifras/default.aspx Instituto Nacional de Estatística de Portugal., 2015. Densidade populacional por Local de residência. Retrieved January 10,
2015, from https://www.ine.pt/xportal/xmain?xpid=INE&xpgid=ine_bdc_tree&contexto=bd&selTab=tab2 Kana, L., and Barraza, F., 2001, January. Taxing time for e-government. OECD Observer, 224, pp. 50–51.
Karkin, N., and Janssen, M., 2014. Evaluating websites from a public value perspective: A review of Turkish local government websites. International Journal of Information Management, 34(3), pp. 351–363. doi:10.1016/j.ijinfomgt.2013.11.004
Kim, C.-K., 2007. A cross-national analysis of global e-government. Public Organization Review, 7(4), pp. 317–329. doi:10.1007/s11115-007-0040-5
Lappas, G., Triantafillidou, A., Yannas, P., and Kleftodimos, A., 2015. Local e-government and e-democracy: An evaluation of Greek municipalities. In S. K. Katsikas & A. B. Sideridis (Eds.), E-Democracy – Citizen Rights in the World of the New Computing Paradigms (Vol. 570, pp. 134–150). Cham, Switzerland: Springer International Publishing. doi:10.1007/978-3-319-27164-4
Lau, T.Y., Aboulhoson, M., Lin, C., and Atkin, D.J., 2008. Adoption of e-government in three Latin American countries: Argentina, Brazil and Mexico. Telecommunications Policy, 32(2), pp. 88–100. doi:10.1016/j.telpol.2007.07.007
Maciel, G.G., Gomes, H., and Dias, G.P., 2015. Evaluating local e-government maturity in selected Iberoamerican countries. In Proceedings of the 10th Iberian Conference on Information Systems and Technologies - CISTI’2015 (pp. 1–7). Águeda, Portugal: IEEE. doi:10.1109/CISTI.2015.7170380
Martinuzzo, J.A., 2008. Governo eletrônico no Mercosul : O retrato segundo os portais federais de e-gov. Revista de Economía Política de Las Tecnologías de La Información Y Comunicación, X(1), pp. 1–22.
MinTIC Colombia - Ministerio de Tecnologias de la Información y las Comunicaciones de Colombia., 2015. Estrategia Gobierno en línea. Retrieved January 29, 2015, from http://www.programa.gobiernoenlinea.gov.co
Miranda, F.J., Sanguino, R., and Bañegil, T.M., 2009. Quantitative assessment of European municipal web sites. Internet Research, 19(4), pp. 425–441. doi:10.1108/10662240910981380
Moon, M.J., 2002. The Evolution of e-government among municipalities: Rhetoric or reality? Public Administration Review, 62(4), pp. 424–433. doi:10.1111/0033-3352.00196
Moon, M.J., and DeLeon, P., 2001. Municipal reinvention: Managerial Values and diffusion among municipalities. Journal of Public Administration Research and Theory, 11(3), pp. 327–351.
Musso, J., Weare, C., and Hale, M., 2000. Designing web technologies for local governance reform: Good management or good democracy? Political Communication, 17(1), pp. 1–19. doi:10.1080/105846000198486
Norris, D.F., and Reddick, C.G., 2013. Local e-government in the United States: Transformation or incremental change? Public Administration Review, 73(1), pp. 165–175. doi:10.1111/j.1540-6210.2012.02647.x
Oroño, A., and Gil de Vargas, B., 2012. Tercer nivel de gobierno y administración en Uruguay: Diseño institucional y funcionamiento de la descentralización municipal. In Cuarto Congreso Uruguayo de Ciencia Política “La Ciencia Política desde el Sur” (pp. 1–29). Montevideo, Uruguay: Asociación Uruguaya de Ciencia Política.
Panopoulou, E., Tambouris, E., and Tarabanis, K., 2008. A framework for evaluating web sites of public authorities. Aslib Proceedings, 60(5), pp. 517–546. doi:10.1108/00012530810908229
Pina, V., Torres, L., and Royo, S., 2009. E-government evolution in EU local governments: A comparative perspective. Online Information Review, 33(6), pp. 1137–1168. doi:10.1108/14684520911011052
Podder, B., 2013. Evaluating local e-government in New Zealand: A socio-technical approach. PhD Thesis. Auckland, New Zealand: Auckland University of Technology.
Pritsch, J.M.L., 2012. Superficies del Uruguay: Medirlas, una tarea sin final. Revista Del Instituto Histórico Y Geográfico Del Uruguay, 35(1).
Rodríguez, R., Estevez, E., Giulianelli, D., and Vera, P., 2009. Assessing e-governance maturity through municipal websites – measurement framework and survey results. In Proceedings of the 15th Argentinean Computer Science Congress, 6th Workshop on Software Engineering (pp. 722–731). San Salvador de Jujuy, Argentina: RedUNCI.
Rosales, M., and Carmona, S.V., 2009. Latin America. In United Cities and Local Governments (Ed.), Decentralization and Local Democracy in the World: First Global Report 2008 (pp. 170–203). Barcelona, Spain: World Bank & United Cities and Local Governments.
Salazar, C., Fernández-Tejeda, P., and Ubeda-Medina, P., 2010. E-local government: Analysis of Internet connections and local government’s budgets for e-services development. Journal of Globalization, Competitiveness and Governability, 4(1), pp. 90–101.
Sandoval-Almazan, R., and Gil-Garcia, J.R., 2010. Assessing local e-government. In Proceedings of the 4th International Conference on Theory and Practice of Electronic Governance - ICEGOV ’10 (p. 61). New York, New York, USA: ACM Press. doi:10.1145/1930321.1930335
© 2016 Lectito BV
109
Santana, M., 2009. A preliminary assessment of the development of e-Government in a local government in Peru. Journal of Asia-Pacific Studies, 12(1), pp. 75– 89.
Sardà, A.M., Rodríguez-Navas, P.M., and Rius, M.C., 2013. The information published by local governments. The websites of Catalonia’s municipal governments. Revista Latina de Comunicación Social, 68, pp. 502–528. doi:10.4185/RLCS-2013-987en
Schiavi, P., 2013. El desafío de los gobiernos municipales en el Uruguay: Participación ciudadana, transparencia y articulación. Revista de Derecho de La Universidad de Montevideo, 22, pp. 81–106.
Shackleton, P., Fisher, J., and Dawson, L., 2004. Evolution of local government services: The applicability of e-business maturity models. In Proceedings of the 37th Annual Hawaii International Conference on System Sciences (pp. 1–9). Hilo, HI, USA: IEEE. doi:10.1109/HICSS.2004.1265308
Sheffer Corrêa, A., Pizzigatti Corrêa, P.L., and da Silva, F.S.C., 2014. Transparency portals versus open government data: An Assessment of Openness in Brazilian Municipalities. In Proceedings of the 15th Annual International Conference on Digital Government Research - dg.o ’14 (pp. 178–185). New York, NY, USA: ACM Press. doi:10.1145/2612733.2612760
Socitm and IDeA., 2002. Local e-government now: A worldwide view. London, UK: SAP.
Song, C., and Lee, J., 2016. Citizens’ use of social media in government, perceived transparency, and trust in government. Public Performance & Management Review, 39(2), pp. 430–453. doi:10.1080/15309576.2015.1108798 Torpe, L., and Nielsen, J., 2004. Digital communication between local authorities and citizens in Denmark. Local
Government Studies, 30(2), pp. 230–244. doi:10.1080/0300393042000267254
United Nations., 2015. Compare countries. Retrieved February 21, 2016, from https://publicadministration.un.org/egovkb/en-us/Data/Compare-Countries
Weare, C., Musso, J.a., and Hale, M.L., 1999. Electronic democracy and the diffusion of municipal web pages in California. Administration & Society, 31(1), pp. 3–27. doi:10.1177/009539999400935475
World Economic Forum., 2012. The Financial Development Report 2012. Insight Report. New York, NY, USA: WEF.
Zhao, F., Shen, K.N., and Collier, A., 2014. Effects of national culture on e-government diffusion-A global study of 55 countries. Information and Management, 51(8), pp. 1005–1016. doi:10.1016/j.im.2014.06.004