“Cytotoxicity and cell cycle effects of gold and silver
nanoparticles in human intestinal epithelial Caco-2 cells”
Mariana Vinhas FernandesMaster degree in Analytical, Clinical and Forensic Toxicology
Dissertation thesis for the Master Degree in Analytical, Clinical and Forensic Toxicology submitted to the Faculty of Pharmacy
Dissertação de candidatura ao grau de Mestre em Toxicologia Analítica, Clínica e Forense apresentada à Faculdade de Farmácia
Supervisors:
Doutora Sónia Alexandra Teixeira Fraga
Professora Doutora Helena Maria Ferreira da Costa Ferreira Carmo Professora Doutora Maria de Lurdes Pinho de Almeida Souteiro Bastos
University of Porto
September 2014
IS AUTHORIZED THE INTEGRAL REPRODUCTION OF THIS THESIS FOR
RESEARCH PURPOSES BY MEANS OF A WRITTEN DECLARATION FOR
Experimental work carried out in REQUIMTE Laboratory, Department of
Toxicology,
“Tell me and I forget.
Teach me and I remember.
Involve me and I learn.”
Benjamin FranklinAknowledgements
Agradecimentos
Com a finalização desta etapa da minha vida não podia deixar de agradecer a algumas pessoas que me apoiaram incondicionalmente nesta aventura que foi o Mestrado de Toxicologia Analítica Clínica e Forense:
Primeiro, queria agradecer à Professora Doutora Maria de Lourdes Bastos, Coordenadora do Mestrado em Toxicologia Analítica Clínica e Forense, agradeço pela criação e oportunidade de frequentar o curso que, já durante a primeira graduação, pretendia efectuar.
Agradeço em particular à Dra. Sónia Alexandra Teixeira Fraga, pela orientação e pela disponibilidade incondicional durante estes meses no laboratório e na realização desta dissertação. Agradeço a forma generosa como me recebeu e transmitiu os seus vastos conhecimentos.
À minha co-orientadora, Professora Doutora Helena Carmo, agradeço também pela orientação e pela sabedoria, dentro e fora do laboratório, onde aprendi a pensar por mim própria.
À Doutora Renata Silva, agradeço pelos ensinamentos de citometria de fluxo e pela paciência que teve comigo na realização das experiências de ciclo celular.
Aos meus colegas do Mestrado, (eles sabem quem são por isso não vou estar a mencionar nomes!) queria agradecer a amizade e o companheirismo que tivemos durante estes dois anos (e que vão durar por mais anos…).
Um especial agradecimento para seis pessoas, que me ajudaram a tornar-me numa pessoa melhor, que me desafiaram todos os dias, e que me ajudaram a passar à frente em alguns momentos maus, e que festejaram comigo nos momentos bons. Por isso agradeço à Ana Sofia Oliveira, Armanda Gomes, Débora Rios de Oliveira, Márcia Monteiro, Margarida Araújo e Ana Filipa Ferreira.
Um último agradecimento à minha família, em especial aos meus pais e irmão, que me ajudaram nas alturas de maior “stress” na realização desta dissertação e pelo apoio incondicional e carinho que me dão todos os dias.´
Abstract
Nanotechnology offers an infinite possibility of advance and innovation in many fields such as industry, cosmetics, biomedicine and food/feed. The production of nanoscaled particles has grown exponentially and this growth has raised several questions regarding the environmental and health impact of these nanoparticles from their production and uses in various areas. However, compared to other fields on which nanoparticles are applied, knowledge of their safety use in the food and feed area is still scarce. The toxicological studies performed so far, demonstrated that physicochemical properties of nanoparticles, such as size, shape, surface chemistry and agglomeration state play a key role in the biological effect induced by NPs.
In the present work it was studied the cytotoxic effect of gold and silver nanoparticles in a human epithelial colorectal adenocarcinoma (Caco-2) cell line. The nanoparticles were functionalized with either citrate or a pentapeptide (CALNN, CALNS or CALND). Cytotoxicity was evaluated using an array of assays to assess the effect of the nanoparticles in cell metabolic activity, plasma membrane integrity, reactive oxygen species (ROS) production, lysosomal membrane integrity and cellular morphology. The effect of these nanoparticles on the cell cycle progression was also evaluated by flow cytometry.
Our results showed that gold nanoparticles had no significant impact in the cells morphology and cytotoxicity endpoints mentioned above. However, silver nanoparticles induced ROS production, concentration-dependent reduction of mitochondrial activity and lysosomal membrane integrity, and loss of monolayer integrity compared to untreated cells. The results from flow cytometry showed no significant difference of cell cycle progression between the treated cells and untreated cells.
Keywords: gold nanoparticles, silver nanoparticles, cytotoxicity, uptake, cell cycle, flow cytometry
Resumo
A nanotecnologia oferece uma possibilidade infinita de avanço e inovação em diversas áreas, como a indústria, cosméticos, biomedicina e nutrição. A produção e aplicação de materiais à nanoescala tem crescido exponencialmente e com este crescimento várias questões têm-se levantado relativamente ao impacto ambiental e na saúde. No entanto, em comparação com outras áreas em que as nanopartículas são aplicadas, o conhecimento sobre o seu uso e potencial risco na área alimentar ainda é escassa. Os estudos toxicológicos realizados até agora demonstraram que as propriedades físico-químicas das nanopartículas, tais como tamanho, forma, química de superfície e do estado de aglomeração desempenham um papel chave no efeito biológico induzido pelas nanopartículas.
No presente trabalho, foi estudado o efeito citotóxico de nanopartículas de ouro e de prata numa linha celular epitelial do adenocarcinoma colo-rectal humano (Caco-2). As nanopartículas foram funcionalizadas com citrato ou um pentapeptídeo (CALNN, CALNS ou CALND). A citotoxicidade foi avaliada utilizando leque de ensaios para avaliar o efeito das nanopartículas na actividade metabólica celular, na integridade da membrana plasmática, na produção de espécies reactivas de oxigénio (ROS), na integridade da membrana lisossomal e morfologia celular. O efeito destas nanopartículas na progressão do ciclo celular foi avaliado por citometria de fluxo.
Os nossos resultados mostraram que nanopartículas de ouro não tiveram um impacto significativo na morfologia celular e parâmetros de citotoxicidade acima mencionados. No entanto, as nanopartículas de prata induziram a produção de ROS, a redução da actividade mitocondrial e integridade da membrana lisossomal dependente da concentração, e a perda de integridade da monocamada, em comparação com células controlo. Os resultados de citometria de fluxo não mostraram diferenças significativas relativamente à progressão do ciclo celular entre as células tratadas e as células controlo.
Palavras- chave: nanopartículas de ouro, nanopartículas de prata, citotoxicidade, internalização, ciclo celular, citometria de fluxo
Index
Aknowledgements ... V Resumo ... IX List of Tables ... XIII List of Figures ... XV
Chapter 1 ... 1
Introduction ... 1
1.1. Nanomaterials – overview ... 3
1.2. Properties and applications ... 4
1.3. Interactions of metallic nanoparticles with biological systems ... 8
1.3.1. Influence of the physicochemical properties of gold and silver nanoparticles in the cellular uptake ... 8
1.3.2. The interaction of metallic nanoparticles with the cellular organelles ... 11
1.3.3. Toxicity of metallic nanoparticles ... 12
1.4. Cell cycle effects of AuNPs and AgNPs ... 19
1.4.1. Cell cycle- overview ... 19
1.4.2. Cell cycle behaviour in response to DNA damage ... 21
1.4.3. Metallic nanoparticles and the cell cycle ... 22
Chapter 2 ... 25
Scope and Aims ... 25
Chapter 3 ... 29
Experimental section ... 29
3.1. Materials and methods ... 31
3.1.1. Reagents and Materials ... 31
3.1.2. Cell culture ... 31
3.1.3. AuNPs and AgNPs nanoparticles ... 31
3.2. Methods and procedures ... 33
3.2.1. Cytotoxicity assays ... 33
3.2.3. Statistical analysis ... 38
Chapter 4 ... 39
Results ... 39
4.1. Cytotoxicity of AuNPs and AgNPs ... 41
4.2. Morphological analysis of Caco – 2 cells by phase contrast microscopy ... 52
4.3. Results of flow cytometry analysis ... 55
4.3.1. AuNPs and AgNPs uptake in Caco-2 cells ... 55
4.3.2. Cell cycle analysis ... 58
Chapter 5 ... 67 Discussion ... 69 Chapter 6 ... 73 Conclusion ... 75 Chapter 7 ... 77 References ... 79 Supplement 1 ... 89
List of Tables
Table 1 - Main types of NMs based on the dimensions of their structural elements. ... 3
Table 2 - Products on the market containing gold nanoparticles in their composition. ... 6
Table 3 - Products on the market containing silver nanoparticles in their composition. ... 7
Table 4 – Summary of some in vitro studies on the cytotoxicity of gold nanoparticles. .... 14
Table 5 - Summary of some in vitro studies on the genotoxicity of gold nanoparticles. ... 15
Table 6 - Summary of recent in vitro studies on the cytotoxicity of silver nanoparticles. .. 17
Table 7 - Summary of some in vitro studies on the genotoxicity of silver nanoparticles. .. 18
Table 8 - Cyclin and cyclin-dependent kinases (CDKs) involved in the cell cycle progression. ... 20 Table 9 - Main characteristics of AuNPs and AgNPs.The average size and zeta potential of the AuNPs were determined by DLS. The Au content of the suspensions was determined by GFAAS. The Ag content of the suspensions was determined by ICP-MS. ... 33 Table 10 - Gold nanoparticles (AuNPs) uptake determined by flow cytometry analysis of cell size (FSC) and complexity (SSC) in synchronized and non-synchronized cultures, after 24h of exposure. ... 55 Table 11 - Silver nanoparticles (AgNPs) uptake determined by flow cytometry analysis of cell size (FSC) and complexity (SSC) in synchronized and non-synchronized cultures, after 24h of exposure. ... 57 Table 12 - Effect of 24h-exposure to AuNPs on cell cycle distribution (%) in synchronized Caco-2 cultures. ... 59 Table 13 - Effect of 24h-exposure to AuNPs on cell cycle distribution (%) in
non-synchronized Caco-2 cultures. ... 59 Table 14 - Effect of 24h-exposure to AgNPs and AgNO3 on cell cycle distribution (%) in
Table 15 - Effect of 24h-exposure to AgNPs and AgNO3 on cell cycle distribution (%) in
List of Figures
Figure 1 - Illustrative image of endocytic pathways and intracellular interactions. The green dots are the representation of the nanoparticles or other coumpounds capable of being uptaken by endocytosis.Arf6 dependent (ADP-ribosylation factor 6) is implicated in endocytosis of plasma membrane proteins, caveolin – caveolae/lipid raft dependent leads to a local change in the morphology of the membrane,Cdc42 dependent (cell division control protein 42 homolog) - regulates signaling pathways that control cell morphology, migration, endocytosis and cell cycle progression, EE – endosomes, MP – macropinosomes, MVB – multivesicular bodies/late endosomes, Lys – lysosomes, RE – recycling endosomes, RhoA (ras homolog gene family, member A) - actson the reorganization of the actin cytoskeleton of the cell, - From (Iversen et al., 2011). ... 9 Figure 2 - Schematic representation of the cell cycle. Outer circle: I - interphase, M - mitosis. Inner circle: G1 - gap 1, S - synthesis, G2 - gap 2, G0 - resting phase, M – mitosis. ... 19 Figure 3 - Representative cell cycle histogram of Caco-2 cells analysed by flow cytometry. ... 21 Figure 4 - Diagram of cell cycle response triggered by DNA damage (From (Saidin, 2008)). ... 22 Figure 5 - Role of the cell cycle in the cellular uptake of NPs. Nanoparticle uptake in a cycling cell. The yellow-green circles represent the nanoparticles, which, inside cells, accumulate in the lysosomes, represented by the oval compartment. When the cell divides, the internalized nanoparticles are split between the two daughter cells (From (Kim et al., 2012)). ... 23 Figure 6 - Representation of the NPs used in this study: a) citrate-coated AuNPs, b) CALNN-coated AuNPs, c) CALNS- coated AuNPs, d) CALND-coated AuNPs and e) citrate-coated AgNPs. ... 32 Figure 7 - Cell staining mechanism of Calcein-AM in viable cells. ... 34
Figure 8 - Representation of the conversion of yellow tetrazolium,3-(4,5-dimethylthiazol-2-yl)-2,5-diphenyltetrazolium bromide, into the insoluble formazan crystal. ... 35
Figure 9 - Representation of the mechanism of the 2', 7'-dichlorofluorescein-diacetate (DCFH-DA) assay. ... 36 Figure 10 - Esterase activity of Caco-2 cells at (A) 6 h, (B) 24 h, (C) 48 h and (D) 72 h after exposure to Citrate-, CALNN-, CALNS-, CALND-AuNPsas assessed by the Calcein- AM assay. Results were calculated as percentage of control (untreated cells). Data is presented as mean ± SEM (n = 12-16). Data was analysed by one-way ANOVA with post-hoc Dunnet’s tests applied for multiple comparisons * P<0.05, # P<0.01; significantly different from the control value. ... 42 Figure 11 - Effects of Cit-, CALNN-, CALNS-, CALND-AuNPs in the plasma membrane integrity, determined by the propidium iodide (PI) assay, after (A) 6 h, (B) 24 h, (C) 48 h and (D) 72 h. Results were calculated as percentage of control (untreated cells). Data is presented as mean ± SEM (n = 12-16). Data was analysed using one-way ANOVA with post-hoc Dunnet’s tests applied for multiple comparisons. * P<0.05, # P<0.01, $ P<0.001, & P<0.0001 significantly
different from the control value. ... 44 Figure 12 - Effects of Cit-, CALNN-, CALNS-, CALND-AuNPs in the lysosomal integrity, determined by the neutral red absorbance assay, after (A) 6 h, (B) 24 h, (C) 48 h and (D) 72 h. Results were calculated as percentage of control (untreated cells). Data is presented as mean ± SEM (n = 12-16). Data was analysed using one-way ANOVA with post-hoc Dunnet’s tests applied for multiple comparisons. * P<0.05, # P<0.01, $ P<0.001, & P<0.0001 significantly different
from the control value. ... 46 Figure 13 - Effects of Cit-AgNPs and AgNO3 in lysosomal integrity, determined by neutral
red absorbance, after (A) 6 h, (B) 24 h, (C) 48 h. Results were calculated as percentage of control (untreated cells). Data is presented as mean ± SEM (n = 9 per group). Data was analysed using one-way ANOVA with post-hoc Dunnet’s tests applied for multiple comparisons. * P<0.05, & P<0.0001; significantly different from the control value. ... 47 Figure 14 - Effects on the Cit-AgNPs and AgNO3 in activity of mitochondrial enzymes,
determined by the MTT assay, after (A) 6 h, (B) 24 h and (C) 48 h. Results were calculated as percentage of control (untreated cells). Data is presented
with post-hoc Dunnet’s tests applied for multiple comparisons. * P<0.05, #
P<0.01, & P<0.0001; significantly different from the control value. ... 48
Figure 15 - Effects of Cit-, CALNN-, CALNS-, CALND-AuNPs in the production of reactive oxygen species, determined by the DCFH-DA assay, after (A) 6 hours, (B) 24 hours, (C) 48 hours, (D) 72 hours. Results were calculated as percentage of control (untreated cells). Data is presented as mean ± SEM (n = 12-16). Data was analysed using one-way ANOVA with post-hoc Dunnet’s tests applied for multiple comparisons. * P<0.05, # P<0.01, $ P<0.001, & P<0.0001 significantly
different from the control value. ... 50 Figure 16 - Effects of Cit-AgNPs and AgNO3 in the production of reactive oxygen species,
determined by the DCFH-DA assay, after (A) 6 hours, (B) 24 hours, (C) 48 hours and (D) 72 hours. Results were calculated as percentage of control (untreated cells). Data is presented as mean ± SEM (n = 12 per group). Data was analysed using one-way ANOVA with post-hoc Dunnet’s tests applied for multiple comparisons. * P<0.05, # P<0.01, $ P<0.001, & P<0.0001 significantly
different from the control value. ... 52 Figure 17 - Representative phase contrast microscopy images of Caco-2 cells at 72 h after incubation with: a) control, b) Vehicle (H2O), c) 1 µM of Cit - AuNPs, d) 10 µM of Cit - AuNPs, e) 100 µM of Cit - AuNPs, f) 1 µM of CALNN - AuNPs, g) 10 µM of CALNN - AuNPs, h) 100 µM of CALNN - AuNPs, i) 1 µM of CALNS - AuNPs, j) 10 µM of CALNS - AuNPs, k) 100 µM of CALNS - AuNPs, l) 1 µM of CALND – AuNPs, m) 10 µM of CALND – AuNPs and n) 100 µM of CALND – AuNPs (100 X magnification).. ... 53 Figure 18 - Representative phase contrast microscopy images of Caco-2 cells at 72 h after incubation with: a) control, b) vehicle (citrate), c) 1 µM of Cit - AgNPs, d) 10 µM of Cit - AgNPs, e) 40 µM Cit - AgNPs, f) 1 µM of AgNO3, g) 10 µM of
AgNO3, h) 40 µM of AgNO3 (100x magnification). ... 54
Figure 19 - Caco-2 cells histograms of size (FSC) and complexity (SSC) of synchronized (a and b) and non-synchronized (c and d) cultures obtained after exposure to differently coated AuNPs. 1) vehicles (H2O and citrate), 2) Cit-AuNPs, 3)
CALNN-AuNPs, 4) CALNS-AuNPs, 5) CALND-AuNPs, at the concentrations of 1 µM (red line), 3 µM (green line) and 10 µM (blue line) compared to control cells (black line). ... 57
Figure 20 - Representative histograms of AuNPs uptake in Caco-2 cells by flow cytometry analysis of cell size (FSC) and complexity (SSC) of synchronized(a and b) and non-synchronized culture (c and d), after exposure of 6) Cit-AgNPs and 7) AgNO3at the concentrations of 1 µg/mL (red line), 2.5µg/mL (green line) and
5µg/mL (blue line) comparing to control cells (black line). ... 58 Figure 21 - Representative PI fluorescence (DNA content) histograms of the Caco-2 cells (synchronized and non-synchronized cultures) after 24 h of exposure to AuNPs (10 µM). ... 62 Figure 22 - Representative PI fluorescence (DNA content) histograms of the Caco-2 cells (synchronized and non-synchronized cultures) after 24 h of exposure to 1, 2.5 and 5 µM Cit-AgNPs and AgNO3 comparing to control cells (synchronized and
non-synchronized cultures). ... 65 Figure 23 - Representative histograms of the Caco-2 cell cycle analysis by flow cytometry after 24 h of exposure with Cit-, CALNN-, CALNS- and CALND-AuNPs (1, 3 and 10 µM), comparing to control cells (synchronized and non-synchronized culture). ... 94
Abbreviations and Symbols
0-D - zero dimensional
1-D - one dimensional
2-D - two dimensional
3-D - three dimensional
11-MUA - 11-mercaptoundecanoic acid
µM - micromolar
Ag - bulk silver
AgNPs - silver nanoparticles AgNO3 - silver nitrate
ATP - adenosine triphosphate
Au - bulk gold
AuNPs - gold nanoparticles
BSA - bovine serum albumin
BSNPs - AgNPs synthesized with sodium borohydride
Ca2+ - calcium ions
CALND - pentapeptide of Cysteine–Alanine-Leucine– Asparagine – Aspartate CALNN - pentapeptide of Cysteine–Alanine-Leucine– Asparagine–Asparagine CALNS - pentapeptide of Cysteine–Alanine-Leucine–Asparagine–Serine
CDKs - cyclin-dependent kinases
CdSe - cadmium selenide quantum dot
CHKs checkpoint homolog kinases
Cit - citrate
CNTs - carbon nanotubes
CO2- carbon dioxide
CTAB - cetyl trimethylammonium bromide
DCFH-DA - dichloro-dihydro-fluorescein diacetate
DLS - dynamic light scattering
DMEM Dulbecco’s modified Eagle’s medium
DMSO - dimethyl sulfoxide
DNA - deoxyribonucleic acid
DTAF - 4,6-dichlorotriazinyl aminofluorescein
EDX - energy - dispersive X-ray
EE - endosomes
FBS fetal bovine serum
GLU - glucose
GSH - glutathione
HBSS Hank’s balanced salt solution
HEPES N-2-hydroxyethylpiperazine-N’-2-ethanosulfonic acid
HER2 - human epidermal growth factor receptor 2
HIV-1 - human immunodeficiency virus 1
ICP-MS - inductively coupled plasma mass spectrometry
IgG - immunoglobulin G LDH - lactate dehydrogenase Lys - lysosomes MN - micronucleus MP - macropinosomes MTS - 3-(4,5-dimethylthiazol-2-yl)-5-(3-carboxymethoxyphenyl)-2-(4-sulfophenyl)-2H-tetrazolium MTT - 3-(4,5-dimethylthiazol-2-yl)-2,5-diphenyltetrazolium bromide
MVB - multivesicular bodies/late endosomes
NIST - National Institute of Standards and Technology
NMs - nanomaterials
nm - nanometer
nM - nanomolar
NPs - nanoparticles
NR - neutral red
PAA - poly (allyamine hydrochloride)
PAMAM - poly (amido amine) dendrimers,
PBS phosphate buffered saline
PEG - poly(ethylene) glycol
PI - propidium iodide
PVP - polyvinylpyrrolidone
RE - recycling endosomes
Rho A - ras homolog gene family, member A
ROS - reactive oxygen species
SEM - standard error of the mean
SERS - Surface-Enhanced Raman Spectroscopy
TEM - transmission electron microscopy
U251 - human glioblastoma cells UV/VIS - Ultraviolet – visible
XTT - 2,3-bis-(2-methoxy-4-nitro-5-sulfophenyl)-2H-tetrazolium-5-carboxanilide WST-8 -
Chapter 1
Introduction
1.1. Nanomaterials – overview
The definition of nanomaterials (NMs) is far from being consensual. According to the European Commission, the adopted definition of NM is based only on size and covers different types of materials. Within this definition, NMs are natural, incidental or manufactured material containing particles, in an unbound state, as an aggregate or as an agglomerate and where, for 50 % or more of the particles in the number size distribution, one or more external dimensions is in the size range of 1 nm - 100 nm (European Commission, 2011).
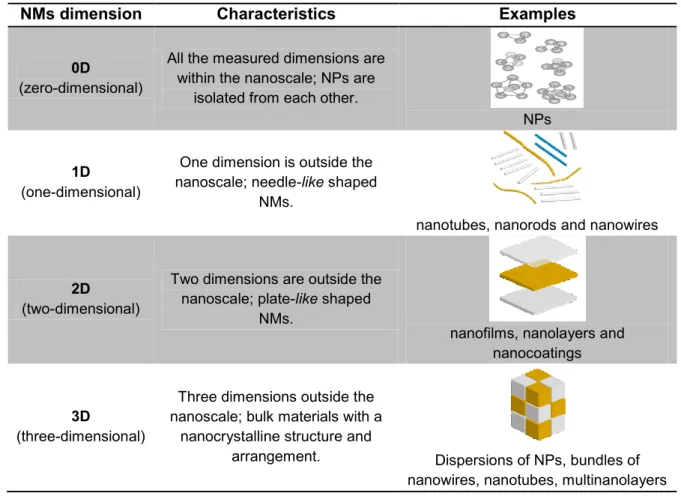
In order to better understand the diversity and complexity of the NMs it is essential to organize them into some form of categorization. Therefore, NMs can be classified according to their structure in amorphous or crystalline (Ashby et al., 2009). Furthermore, as described in Table 1, NMs can also be classified according to the dimension of their structural elements in zero-(0-D), one–(1-D), two–(2-D) and three-dimensional (3-D) (Siegel, 1994).
Table 1 - Main types of NMs based on the dimensions of their structural elements.
NMs dimension Characteristics Examples
0D
(zero-dimensional)
All the measured dimensions are within the nanoscale; NPs are
isolated from each other.
NPs
1D
(one-dimensional)
One dimension is outside the nanoscale; needle-like shaped
NMs.
nanotubes, nanorods and nanowires
2D
(two-dimensional)
Two dimensions are outside the nanoscale; plate-like shaped
NMs.
nanofilms, nanolayers and nanocoatings
3D
(three-dimensional)
Three dimensions outside the nanoscale; bulk materials with a
nanocrystalline structure and
arrangement. Dispersions of NPs, bundles of nanowires, nanotubes, multinanolayers
According to their chemical nature, NMs may also be categorized as organic or inorganic(Peralta-Videa et al., 2011). Among the organic are the carbon-based NMs that include fullerenes, carbon nanotubes (CNTs) and nanofibers. However, organic NPs can also be originated from organic polymers or even be biologically inspired, in which a biological substance is encapsulated, trapped or adsorbed, namely lipids, peptides or polysaccharides. On the other hand, quantum dots (CdSe), metals (Ag, Au), metal oxides (TiO2, ZnO, MgO and Fe3O4) or ceramics (SiO2) fall into the category of inorganic NMs. Organic NMs are often considered “soft” materials, whether inorganic materials are considered to be “hard” materials (Elsaesser and Howard, 2012).
1.2. Properties and applications
Decreasing particle size from bulk to nanoscale alters the physicochemical properties (optical, magnetic, electrical and catalytic) of the materials, metallic nanoparticles included, by increasing the number of surface atoms and energy, and consequently reactivity, thus providing the attractive possibility of application of these materials in many fields (Faramarzi and Sadighi, 2013). Over the past years, the development of new methods for synthesis and modification of metallic NPs allowed the rapid evolution of the nanotechnology world. These new methods of synthesis originated NPs with different physicochemical properties that can potentially lead to distinct biological and toxicological responses.
Shape is also a characteristic that can influence the physicochemical properties and applications of the NMs in general, including gold (AuNPs) and silver (AgNPs) nanoparticles. Owing to their shape along with the possibility of surface modification, Au and Ag nanorods have potential for biomedical applications such as drug delivery, photothermal therapy, chemical sensing and biological imaging (Alkilany et al., 2012, Gao et al., 2012). On the other hand, nanoplates due to their sharp edges can produce high electric field gradients combined with illumination, which is useful for optical biosensors and Surface-Enhanced Raman Spectroscopy (SERS) (Sun and Wiederrecht, 2007, Grzelczak et al., 2008). Au and Ag nanostars due to their unique shape possess optical properties that are useful for biomedical applications such as tumor imaging using SERS (Khoury and Vo-Dinh, 2008, Garcia-Leis et al., 2013).
Surface modification and/or bio-functionalization of these metallic NPs is expected to contribute for nanotechnology advancement, namely for implementation of these materials in the food industry and biomedical field (Kim et al., 2013).
Due to the bioinert nature of the bulk gold (Au), ease of synthesis and stability, AuNPs have been regarded as good candidates to be used in medicine and other biological applications (Balansky et al., 2013). Regarding AgNPs, their enhanced plasmonic properties have proven useful for SERS applications, making them a sensitive tool to trace single molecules (Ravindran et al., 2013).
Gold nanoparticles have been used since ancient times to produce the red color in the medieval stained windows glass and ceramic objects. Recently, AuNPs have become the center of attention not only due to their potential for biomedical application in the diagnostics and therapeutics of a number of diseases including cancer, Alzheimer’s disease, hepatitis, arthritis and diabetes (Balansky et al., 2013) but also in the industry as a catalyst in a number of chemical reactions (Corma and Garcia, 2008) or even in the cosmetics field as a facial mask component to improve blood circulation and skin elasticity (Fathi-Azarbayjani et al., 2010).
In the first half of the 20th century, silver (Ag) was largely used in order to prevent
infections. However, its use was often associated with argyria, a condition caused by excessive exposure and gradual accumulation of Ag compounds in various parts of the body that may cause spasms, and ultimately death. Around that time, the topical used of silver nitrate (AgNO3) was indicated for the therapy of eye infections in newborns but it
was believed that consumption of large doses would lead to corneal damage (Chernousova and Epple, 2013).
Recently due to its enhanced physicochemical and biological properties compared to the bulk silver, interest in the application of Ag in the nanoparticulate form has peaked (Tolaymat et al., 2010).
Currently, it is estimated that of all the NMs used in consumer products, AgNPs have the highest degree of commercialization (Ahamed et al., 2010). In cosmetics, AgNPs are being applied as an active ingredient for physical UV shielding, skin whitening, hair and dental care and as antibactericidal agent (Mihranyan et al., 2012). In fact, the antimicrobial properties of the AgNPs have been successfully explored for biomedical purposes (Bystrzejewska-Piotrowska et al., 2009). At present, AgNPs are constituents of catheters, implant surfaces or dental alloys and are expected to be employed in cancer and retinal therapy (Dziendzikowska et al., 2012). Interestingly, it has been reported that AgNPs could interact with HIV-1 virus inhibiting its capacity to bind to host cells in vitro (Elechiguerra et al., 2005).
Nanotechnology is also expected to greatly benefit the food and feed sector. The NPs are being applied for sensory improvement (e.g. flavor enhancement), specific and accurate delivery/targeting of bioactive compounds and nutrients, stabilization of active ingredients, packaging and product innovation to extend shelf-life, improvement of food safety and antimicrobial action to kill pathogens in food, decreasing health risks. Nevertheless, a recent report from the Food Safety Authority of Ireland stated that only a small number of products have been commercialized (I. Pratt, 2008). Still, the value of nanotechnology in the food market may have reached 19.4 million euros in 2010 and 740 billion euros in 2013.
While organic NPs are essentially used to alter the normal structure of biocompounds or food additives to improve or create new properties, inorganic NPs such as AuNPs and AgNPs, are mainly used for the preservation of prepared foods. These NPs are included in food containers, food contact materials, food supplements or food additives.
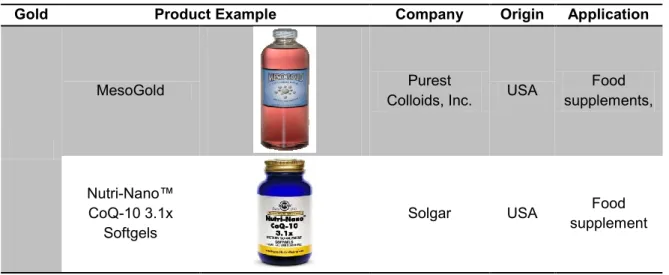
In Table 2 and 3 are presented some products currently available on the market containing AuNPs and AgNPs in their composition, respectively.
Table 2 - Products on the market containing gold nanoparticles in their composition.
Gold Product Example Company Origin Application
MesoGold Purest
Colloids, Inc. USA
Food supplements,
Nutri-Nano™ CoQ-10 3.1x
Softgels
Solgar USA Food
Table 3 - Products on the market containing silver nanoparticles in their composition.
Silver Product Example Company Origin Application
MesoSilver Purest Colloids,
Inc. USA
Food supplements
Silver-22TM RBC Life
Sciences®, Inc. USA
Antimicrobial protection,
food supplements
SilverBiotics American Biotech
Labs USA
Food supplement
Colloidal silver Fairvital Germany Food
supplement Sovereign Silver™ Natural-Immunogenics Corp. USA Food supplement MARATHON Household Water Purifiers (Model : silverdyn type)
Katadyn Asia Inc. Korea filtration Water
Nano Silver Baby Mug Cup Baby Dream® Co., Ltd. Korea Antimicrobial protection BlueMoonGoods™ Fresh Box Silver Nanoparticle Food Storage Containers BlueMoonGoods, LLC USA Antimicrobial protection, storage material Nano Silver NS-315
Water Bottle A-DO Global Korea
Antimicrobial protection, storage Nano-Silver Cutting Board Pro-Idee GmbH
& Co. KG Germany
Antimicrobial protection,
1.3. Interactions of metallic nanoparticles with biological
systems
Owing to their interactions with the biological systems, NPs can acquire a surface corona mainly constituted of biomolecules such as lipids and proteins, that will influence their behavior and effects (Fadeel et al., 2013). Thus, it has been recently proposed that interactions of engineered NPs with cells or tissues, and subsequent effects, are a combination of material-intrinsic and context-dependent properties determined, in part, by the bio-corona of a given biological compartment (Elsaesser and Howard, 2012). Therefore, identifying and characterizing the nature of these interactions will provide a conceptual basis for the rational design and safe use of these NPs in biology and medicine (Zhang et al., 2012).
1.3.1. Influence of the physicochemical properties of gold and silver
nanoparticles in the cellular uptake
The physicochemical properties play a major role on NPs interactions with the biological systems (Zhang et al., 2012). Shape, size and surface chemistry have been found to greatly influence NP uptake and cellular toxicity (Nel et al., 2009).
The size and surface characteristics are key points for the process of opsonization (i.e. binding of opsonins on the surface of NPs, promoting phagocyte recognition) and clearance of NPs. Differential opsonization might explain different clearance rates and macrophage sequestration of NPs (Arora et al., 2012). The suppression of these opsonization processes at desired sites or anatomical compartments can increase the passive retention of NPs in bloodstream. For that purpose, surface coating with poly(ethylene) glycol (PEG) has been found to effectively increase the systemic circulation time of hydrophobic NPs (Arora et al., 2012). Also, the contact of NPs with biological fluids and consequent formation of a protein corona can modify the NPs properties (shape, surface charge, aggregation status),and thus influence NP uptake into the cells and performance in the organism (i.e. biodistribution and cell/organ specificity) (Zhang et al., 2012).
In phagocytic cells, NPs can be internalized by passive penetration or phagocytosis/macropinocytosis, two specific forms of endocytosis, involving actin polymerization. In non-phagocytic cells, NPs are internalized by endocytosis,
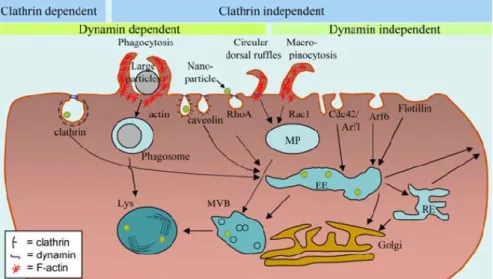
2014). While most studies focused on NP uptake in non-polarized cells, the complexity of internalization in polarized cells is now being studied, namely, the uptake differences between the apical (clathrin–mediated endocytosis) and basolateral (caveolae–mediated endocytosis) domains(Iversen et al., 2011). Recently, new mechanisms of clathrin– independent endocytosis have been reported and are described in Figure 1.
Figure 1 - Illustrative image of endocytic pathways and intracellular interactions. The green dots are the representation of the nanoparticles or other coumpounds capable of being uptaken by endocytosis.Arf6 dependent (ADP-ribosylation factor 6) is implicated in endocytosis of plasma membrane proteins, caveolin – caveolae/lipid raft dependent leads to a local change in the morphology of the membrane, Cdc42 dependent (cell division control protein 42 homolog) - regulates signaling pathways that control cell morphology, migration, endocytosis and cell cycle progression, EE – endosomes, MP – macropinosomes, MVB – multivesicular bodies/late endosomes, Lys – lysosomes, RE – recycling endosomes, RhoA (ras homolog gene family, member A) - actson the reorganization of the actin cytoskeleton of the cell, - From (Iversen et al., 2011).
NPs can cause disturbances in the plasma membrane structure (Verma and Stellacci, 2010), through interactions with membrane proteins, ion channels, cytoskeleton, and thus can interfere with cellular functions such as molecular transport and signal transduction (Wu et al., 2012).
In spite of the increasing number of studies regarding NPs uptake, the knowledge of cellular uptake of NPs is far from being completely understood due to the complexity and variety of mechanisms involved, making it difficult to extrapolate between in vitro and
in vivo (Iversen et al., 2011).
1.3.1.1. Gold nanoparticles
Chithrani and Chan, have evaluated the role of size (14, 50 and 74 nm) on the uptake of AuNPs in an immortalized cervical cancer (HeLa) cell line. These authors have
found that saturation kinetics varied among differently sized AuNPs, being the 50 nm the most efficiently internalized, indicating there might exist an optimal size for efficient AuNPs uptake into cells (Chithrani and Chan, 2007). In the same study, the effect of shape on AuNPs internalization was also evaluated. The results indicated that spherical-shaped AuNPs seem to be more easily internalized comparing with rod-shaped particles, which might be explained by greater membrane wrapping time required for elongated particles (Chithrani and Chan, 2007).
The surface chemistry significantly contributes to NPs interactions with cells since the surface functional groups are primary dictators of many important NP properties such as solubility and cell surface (Verma and Stellacci, 2010). Cho et al., investigated the influence of the surface coating on the AuNPs uptake in the breast cancer cell line (SK-BR-3). Three differently coated [PEG, anti-human epidermal growth factor receptor–2 (HER2) and poly(allyamine hydrochloride) (PAA)] AuNPs were studied. The tested surface coatings conferred different surface charges to the AuNPs. While PEG-, anti-HER2-coated AuNPs were neutral/negatively charged, PAA-AuNPs were positively charged. The authors concluded that positively charged NPs easily bind to the cell surface comparing with neutral or negatively charged NPs, resulting in a more effective translocation across the plasma membrane (Cho et al., 2010). These results are representative of the importance of surface modification towards the efficiency of AuNPs uptake.
Kim et al. have also investigated the influence of surface charge on membrane integrity/perturbation of ovarian cancer cells (CP70 and A2780), human bronchial epithelial cells (BECs), and human airway smooth muscle cells (ASM). These authors have tested four types of AuNPs (cationic, anionic, zwitterionic1 and neutral) and demonstrated that positively charged NPs could depolarize the membrane potential leading to lipid bilayer disruption and loss of membrane integrity. The authors also found that positively charged NPs increased the intracellular levels of Ca2+, which combined with
alterations of the membrane potential and integrity induced cytotoxicity (Kim et al., 2013). The cytoskeleton is an important piece for cellular mechanical stability, integrity, trafficking and migration (Wu et al., 2012). Exposure of human lung carcinoma cells (A549) to AuNPs has proven to induce changes in the cytoskeleton arrangement and alterations in cellular morphology (Pernodet et al., 2006). In addition, AuNPs have also been reported to induce cell death after 48 h of exposure, in a concentration-dependent manner, by acting on the actin fibrils of human dermal fibroblasts (Patra et al., 2007).
1.3.1.2. Silver nanoparticles
Available literature supports that AgNPs could be easily internalized by cells. In a study on human epidermal keratinocyte cells (HEK) incubated with differently sized and coated AgNPs (20 and 110 nm citrate-coated and40 and 120 nm silica-coated), the authors evaluated the effect of pre-exposure to human proteins (albumin, IgG and transferrin) to create a protein-NP corona, in the AgNPs uptake into the cells(Monteiro-Riviere et al., 2013). The results showed that there was a significant change in the cellular uptake of all NPs studied. The difference of the cellular uptake of citrated-coated AgNPs was essentially related to the size of the NP, since for 20 nm citrate-coated NPs a reduction of intracellular concentration was observed after pre-exposure of albumin and IgG, while for 110 nm this reduction was observed exclusively after the pre-exposure of IgG. The opposite conclusion was obtained for the silica-coated AgNPs The greatest uptake of IgG during the experience was observed upon exposure with 20 nm silica-coated AgNPs. However, the authors emphasized the need for additional studies to prove this data (Monteiro-Riviere et al., 2013).
Greulich et al. evaluated the uptake of polyvinylpyrrolidone (PVP)-coated AgNPs on human mesenchymal stem cells (hMSC), in particular the mechanism/pathways involved in NPs endocytosis. Based on combined focused ion beam/scanning electron microscopy (FIB/SEM) experiments, energy-dispersive X-ray (EDX) analysis and flow cytometry, the authors showed that NPs were internalized by macropinocytosis and clathrin-dependent endocytosis (Greulich et al., 2011).
Singh et al. also investigated the uptake of 43.9 nm AgNPs in a mouse leukaemic monocyte macrophage cell line (RAW 264.7). The authors used confocal microscopy to monitor the uptake of AgNPs labeled with a fluorescein derivative (DTAF) and found that the NPs were efficiently transported during the 3 h of experiment (Singh and Ramarao, 2012).
1.3.2. The interaction of metallic nanoparticles with the cellular
organelles
After cellular internalization, NPs can be transported to intracellular organelles such as lysosomes, mitochondria and nucleus.
Lysosomes are organelles whose function involves the digestion of waste materials and cellular debris. Endo-lysosomal pathways and autophagy are emerging mechanisms to capture and degrade NPs internalized by cells. However, recent studies showed that NPs have a negative impact on these mechanisms. NPs can induce lysosomal oxidative stress affecting lysosomal stability and promoting lysosomal
dysfunction. Lysosomal membrane permeabilization, a consequence of lysosomal dysfunction, can lead to mitochondrial permeabilization, which can induce the ROS production and ultimately cell apoptosis (Stern et al., 2012).
Mitochondria targeting by NPs, either directly or indirectly, remains an open discussion. However, it is known that NP-induced disturbance of this organelle has biological effects that can be translated into toxicity. The primary role of mitochondria is the production of ATP, still, mitochondria has also key roles in other metabolic tasks such as signaling through mitochondrial-derived reactive oxygen species (ROS) (Li et al., 2013), programmed cell death (Green, 1998), calcium signaling (Hajnóczky et al., 2006) and regulation of cellular metabolism (McBride et al., 2006). Damage of mitochondrial function induced by NPs can decrease the mitochondrial membrane potential, increase ROS production and cause depletion of GSH. Studies regarding AuNPs and AgNPs interactions with mitochondria have already been performed. Exposure for 48 h to 1.4 nm AuNPs was found to induce oxidative stress, which associated with protein and lipid oxidation led to mitochondrial damage in HeLa cells (Pan et al., 2009). On the other hand, Wistar rat liver mitochondria exposure to 40 and 80 nm AgNPs led to a reduction of mitochondrial function associated with a decrease of mitochondrial membrane potential and ADP-induced depolarization.
Finally, NPs can also interact with the cell nucleus. Given their small size, charge and surface area, NPs can also enter the nucleus and induce DNA damage. DNA damage can be produced either by direct interaction between the DNA and the NPs, which can result in mutations or hinder the chromosomal DNA replication , or indirectly through ROS production or release of toxic ions from soluble NPs (Wu et al., 2012).
1.3.3. Toxicity of metallic nanoparticles
The knowledge of the mechanisms involved in the cellular uptake of metallic NPs and interaction with intracellular organelles can lead to a better understanding of the toxicity induced by metallic NPs.
The mechanisms involved in the toxicity of NPs can be either of chemical or physical nature. Among the chemical mechanisms are the production of ROS, dissolution and release of toxic ions, disturbance of the activity of electron/ion cell membrane transport and lipid peroxidation (Kamat et al., 2000, Foley et al., 2002, Nel et al., 2006, Xia et al., 2008). On the other hand, disruption of membranes affecting transport and trafficking processes, alterations of protein conformation/folding and protein
As previously mentioned, NPs might also induce genotoxicity through direct or indirect mechanisms (Dusinska et al., 2013). NPs can reach the cell nucleus and bind to DNA, affecting replication of chromosomal DNA or causing mutations (Wu et al., 2012). In addition, some NPs are known to cause DNA damage by increasing oxidative stress and inflammatory responses (Meng et al., 2009). NP-induced DNA damage often leads to activation of the cytoplasmic protein p53 (Ng et al., 2011). In ROS-mediated DNA damage, an increased expression of antioxidant genes has been observed, which can culminate in cell death (apoptosis or necrosis) if the DNA damage exceeds the reparable limits (Sablina et al., 2005, Ng et al., 2011).
1.3.3.1. Gold nanoparticles
As previously mentioned, AuNPs were initially considered non-toxic due to the bioinert character of the bulk Au. In spite of the large number of studies conducted so far to assess their safety, toxicity of AuNPs is still controversial. While some studies demonstrated the biocompatibility of AuNPs, others have reported the existence of toxicity events associated with AuNPs exposure. Khlebtsov and Dykman hypothesized that contradictory data on AuNPs toxicity may arise from the experimental design, namely differences in the particle size, shape, and surface chemistry, animal and cellular models used, tested doses and administration routes (Khlebtsov and Dykman, 2011).
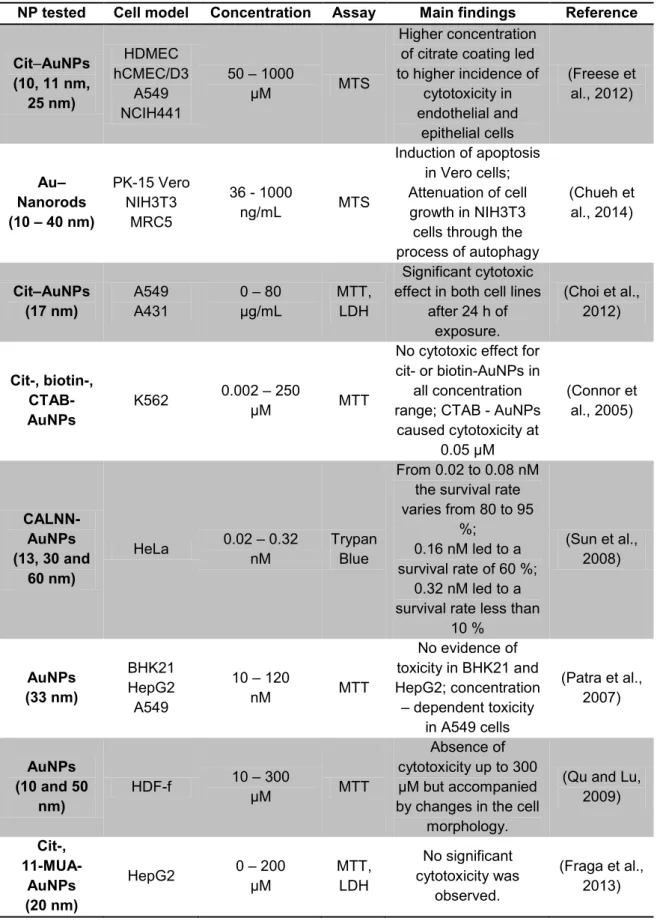
In Table 4 are summarized some studies regarding the cytotoxic effects of AuNPs. The physicochemical properties of the NPs, adopted cell model, type of assay and tested concentrations, as well as the main findings are described.
Different cell models may exhibit different sensitivity to AuNPs. This fact may also account for the discrepancy in AuNPs cytotoxicity data found in literature and is reflected in Table 4. Indeed, Patra et al. demonstrated that AuNPs induced a concentration-dependent toxicity response in A549 cells but not in baby hamster kidney (BHK21) or in liver hepatocellular carcinoma (HepG2) cells (Patra et al., 2007).
Another interesting finding is that surface modification also influences the toxicological potential of the AuNPs. As demonstrated by Connor et al, a high concentration of citrate coating resulted in higher levels of toxicity (Connor et al., 2005). In addition, Freese et al reported that CTAB-AuNPs but not Cit-and biotin-AuNPs produced toxicity in human myelogenous leukemia (K562) cells (Freese et al., 2012).
Table 4 – Summary of some in vitro studies on the cytotoxicity of gold nanoparticles.
NP tested Cell model Concentration Assay Main findings Reference
Cit–AuNPs (10, 11 nm, 25 nm) HDMEC hCMEC/D3 A549 NCIH441 50 – 1000 μM MTS Higher concentration of citrate coating led to higher incidence of cytotoxicity in endothelial and epithelial cells (Freese et al., 2012) Au– Nanorods (10 – 40 nm) PK-15 Vero NIH3T3 MRC5 36 - 1000 ng/mL MTS Induction of apoptosis in Vero cells; Attenuation of cell growth in NIH3T3 cells through the process of autophagy (Chueh et al., 2014) Cit–AuNPs (17 nm) A549 A431 0 – 80 μg/mL MTT, LDH Significant cytotoxic effect in both cell lines
after 24 h of exposure. (Choi et al., 2012) Cit-, biotin-, CTAB- AuNPs K562 0.002 – 250 μM MTT
No cytotoxic effect for cit- or biotin-AuNPs in
all concentration range; CTAB - AuNPs
caused cytotoxicity at 0.05 μM (Connor et al., 2005) CALNN-AuNPs (13, 30 and 60 nm) HeLa 0.02 – 0.32 nM Trypan Blue From 0.02 to 0.08 nM the survival rate varies from 80 to 95
%; 0.16 nM led to a survival rate of 60 %;
0.32 nM led to a survival rate less than
10 % (Sun et al., 2008) AuNPs (33 nm) BHK21 HepG2 A549 10 – 120 nM MTT No evidence of toxicity in BHK21 and HepG2; concentration – dependent toxicity in A549 cells (Patra et al., 2007) AuNPs (10 and 50 nm) HDF-f 10 – 300 μM MTT Absence of cytotoxicity up to 300 μM but accompanied by changes in the cell
morphology.
(Qu and Lu, 2009) Cit-, 11-MUA- AuNPs (20 nm) HepG2 0 – 200 μM MTT, LDH No significant cytotoxicity was observed. (Fraga et al., 2013)
Note: 11-MUA: 11-mercaptoundecanoic acid, Cit: Citrate, CALNN: a pentapeptide ligand (Cys-Ala-Leu-Asn-Asn), CTAB: Cetyl trimethylammonium bromide, MTT - 3-(4,5-dimethylthiazol-2-yl)-2,5-diphenyltetrazolium bromide, LDH - lactate
Several studies have proven that NPs may induce genotoxicity, i.e. DNA damage, even in the absence of clear cytotoxic effects. The comet assay is one of the most frequently used tests to assess DNA damage induced by chemical agents. A recent review on the subject reported DNA strand breaks or DNA lesions resulting from exposure to NMs including metal-based NPs (Karlsson, 2010) According to this author, this assay may provide useful information for hazard identification of NMs.
Regarding AuNPs, it has been shown that can induce DNA damage caused by a concentration-dependent oxidative stress(Singh et al., 2009). However, Nelson et al. have demonstrated that different-sized (10, 30 and 60 nm) National Institute of Standards and Technology (NIST) AuNPs reference materials did not cause DNA damage both in HepG2 cells and calf-thymus DNA exposed for 24 h. Furthermore, no significant increase in ROS production was observed (Nelson et al., 2013).
In Table 5 is presented a brief summary of some studies regarding the genotoxic effect of AuNPs.
Table 5 - Summary of some in vitro studies on the genotoxicity of gold nanoparticles.
NP tested Cell
model Concentration Assay Main findings Reference
Cit-, PAMAM-AuNPs PBMC, HepG2 1 and 50 μM Comet assay
Evidence of DNA damage induced by both tested
NPs (Paino et al., 2012) Glycolipid-AuNPs HepG2 0.0005 - 50 μg/mL Comet assay No genotoxic effect observed (Singh et al., 2010) Cationic AuNPs HeLa 100 – 165 nM Comet assay Increase of NP hydrophobicity led a decrease of DNA damage. High levels of
ROS were found
(Chompoosor et al., 2010) Cit-, 11-MUA- AuNPs (20 nm) HepG2 0.1 - 100 μM Comet assay
Evidence of DNA damage on the citrate-AuNPs exposed cells, but not on 11- MUA - AuNPs treated
cells; inverse concentration-dependent genotoxic effect (Fraga et al., 2013) AuNPs (15 nm) HeLa 20 μg/mL Comet assay
DNA damage and apoptosis (Jeyaraj et al., 2014) AuNPs (8 nm) MonoMac 6, NR8383 3.2 – 10.2 μg/cm2 Alkaline comet assay
Positive results; DNA damage
(Grigg et al., 2009)
Surface chemistry has also an important role in NMs DNA damaging potential. Fraga et al reported that 20 nm Cit-AuNPs but not MUA-AuNPs induced DNA damage in HepG2 cells at 24h of exposure. Interestingly, the DNA damaging effect of Cit-AuNPs followed an inverse concentration-dependent trend (Fraga et al., 2013).
As previously stated, ROS are a major source of DNA damage. Still, an interesting yet confusing finding contradicts, somewhat, this premise. Chompoosor et al. have investigated the genotoxic effect of AuNPs coated with alkyls with different tail chain lengths on HeLa cells. The obtained data indicated that increasing of NP hydrophobicity produced an increase in ROS production accompanied by a decrease in DNA damage. The authors suggested that oxidative environment could activate the process of autophagy, thus explaining the observed decrease in the DNA damage (Chompoosor et al., 2010).
1.3.3.2. Silver nanoparticles
Toxicological studies on AgNPs have also been conducted. Mechanistic studies have shown that exposure to AgNPs is associated with the generation of ROS, DNA damage, lipid peroxidation that often lead to cytotoxicity, and ultimately cell death (de Lima et al., 2012). As observed for other types of NMs, the physicochemical properties of the AgNPs influence their toxicological potential (de Lima et al., 2012). Also, the AgNPs are very prone to dissolve and release Ag+ ions. This Ag ion release can be controlled by
NP surface modification with polymers or biomolecules (Kittler et al., 2010), that can also influence NPs toxicity.
Several studies have investigated whether the toxicity induced by the AgNPs was caused by the NPs themselves orby the released Ag+ ions (Beer et al., 2012). Furthermore, an Ag salt, usually AgNO3, is often tested to compare the Ag effects
between bulk and nanoscale.
In Table 6 are represented some studies on the cytotoxicity of AgNPs. Piao et al. observed higher NPs induced-toxicity compared to AgNO3 (Piao et al., 2011). On the other
hand, Beer et al. have found that toxicity of the AgNPs was dependent of the amount of Ag ions in the solution (Beer et al., 2012).
In some of the studies, the response of the cells to AgNPs was found to be concentration-dependent (Arora et al., 2009, Kaur and Tikoo, 2013).
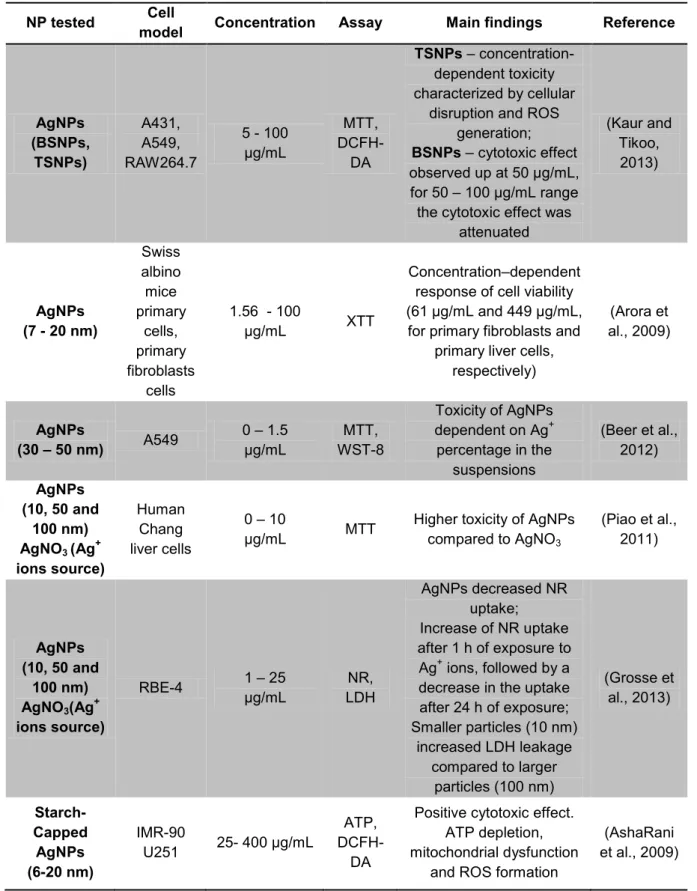
Table 6 - Summary of recent in vitro studies on the cytotoxicity of silver nanoparticles.
NP tested Cell
model Concentration Assay Main findings Reference
AgNPs (BSNPs, TSNPs) A431, A549, RAW264.7 5 - 100 µg/mL MTT, DCFH-DA TSNPs – concentration-dependent toxicity characterized by cellular
disruption and ROS generation;
BSNPs – cytotoxic effect
observed up at 50 µg/mL, for 50 – 100 µg/mL range the cytotoxic effect was
attenuated (Kaur and Tikoo, 2013) AgNPs (7 - 20 nm) Swiss albino mice primary cells, primary fibroblasts cells 1.56 - 100 µg/mL XTT Concentration–dependent response of cell viability (61 µg/mL and 449 µg/mL,
for primary fibroblasts and primary liver cells,
respectively) (Arora et al., 2009) AgNPs (30 – 50 nm) A549 0 – 1.5 µg/mL MTT, WST-8 Toxicity of AgNPs dependent on Ag+ percentage in the suspensions (Beer et al., 2012) AgNPs (10, 50 and 100 nm) AgNO3 (Ag+ ions source) Human Chang liver cells 0 – 10 µg/mL MTT
Higher toxicity of AgNPs compared to AgNO3 (Piao et al., 2011) AgNPs (10, 50 and 100 nm) AgNO3(Ag+ ions source) RBE-4 1 – 25 µg/mL NR, LDH AgNPs decreased NR uptake; Increase of NR uptake after 1 h of exposure to Ag+ ions, followed by a
decrease in the uptake after 24 h of exposure; Smaller particles (10 nm) increased LDH leakage compared to larger particles (100 nm) (Grosse et al., 2013) Starch-Capped AgNPs (6-20 nm) IMR-90 U251 25- 400 µg/mL ATP, DCFH-DA
Positive cytotoxic effect. ATP depletion, mitochondrial dysfunction
and ROS formation
(AshaRani et al., 2009)
Note: TSNPs - AgNPs synthesized by reduction with tannic acid (TSNPs), BSNPs – AgNPs synthesized with sodium borohydride, NR – neutral red assay, MTT - 3-(4,5-dimethylthiazol-2-yl)-2,5-diphenyltetrazolium bromide, WST – 8 - (2-(2-methoxy-4-nitrophenyl)-3-(4-nitrophenyl)-5-(2,4-disulfophenyl)-2H-tetrazolium), XTT - (2,3-bis-(2-methoxy-4-nitro-5-sulfophenyl)-2H-tetrazolium-5-carboxanilide), LDH - lactate dehydrogenase, DCFH-DA - Dichloro-dihydro-fluorescein diacetate.
Nevertheless, Bohmert et al. reported that increased ROS production and cytotoxic effects in human epithelial colorectal adenocarcinoma (Caco-2) cells, following exposure to differently sized (20 and 40 nm) peptide-coated (Cys-Lys-Lys) AgNPs, were concentration-, time- and particle size-independent (Bohmert et al., 2012). AshaRani et al. showed that AgNPs interaction with normal human lung fibroblast cells (IMR-90) and human glioblastoma cells (U251) induced cytotoxicity through ATP depletion, mitochondrial dysfunction and ROS formation (AshaRani et al., 2009).
Overall, AgNPs can induce cytotoxicity through the release of Ag+ ions into the
cellular environment or by themselves by interacting with intracellular components, promoting the formation of ROS, ultimately conducting to cell death.
Along with other types of NMs (metal-based, metal oxide-based, QDs, fullerenes and CNTs), AgNPs can also induce genotoxicity through their interaction of DNA and ROS or free radicals formed upon cell uptake (Elsaesser and Howard, 2012, Roy et al., 2014).
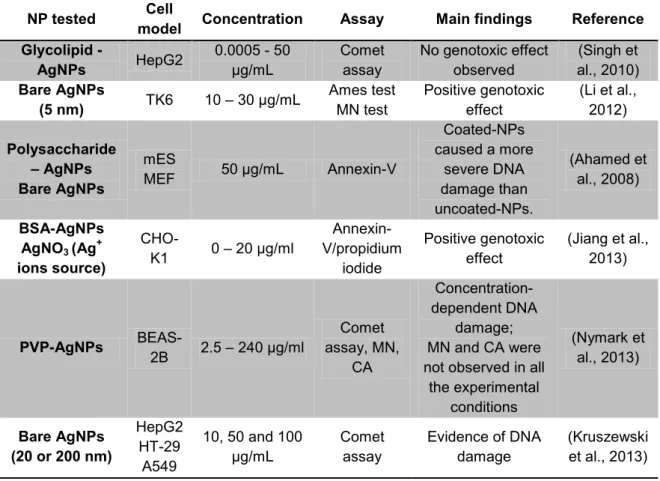
In Table 7 includes some in vitro studies conducted to assess AgNPs genotoxicity.
Table 7 - Summary of some in vitro studies on the genotoxicity of silver nanoparticles.
NP tested Cell
model Concentration Assay Main findings Reference
Glycolipid - AgNPs HepG2 0.0005 - 50 μg/mL Comet assay No genotoxic effect observed (Singh et al., 2010) Bare AgNPs (5 nm) TK6 10 – 30 μg/mL Ames test MN test Positive genotoxic effect (Li et al., 2012) Polysaccharide – AgNPs Bare AgNPs mES MEF 50 μg/mL Annexin-V Coated-NPs caused a more severe DNA damage than uncoated-NPs. (Ahamed et al., 2008) BSA-AgNPs AgNO3 (Ag+ ions source) CHO-K1 0 – 20 μg/ml Annexin-V/propidium iodide Positive genotoxic effect (Jiang et al., 2013) PVP-AgNPs BEAS- 2B 2.5 – 240 μg/ml Comet assay, MN, CA Concentration-dependent DNA damage; MN and CA were not observed in all
the experimental conditions (Nymark et al., 2013) Bare AgNPs (20 or 200 nm) HepG2 HT-29 A549 10, 50 and 100 μg/mL Comet assay Evidence of DNA damage (Kruszewski et al., 2013)
Several studies showed contradiction regarding the role of the surface coating on the genotoxicity potential of AgNPs. Ahamed et al. reported that polysaccharide-coated AgNPs caused more DNA damage than uncoated NPs in mouse embryonic fibroblasts (Ahamed et al., 2008). However, this observation was contradicted by other studies. Singh et al. demonstrated that coated NPs had no genotoxic potential, while Li et al. study results showed a positive genotoxic effect in human lymphoblastoid (TK6) cells exposed to bare AgNPs (Li et al., 2012). Furthermore, concentration also influences the genotoxic effect of NPs. Nymark et al. showed that exposure to polyvinylpyrrolidone (PVP)–AgNPs for 4 and 24 h produced a concentration-dependent DNA damage in human bronchial epithelial cells (Nymark et al., 2013)
.
1.4. Cell cycle effects of AuNPs and AgNPs
1.4.1. Cell cycle- overview
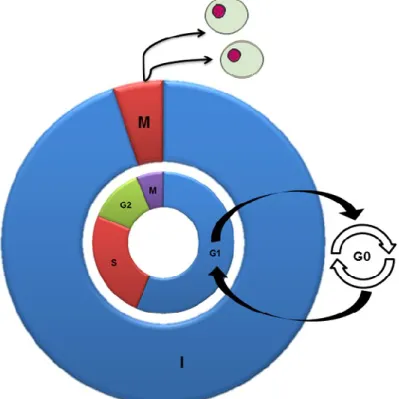
The cell cycle corresponds to a series of events that lead to cell division and duplication, as represented in Figure 2. This phenomenon is divided in two major periods: interphase and mitosis
.
Figure 2 - Schematic representation of the cell cycle. Outer circle: I - interphase, M - mitosis. Inner circle: G1 - gap 1, S - synthesis, G2 - gap 2, G0 - resting phase, M – mitosis.
Interphase, in which the cell spends most of its lifetime, is divided in three phases. Thus, the first gap phase, G1, is characterized by an increase of the cell size, due to the production of cellular components such as membranes, organelles and ribosomes. In the
synthesis or S phase, the replication of DNA occurs. In the second gap phase, G2, the cell
produces proteins and continues to grow. The period of mitosis, M, is characterized by cell division into two different cells which, in turn, enter the interphase period. After cell division, the cell can also stop dividing, and enter into a quiescent state, the G0 phase(Mahmoudi et al., 2011).
The two cell cycle checkpoints, G0/G1 and G2/M are determined by factors that control progression through the cell cycle, particularly the cyclin-cyclin-dependent kinases (CDKs) complexes. Upon activation of the complex cyclin-CDKs, the kinases initiate a biochemical reaction of phosphorylation, which may lead to the activation or inactivation of proteins that coordinates cell cycle progression.
At the beginning of the cell cycle, the G1 cyclin-CDKs complex is activated in order to prepare the cell to enter S phase, through the induction of transcription factors, which, in turn, allow the expression of S cyclins and enzymes essential to DNA replication. Phosphorylation of the active S cyclins creates the pre-replication complexes gathered during G1 phase, in order to ensure that all cell’s genome is replicated only once.
Mitotic cyclin-CDKs complexes, which remain inactive in G1 and S phases, induce the mitotic process through the stimulation of proteins that leads to chromosome condensation and the completion of mitotic spindle formation. After the completion of the spindle assembly checkpoint, M cyclins are destroyed during metaphase and anaphase, which causes the exit of mitosis and cytokinesis (Mahmoudi et al., 2011).
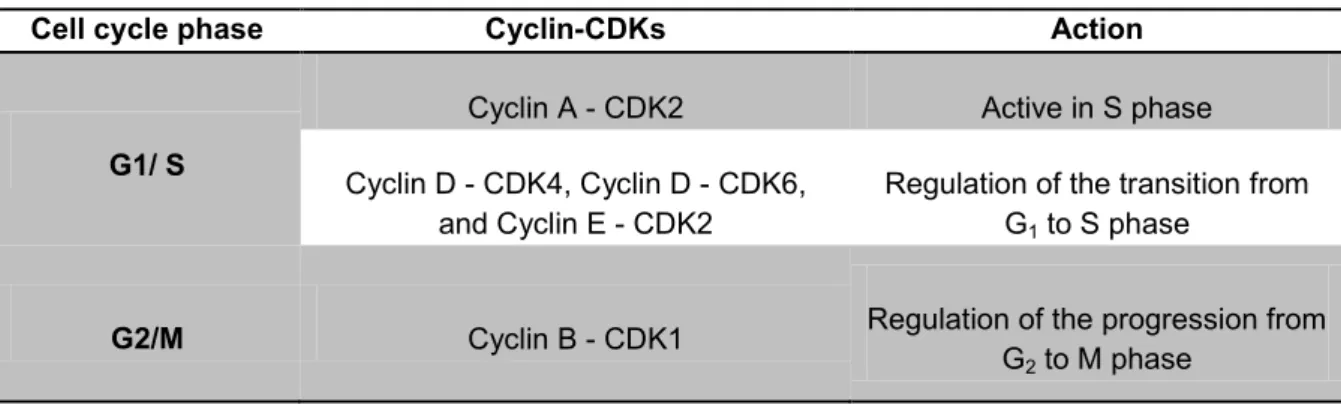
The specific cyclin-CDKs complexes involved in the cell cycle progression are represented in Table 8.
Table 8 - Cyclin and cyclin-dependent kinases (CDKs) involved in the cell cycle progression.
Cell cycle phase Cyclin-CDKs Action
G1/ S
Cyclin A - CDK2 Active in S phase
Cyclin D - CDK4, Cyclin D - CDK6, and Cyclin E - CDK2
Regulation of the transition from G1 to S phase
G2/M Cyclin B - CDK1 Regulation of the progression from
Cell cycle analysis can be performed by flow cytometry. This technique is based on the evaluation of the cell properties in a flow, after staining the cells with propidium iodide (PI), a nucleic acids-binding dye. In Figure 3 is represented a typical histogram of the cell cycle analysis by flow cytometry. The first peak of the histogram is related to the cells in the G0/G1 phase. The cells in G2/M phase are represented in the second peak of the histogram. The space between the peaks corresponds to the cells that are in the S phase. When is present, the sub-G1 area corresponds to cellular debris and late apoptotic and necrotic cells.
Figure 3 -Representative cell cycle histogram of Caco-2 cells analysed by flow cytometry.
1.4.2. Cell cycle behaviour in response to DNA damage
In a normal state, the cell behavior is regulated not only by cell genetic programing and cellular factors (size of the cell can dictate cell division), but also by a large spectrum of extra-cellular factors such as physicochemical nature of the medium involving the cells, interaction between cells and the extracellular matrix, expression of adhesion molecules, and the presence of growth factors in the involving medium.
The cells response to DNA damage may involve the activation of cell cycle checkpoint, initiation of DNA repair, and if the damage is irreversible, activation of the apoptotic process, which involves both p53 and E2F1 transcription factors. Indeed, Vousden and Lane., have shown that high levels of p53 resulted in irreversible apoptosis and low levels of p53 lead to transient growth arrest and cell survival (Vousden and Lane, 2007).
Thus, upon DNA damage, p53 is activated inhibiting E2F1 via p21 (Figure 4), resulting in the cell cycle arrest in the G1 phase. If the DNA damage is repairable, the cell will continue the cell cycle progression to the S phase and, mainly due to the activation of E2F1 and inactivation of p53. However, if the DNA damage is irreparable, both p53 and
E2F1 will be activated leading to the initiation of the apoptotic process. Zhang et al. demonstrated that E2F1 promoted apoptosis by the up-regulation of p53 pro-apoptotic cofactors (Zhang et al., 2010).
The ATM (ataxia telangiectasia mutated) and ATR (ATM and Rad3-related) protein kinases also play a key role in the progression of the cell cycle. This role is more prominent in the S phase and G2 phase checkpoints. The S phase regulation is characterized by the activation of Chk2 kinase by the ATM kinase, followed by the destabilization of Cdc25A, leading to the inactivation of the Cdk2/Cyclin E and Cdk2/Cyclin A complexes (S phase arrest).
G2 phase arrest is caused by the cyclin-dependent kinase CdC2 (or Cdk1) inactivation through the sequestration of the Cdc25A in the cytoplasm. This process causes the Cdc2/Cyclin B1 to remain inactive and thus blocking the mitotic process. The cell cycle checkpoints signaling pathways can be visualized in Figure 4.
Figure 4 - Diagram of cell cycle response triggered by DNA damage. ATM - ataxia telangiectasia mutated protein kinases, ATR - ATM and Rad3-related protein kinases, Cdc25A - cell division control 25A protein-coding gene, Cdk2 - cyclin-dependent kinase 2, Cdc2 - cell division control protein 2 homolog, Chk – checkpoint homolog kinases, p53 - tumor suppressor protein (From (Saidin, 2008).
1.4.3. Metallic nanoparticles and the cell cycle
evident by changes in the areas of the peaks corresponding to the different phases, resulting in the accumulation of cells in one or more phases of the cell cycle.
The rate of NPs uptake can also be influenced by the cell cycle phase. In this context, Kim et al. investigated the relationship between NP cellular uptake and cell cycle phase. The authors showed that as long as NPs are not extruded from the cell, they are passed onto the daughter cells. Thus, this process dilutes the concentration of the NPs inside the cell (Figure 5). The formation of protein-NP corona also varies during the cell cycle as the production of membrane proteins is different among phases (Kim et al., 2012).
Figure 5 - Role of the cell cycle in the cellular uptake of NPs. Nanoparticle uptake in a cycling cell. The yellow-green circles represent the nanoparticles, which, inside cells, accumulate in the lysosomes, represented by the oval compartment. When the cell divides, the internalized nanoparticles are split between the two daughter cells (From (Kim et al., 2012)).
1.4.3.1. Gold nanoparticles
Studies on the effects of AuNPs in the cell cycle are still scarce. However, it has already been reported that AuNPs can interfere in the cell cycle (Mahmoudi et al., 2011). Roa et al. demonstrated that exposure for 24h to glucose capped-AuNPs (Glu-AuNPs) accelerated the G0/G1 phase transition in human prostate cancer cells (DU-145) and resulted in the accumulation of cells in the G2/M phase (29.8%) comparing with control cells (18.4%)(Roa et al., 2009). Choi et al. have also evaluated the effect of serum protein coated AuNPs in the cell cycle of human lung carcinoma and human epidermoid carcinoma cell lines. The authors observed an increase in the sub-G1 population in the AuNPs-exposed cells compared to control cells, where most cells were in the G1 phase (Choi et al., 2012). Also, Chuang et al. performed an extensive evaluation of 10 nm x 45 nm Au nanorods in human lung adenocarcinoma epithelial (A549) and gastric adenocarcinoma (AGS) cells. They have demonstrated that in A549 cells, the tested Au-nanorods stimulated the accumulation in the G1 phase in a concentration-dependent manner and no cell death was observed after 24 h of exposure. However, the opposite findings were observed in AGS cells, incubation with the Au-nanorods for 24 h induced an