PUBLIC PARTICIPATION GEOGRAPHIC INFORMATION SYSTEMS
IN DEVELOPING COUNTRIES.
Pamella Drate
Lessons from Uganda on the impacts of interactive screens in
PPGIS and community perceptions of space.
PUBLIC PARTICIPATION GEOGRAPHIC INFORMATION
SYSTEMS IN DEVELOPING COUNTRIES.
Lessons from Uganda on the impacts of interactive screens in PPGIS
and community perceptions of space
Dissertation supervised by:
Professor Marco Painho, PhD
Instituto Superior de Estatística e Gestão de Informação Universidade NOVA de Lisboa,
Lisbon, Portugal
Dissertation co-supervised by:
Professor Christian Kray, PhD
Institute for Geoinformatics, University of Muenster,
Muenster, Germany
Professor Oscar Belmonte Fernández, PhD
Institute of New Imaging Technologies Universitat Jaume I,
Castellón, Spain
ACKNOWLEDGEMENT
I thank my Supervisor, Prof. Marco Painho for his support and guidance to obtain and research in this area of public participation, my co-supervisors, Prof Christian Kray and Prof Oscar BelmonteFernández. I would like to extend my gratitude to them for their tireless support, inspiration, feedback and sharing their knowledge throughout this thesis research period.
A special thank you goes out to Erasmus Mundus cooperation under European Commission, without the scholarship, I would not be able to attain this knowledge advancement.
I acknowledge the support from the council officials in Bugembe Town Council in provision of resources to enable me and my colleagues prepare the town council structure plan and later use it for my study in the workshop. I also thank all the participants for their time and efforts to make this happen.
I recognize my family, relatives and friends who continuously gave me the support I needed throughout my studies.
I thank my classmates with whom we lived as a family, thank you for the inspiration, strength, hope, guidance in those moments when I needed these the most and for walking this journey together.
PUBLIC PARTICIPATION GEOGRAPHIC INFORMATION
SYSTEMS IN DEVELOPING COUNTRIES.
Lessons from Uganda on the impacts of interactive screens in PPGIS
and community perceptions of space.
ABSTRACT
Town planning is highly a community initiative, if community efforts are sought-after in the most convenient approach, sustainable plans are produced. In this study, an interactive screen, pen and web 2.0 are used in an urban planning exercise to enhance public participation in Uganda. PPGIS applications are increasingly used in disciplines related to Geographic Information science in most parts of the world. However, developing countries with low technological advancements, experience only a glimpse of the GIS benefits.
The study is based on a combination of traditional methods and a web 2.0, this is inspired by studies done by Al-kodmany 2001. The web application is developed from open source software, firstly because the software is readily availability, secondly to create a simple interface that is more user friendly and meets the aim of improving participation levels. The method follows a traditional community meeting, where participants gather to make comments about a neighbourhood plan produced by Bugembe Town council. The plan from the web application, is projected on to a wall which is made sensitive to an interactive pen. The community maps their comments directly on the projection using the interactive pen. The comments are stored in a GIS database for the planner to retrieve and incorporate in the final plan. The usability assessments are done using questionnaires, recordings and physical checks. This is followed by engaging the communities in mapping landmarks in their areas, purposely, to understand their perceptions of space and representation of spatial features.
The results are overwhelming as the communities easily map their boundaries on the web application using the interactive screen; the application was tested by people from all walks of life. 74 percent of the participants appreciated the application and found it easy to use.
With the recommendations and wealth of information provided by the communities, the application will fetch enormous results in the field of public participation in Uganda, at the same time making the town planners work easier, improving accuracy levels of data capture and ease in data sharing.
KEY WORDS
Boundary Community Empowerment
Geographic Information systems Land uses
Public Participation Geographic Information Systems Public Participation Stakeholder spatial Technology Urban Planning Web 2.0
ACRONYMS
API- Application Programming Interface 3D – Three dimension
GI- Geographic Information
GIS- Geographic Information Systems GIS- Geographic Information Science GPS – Global Positioning System GT- Geo-spatial Technologies HTTP- Hyper Text Transfer Protocol
IAP2 – International association of public participation
NCGIA – National Centre for Geographic Information and Analysis PPGIS – Public Participation Geographic Information Systems SRID – Spatial Reference Identifier
UBOS – Uganda Bureau of Statistics WFS -Web Feature Services
WFS T -Web Feature Services Transaction WMS -Web Map Services
TABLE OF CONTENTS
ACKNOWLEDGEMENT...iii ABSTRACT...iv KEY WORDS...v ACRONYMS...vi INDEX OF TABLES...x INDEX OF FIGURES...xi 1. INTRODUCTION...1
1.1 PUBLIC PARTICIPATION AND URBAN PLANNING...1
1.2 Background...3
1.3 Problem Statement and Research Justification ...4
1.4 Study Objectives...6 1.5 Research Questions...7 1.6 Hypothesis...7 1.7 Scope...7 1.7.1 Geographic Scope...7 1.7.2 Project Scope...10
1.7.2.1 Developing a web 2.0 platform...10
1.7.2.2 Evaluation of the web 2.0 platform...11
1.7.2.3 Usability assessments ...11
1.7.2.4 Community perceptions of space...12
1.8 Thesis structure...12
2. RELATED STUDIES...15
2.1 INTERACTIVE PUBLIC PARTICIPATION, URBAN PLANNING AND COMMUNITY PERCEPTIONS OF SPACE...15
2.2 Public Participation...15
2.3 Interactive Public Participation...16
2.4 Traditional GIS...17
2.5 GIS and the Internet...17
2.6 The web 2.0 ...18
2.7 Low Technology or High Technology...19
2.8 Interactive Public Participation in Practice...20
2.9 Interactive Public Participation in Practice in Africa...23
2. 10 Urban Planning ...24
2.11 Community Perceptions Of Space...26
3. METHODOLOGY...28
3.2 Research Design...29 3.3 Data Preparation ...29 3.3. 1 Data Transformation...30 3.4 Functional Design...30 3.5 Technology Requirements...32 3.5.1 Server...32 3.5.2 Map visualization...32 3.5.3 Editing tools...33 3.5.4 Data base ...33 3.5.5 System design...33 3.6 Implementation ...34 3.6.1 Development environment ...34 3.6.1.1 Data base...34
3.6.1.2 Publish the data in the Geo server...35
3.6.1.3 Web application ...35
3.6.1.4 Retrieval of results...36
3.7 Application Testing and Evaluation Workshops...36
3.8 Rationale of the Methodology ...37
4. RESULTS...39
4.1 WORKSHOP RESULTS...39
4.1.1 Web Application and Interactive Equipment...39
4.1.2 Community Perceptions of Space...41
4.2 ANALYSIS OF RESULTS...45 4.2.1 Descriptive Statistics...45 4.2.1.1 Age...45 4.2.1.2 Profession...45 4.2.1.3 Sex...46 4.2.2 Usability Assessment...46 4.2.2.1 Time Spent ...47 4.2.2.2 Application Use...47 4.2.2.3 Confidence...49 4.2.2.4 Perceptions...50 4.2.2.5 Satisfaction...51
4.2.2.6 Recommend the application...52
4.2.2.7 Open Questions...52
4.2.2.8 Interactive Equipment Use...54
5. DISCUSSION...55
5.1 WEB APPLICATION AND INTERACTIVE EQUIPMENT...55
5.1.2 Technical Use and Experience...55
5.1.3 The Levels of Participation and Engagement...56
5.2 COMMUNITY PERCEPTIONS OF SPACE...58
6. CONCLUSIONS...60
6.1 Summary of Results and Application...60
6.2 Challenges...61
6.3 Future Works...61
BIBLIOGRAPHIC REFERENCES...63
ANNEXES...67
Questionnaire...67
Responses to Open Questions...69
Shapefile Transformation ...71
Bugembe Structure Plan...72
INDEX OF TABLES
Table 1: Research Questions...7
Table 2: Web changes over the years (source: Geisa et al 2010)...21
Table 3: Planning theory, IT and GIS (source: Geisa et al 2010)...25
Table 4: Data for the study...30
Table 5: The function design requirements...31
Table 6: Questionnaire for assessing the application...37
Table 7: Open ended questions for assessing the application...37
Table 8: The wireless sensor, interactive pen and the USB for linkage to internet...39
Table 9: Summary data about the participants...45
Table 10: Summary statistics of the time spent interacting with the application...47
INDEX OF FIGURES
Figure 1: Arnstein's Participation ladder (source: Arnstein 1969)...1
Figure 2: Planning process in Uganda...4
Figure 3: study area location...8
Figure 4: Advanced participation ladder (source: Carver 2001)...11
Figure 5: Thesis structure...14
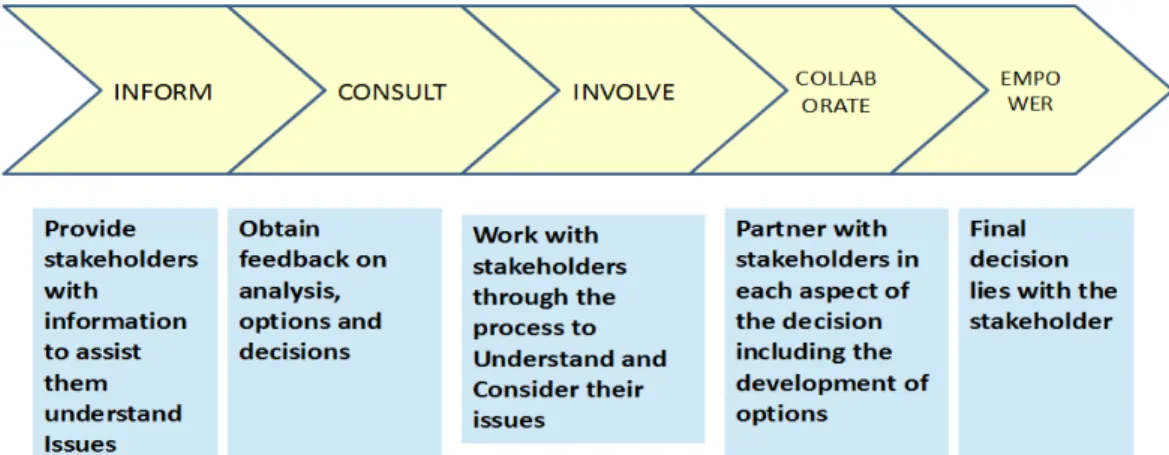
Figure 6: The spectrum as a model of participation...15
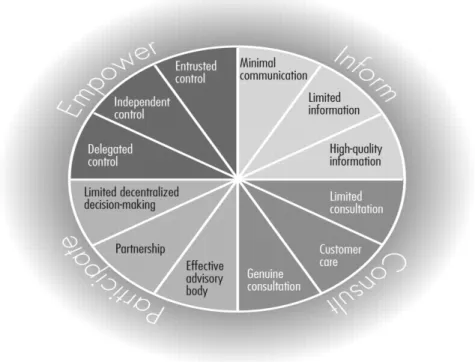
Figure 7: The wheel as a model for participation. (source: Davidson 1998)...16
Figure 8: Google searches across the world .(source: Marsden 2009)...20
Figure 9: Reality check lessons in Washington DC. ( source: Chakraborty 2011)...21
Figure 10: Public Participation in Canela, Brazil. ( source: Geisa et al 2010)...22
Figure 11: Using Map for second life web 2.0 application. (source: Hudson-smith et al 2007)...23
Figure 12: Communities map their ideal neighbourhood...24
Figure 13: The community mental map is digitised...24
Figure 14: Public participation meetings in Uganda...26
Figure 15: Community members make comments as a planner takes notes of comments...26
Figure 16: The women's metal map. (source: Weiner and Harris 2007)...27
Figure 17: children map the unsafe areas, these location are later picked by GPS. (source: Panek 2011)...27
Figure 18: Final map showing the slum areas and their insert pictures. (source: Panek 2011)...27
Figure 19: The thematic lines in PPGIS. (source: Ganapati 2011)...28
Figure 20: Methodology adopted...28
Figure 21: The system design...34
Figure 22: The web interface...35
Figure 23: Initialisation of the interactive equipment...39
Figure 24: Community are sensitised about the interactive equipment and neighbourhood plan...39
Figure 25: The oldest participant adjusts the boundary...40
Figure 26: A lady adjusts the boundary...40
Figure 27: Initial boundary before the workshop...41
Figure 28: The adjusted boundary using the web 2.0 and interactive screen ...41
Figure 29: Presentation to Planners...41
Figure 30: Planners make their observations...41
Figure 31: Participants agree on their boundaries...42
Figure 32: A group member explains to the other the land marks...42
Figure 33: Community perceptions and insert pictures...43
Figure 34: Community ranking of land marks by ward...44
Figure 35: A participant picks an icon to use. ...48
Figure 37: I found the platform easy to use and understand...48
Figure 38: I felt confident that my comments are captured for the first time...49
Figure 39: I felt confident that my comments will be used in further planning...49
Figure 40: I understood the way the land uses are mapped...50
Figure 41: Over all rating of application use...51
Figure 42: I would recommend the application...52
Figure 43: A participant is helped to pick an icon.. ...54
Figure 44: Some participants forgot to use the interactive pen and referred to changes with their fingers...54
Figure 45: Usability assessment: equipment perspective...54
1. INTRODUCTION
1.1 PUBLIC PARTICIPATION AND URBAN PLANNING
Public participation in the field of urban planning is a difficult venture in many communities; the lack of motivation remains unknown. To determine why, this study will be conducted using a web 2.0 application and an interactive screen in a developing country.
The notion that public participation carries varies from one field of application to another. In urban planning, community effort is greatly desired in the preparation of development plans. This is done to ensure plans are based on local decisions to solve local problems, thus a bottom up approach.
Communities are more informed of their surroundings; problems that affect their day to day activities, they have a better understanding of what the future should be. The best plans are therefore those that are community driven. The community has to be persuaded to participate otherwise the plans are alien to them making implementation impractical.
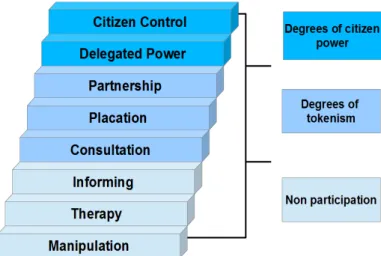
Public participation approaches have been influenced by Arnstein’s participation ladder(Arnstein 1969); which describes the transfer of political power from traditional power holders to citizens, to enable communities achieve their own requirements.
In figure 1 above, she characterizes eight participation components into three major themes of; non participation, which is at the bottom level of the ladder, implying the community is only educated and told what will be done; the tokenism which is the central theme, involves community giving advice and being heard; the top most ladders represent the citizen power theme, here, the communities create partnerships, delegate power and are in control.
Arnstein's participation ladder has inspired many approaches that involve community input, PPGIS studies are highly influenced by this ladder for citizen engagement and marginalisation. The term: “public participation geographic information systems” (PPGIS) was established in 1996 at the meeting of the National Center for Geographic Information and Analysis (NCGIA). The meeting's emphasis was on GIS and Society: the social implications of how people, space,
and environment are represented in GIS. (Craig et al 1998).
PPGIS approaches aim at reducing the community nonconformity with GIS, basing practices on a bottom- up GIS, where the communities are the sole drivers of data provision, use, sharing and manipulation. The focus is on the non experts and occasional GIS users. (Hacklay and Tobón 2002)
PPGIS approaches are on the increase in many applications and more so in the developed countries. Approaches are changed from time to time basing on the community experiences, resources, time frames and levels of concern in the decision to be made1.
Although there is high advancement in PPGIS approaches in the western world, mainly technology based, public participation methods should be based on community experiences than technology. PPGIS involves understanding the kind of community in terms of their cultural and social aspects, analysing approaches used in the past, measuring, assessing their performance and then identifying better methods.
Web GIS is the recently used PPGIS approach, which has given capacity to traditional GIS methods. The invention of Web 2.0 has contributed greatly in the discipline of PPGIS. A Web 2.0, which is computer and internet based, allows its users to interact with other users or to change website content to their requirements. The web pages are more dynamic, creating a rich exposure for data generation, manipulation and sharing, activities which in the past were for the GIS experts only. Web 2.0 applications for PPGIS have produced very promising results since the communities participate at their convenience. (Batty et al 2010,Goodchild 2007).
Technological advancement in developing countries is still at the early stages; as a result, many countries still use traditional GIS methods which yield immense results and suit the purpose. However some of these methods create wide gaps especially in terms of getting and using feedback from communities, the planner undergoes double efforts in capturing community comments into the GIS data base and creating mistrust among communities as to whether their comments were considered since these are written down on paper.
As a result, these approaches have cost the participation processes, as well as discouraging the community from making changes that would impact on their lives. A gradual change from old participation methods is necessary since we learn from experience and adjust accordingly.
1 International Association of Public Participation(IAP2)- http://www.iap2.org/: provides guidelines and training for enhancing public participation in different parts of the world. The participation spectrum is highly used in different stages of public participation
A combination of the low technology and high technology would yield good results. The high technology would be used for building the interface while presenting a simple interface to the users.(Al-kodmany 2001)
Geographical scale in PPGIS has huge impacts on the participation levels. The size of the community has an influence on the method to use and therefore its performance. Participation is more promising when a small representative community is used. At national levels, the percentage of the population interested to participate is likely to lower than when the participation is centred at the local level. The scale of the community therefore should dictate on which method or approach to use in the participation process.(Kingston and smith 2007).
Besides using the web 2.0 application and the interactive screen, the study will involve understanding the community perceptions of space for enhancing public participation. This is inspired by, Carver 2001, in his studies about Participation and GIS, he suggests that studies on community perceptions of space, would address some of the weaknesses in participation and GIS. Community perceptions of space are increasingly being studied in not only planning fields but in areas where the community understanding of objects, features is required. Different professionals have different ways of representing spatial features, a road, for example, means differently to a town planner, cad-astral engineer, road engineer, and surveyor. For some, a road is just the carriage way, while for others it includes the utilities lines, drainage channels, the pedestrian precinct and the cycle lane. This therefore influences the way the road is represented on maps and presented to communities. Perhaps communities may have a different understanding of space than what is represented to them; participation therefore becomes compromised with little understanding of what is presented.
1.2 Background
In Uganda, town planning is one of the highly recognized disciplines involving public participation. Planning procedures are legislated2, requiring public involvement at all stages of
the process to ensure that the locals are empowered and in charge of causing changes in their own communities.
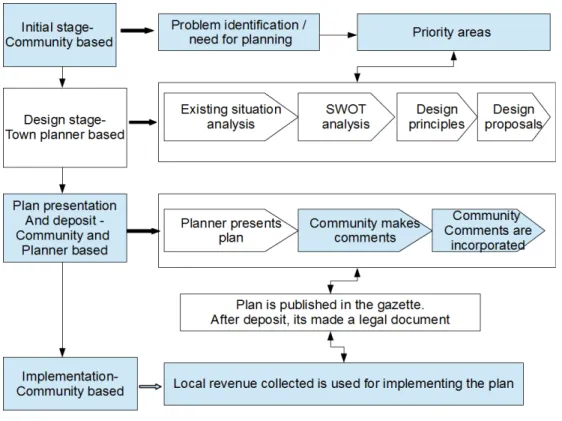
The planning process follows a number of sequential steps, of which 80% is community driven. The planning starts with problem identification, the community concerns are sought and priority areas identified.
The subsequent stages involve plan preparation, where the planners give technical guidance to solve the problem/s. In the final stages, the prepared plan is presented to the communities to which they can still make changes and these are incorporated in the final plan. The plans by law,
2 Physical planning Act 2010: The planning processes are documented in the act which are also in line with the constitution used in the country. This makes planning a legal process, once the plans are approved by the community, they become legal documents.
are left on deposit for a period of time to enable community members who could not attend the consultative meeting, have an opportunity to contribute.
Initially planners prepared development plans on drawing boards; different map layers were then over laid and traced to generate the final base map on which the planning proposals were drawn. This process involved the use of tracing paper and drawing pens, in case of a mistake, the adjustments were done in rudimentary ways. The system is exposed to more errors since the tracing paper is subject to expansion and contraction depending on the weather conditions.
With the introduction of GIS, some planners have now realized the benefits of using the GIS desktop tools to generate plans, manipulate data, yet others still use the drawing boards..
Figure 2 below shows the planning steps followed, importantly, 80% of the input comes from the community to enable them own the plan.
1.3 Problem Statement and Research Justification
In Uganda, urban planning studies use GIS tools merely for production of plans, data analysis, manipulation and retrieval. There are limited studies on PPGIS in urban planning particularly in Uganda.
The problem in this study is related to the planning process in the country, at the community involvement stages, which could perhaps be the cause for the low participation levels in the planning discipline. In addition, the study will analyse the public perceptions of space and spatial aspects of decision problems. The planning process shortcomings are further explained in the following paragraphs.
In the planning consultative meetings, the traditional methods of pen and paper are still used to capture community comments, these comments are eventually entered into the GIS database upon return to work stations since most of the meetings are held in distant areas from the planners’ work place. This poses problems of estimations since the information is taken from paper and pen to the computer. This process is subject to a number of errors and questionable levels of accuracy since the corrections are based on estimates. This consequently leads to double efforts and time, to recapture data that would otherwise be handled at once in the field operations. This traditional method creates doubt among the community, wondering whether their comments have been considered or not. Community members have always been in doubt if their comments are considered and captured the way they expressed them especially with the traditional method of paper and pen. As a result this has affected the confidence levels in community participation. Illiterate locals are always cautious of their decisions, often times doubtful if their ideas are considered relevant, perhaps this is reason for their low participation levels during the planning meetings.
Community members have different ways that are convenient to enhance their participation, some people are very vocal, expressing themselves very freely in public yet they may not have all the necessary information needed in the planning process. However others prefer to participate in a detached environment, to express their views confidently. The traditional meetings have created a rich platform for the most vocal community members and have poorly neglected those who shy in the public and yet have brilliant development ideas.
Incorrect data entries have affected the process of plan implementation, after the plan preparation, surveyors take on the plans to survey the major land uses, boundaries among others. Often the information does not correspond to the ground truth especially in terms of location; making their work impossible and therefore halting the plan implementation process.
Planning data captured on paper and pen, creates difficulties in information sharing with other professionals since the planners have to interpret and understand the community implications yet the information may have urgent needs. This leads to untold delays in the process of data sharing and dissemination. This eventually compromises other development procedures in the related sectors and the country as a whole.
It is against the above problems that this research will be conducted to analyse the causes and establish remedies to combat or reduce the problems faced during the planning process. Perhaps these problems have hampered the plan implementation process in Uganda
1.4 Study Objectives
The general goal of this study is to assess the viability of a web application using interactive screens in public participation in developing communities like Uganda, with low technological levels. Web applications using interactive screens for public participation are very ordinary in developed countries, however in Uganda, this application will be different considering the environment; the study will assess whether the application improves participation among the locals or draws them even further from participation.
The specific objectives in the study address mainly traditional planning related problems expressed above that are experienced in the community participation processes.
The study objectives are divided into three core components, which support the realization of the study goal:
1. To develop a web 2.0 platform that will create an interactive podium for participation.
The platform will be built to enhance visualization of the maps, edit and save comments into a database. The prepared plans will be projected from the web application and communities will use an interactive pen to make comments on the projection which will be stored into a GIS database.
This will create an avenue for direct comment capturing, reducing the double efforts in the past associated with data entry at the same time enhancing high levels of data accuracy and ease in data sharing.
2. To test the application in a real world situation.
The application will be tested in Uganda in a real time workshop, to assess its significance in enhancing public participation. This will be done during a traditional community meeting, since few people have internet connection and laptops, therefore they cannot use the application from their homes. The workshop will be centred on a neighbourhood plan prepared by the council, community comments will be sought as provided for in the planning laws and regulations of Uganda.
The workshop proceedings will be used to gauge how the community uses the platform, through physical checks and assess how people interact with the application. This application will provide an opportunity to record directly community comments. Usability assessments will be done to analyse if the web 2.0 platform and interactive screen enhance public participation in Uganda. This will be done using questionnaires, recordings and physical checks to see how people easily interact with the application.
3. To understand the community perceptions of space.
Different professionals represent spatial features differently; the study will analyse the lay people’s interpretation and representation of spatial features as they map their opinions onto the interactive screen and paper map. Perhaps the way professionals like planners, surveyors, cad-astral engineers among others represent space is not clearly understood by most local people, this
could be a reason for their low levels of participation in the planning process. The community will be encouraged to map landmarks in their respective areas using paper and pen. The study will analyse the problems, if any, that communities have in understanding the way spatial data is represented.
1.5 Research Questions
The study will analyse the level of influence of a web 2.0 platform using an interactive screen in enhancing participation among the community in the planning process. The opinions of the planners will be sought about this study in relation to how they conduct their duties in the field during the planning process. The following research questions will be considered to address a specific research objective:
Study objectives Research Questions
1. To develop a web 2.0 platform that will create an interactive podium for participation
i) Do web applications using interactive screens enhance public participation levels in the planning process in Uganda?
2. To test the application in a real world situation. ii) Does the interactive platform influence data update and reduce inaccuracies in the data in Uganda?
3. To understand the community perceptions of space.
iii) Do technical representations of space have an impact in community understanding of spatial aspects?
Table 1: Research Questions
1.6 Hypothesis
The following hypotheses will be tested during the study:
If community participation levels increase then web applications using interactive screens are suitable approaches for enhancing participation in the developing countries.
If inaccuracies are reduced, community participation by using web 2.0 technologies with interactive screens is suitable for developing countries.
If the community members can understand the spatial features and map the features then they understand the display of the spatial features and elements.
1.7 Scope
1.7.1 Geographic Scope
Town planning is carried out in all parts of Uganda, by law the whole country is a planning area. (Physical planning Act 2010). The case study as illustrated in figure 3 below, Bugembe, lies in
the Eastern part of the country along the Jinja–Tororo highway about 4 km from Jinja Municipality, the second largest town in Uganda.
In the south, it is bordered by Lake Victoria, the largest fresh water lake in Africa, Mafubira Sub County in the north and east, Jinja Municipality in the west. The Town Council covers an area of approximately 7.63 sq km, with a gently sloping terrain, from which, a beautiful scenery of Lake Victoria is viewed. The region lies along 0º 28´ 03.29"N, 33º 14´ 12"E.
Bugembe Town council as an administrative unit, was established on 26th April 2008 as one of
the three town councils in Jinja District, which was once the industrial hub of Uganda.
In the late 1930’s, it was officially recognized as the seat for Busoga kingdom, Obwa
Kyabazinga bwa Busoga3, this dates back to the historical perspective in Uganda when the kings
were the recognized leaders in the area.(Dongen, 2008)
In the 1950s, the town was declared a planning area following the then planning Act4 and the first
physical plan was developed in 1953 on a drafted tracing paper.
The town houses most of the retired civil servants in Busoga, especially those who initially worked in the administrative areas of Jinja district.
3 Kyabazinga is the title given to the king in the Busoga region or kingdom. 4 Town and Country Planning act 1951 was established by the British in Uganda Figure 3: study area location
According to the Uganda Bureau of Statistics (UBOS), in 2008, the estimated population of the town was at 30,600 and in 2011; UBOS estimated the population of Bugembe at 33,100.
The town is made up of 5 administrative units/wards: Katende, wanyama, Nakanyonyi, Budhumbuli east and west.
The Town authorities sought the need to enhance orderly development in the town, since the town is fast growing with a high population growth rate of 4.5% per annum. Majority of the town population is comprised of female (51.6%) as compared to 48.4% male population.
The settlements in the southern part of the town council in Budhumbuli east and west wards have squalid developments which pose a health nuisance to the community.
There is an environmental threat in the town which is mainly linked to the disposal of wastes (solid) as well as domestic storm water. There is no properly established site for the disposal of waste water as well as a system of waste collection. Wastes are dumped along the roads, which leads to environmental degradation especially the non biodegradable wastes. The biodegradable wastes pollute the environment with bad smells. The open dumps are close to people’s homes and they get filled up yet emptied irregularly. This has affected the environmentally sensitive areas leading to climate change and its adverse effects.
The initial structure plan prepared in the past is outdated and the new structure plan will seek to address the development concerns in the town.
A structure plan, which is a broad guideline, which shows areas in general terms for urban development. The urban physical development plan (physical planning Act, 2010), indicates the manner in which the land in the area may be used.
This study will therefore focus on the public participation stage where the community will be requested to make comments on the plan prepared by the town council using an interactive web 2.0 application platform other than thetraditional methods of paper and pen that are often used in the country. The town council structure plan will be projected on to an interactive screen and the community comments will be sought.
Planning by definition is an exercise in imagining and shaping the future. Literature has demonstrated that the planner’s role in shaping the future should not be limited to outcomes but extend to process. Planners should not stop at designing beautiful drawings on paper but also work for the plan implementation to enable the communities realize the benefits of planning. Planning as a process should be inclusive of the under represented, especially the women and children, engaging to the community from its earliest stages in the identification of the priority areas, and use technical and other tools to communicate trade-offs. (Chakraborty 2011, Rittel and Webber 1973)
Planning by nature is people centred, planning for culturally, socially diverse people requires planners to move beyond their reliance on technical and scientific methods and embrace different ways of finding information from communities that are experiential. (Sandercock 1998)
Although planning approaches are centred at reaching out to a large group of people, it is often difficult to obtain a suitable time and place to conduct participatory meetings for the whole community yet their input is very necessary for the development plans.
The scale of a planning process can range from a local community to a metropolitan region, county or state. Scales influence the participation approaches among locals, smaller geographic scales are known for producing enormous results in participation unlike bigger geographic scales where people will tend to shy away from participation.
1.7.2 Project Scope
The major goal of the study is to assess the influence of web applications using interactive screens in enhancing participation levels in the planning sector in Uganda while understanding the community perceptions of space. The project scope involves:
1.7.2.1
Developing a web 2.0 platformAn interactive platform will be developed using web 2.0 technologies, with the sole functionalities of data visualization, edit and save comments into a database. The necessary data layers will be collected and organized in the suitable format for the application. A Web 2.0 site allows its users to interact with other users or to change website content, in contrast to non-interactive websites where users are limited to the passive viewing of information that is provided to them. (Batty et al 2010)
Web GIS improved the application of traditional GIS through enabling the users on the client side to be the sole data providers. On a web GIS, the data and maps are accessible to anyone on a computer with an Internet connection. The advantage of web GIS over desktop GIS is that it is more accessible to the general public, as citizens do not have to install expensive software on their computer. (Ganapati 2011)
The web 2.0 will be used at a traditional participation meeting, where the community will gather at a central place and make comments on the displayed plan but this time, map directly on the interactive screen. Since public participation is a process, the communities need to be exposed to new approaches but at the same time combining them with the old procedures so that the gist of the approach is not lost with drastic changes.
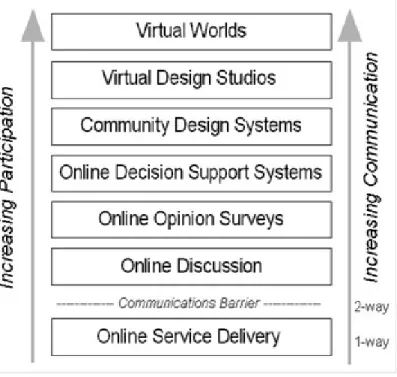
Arnstein’s participation ladder (Arnstein1969), figure 1 above, was further advanced to explain how participation levels are increasingly being influenced by technology advancements, as illustrated in figure 4. The advanced version emphasises increasing communication, leads to more interactivity as the online applications come into play creating two way information flows hence increasing participation unlike online service delivery, a one way communication approach which relates to non- participation component of Arnstein's ladder. The assumption is with increasing online discussions, there is increasing communication and therefore participation.
Public participation approaches that are technology oriented should follow steps and processes that are gradual and communities should be exposed on a step by step basis.
This study will therefore be based on traditional community meetings in a central location, the communities in Uganda are more used to these settings, and most of the people cannot access the application over the internet since they don’t have computers and internet connections.
1.7.2.2 Evaluation of the web 2.0 platform
The application will be tested in a real world experience; the communities will be encouraged to make comments on the plan prepared and these will be mapped directly to an interactive screen. The application will be evaluated physically through observation to ascertain how easily the communities interact with the application especially if they can make any comments on the projection.
1.7.2.3 Usability assessments
Finally usability assessments will be conducted using questionnaires, where the participants respond according to their experience with the platform. Measures of satisfaction, efficiency and effectiveness will then be determined from the response. Physical checks are also done to assess the levels of interaction with the equipment, during and after the workshop.
The quantification of participation levels is complex. To understand the needs of the community in relation to applications that they use comfortably requires usability tests. Often people start
web browsing and quit the process prematurely, hence making it difficult to assess system usability.
According to Butler 1996: “System usability can be quantified in terms of users’ performance and satisfaction during the interaction with the system”. There are mainly two methods for evaluation of usability: inspection methods, for testing the levels of interaction physically and collecting feedback as users interact with the system. (Banati et al. 2006). Physical checks, video recordings will be done to provide an understanding of how the process transpired.
1.7.2.4 Community perceptions of space
The research covers lastly understanding the community perceptions of space; public perceptions of space are sought through the questionnaire, to understand their feelings about spatial representations of geographic features on the web 2.0 application. The community is also engaged in a mapping exercise in which they are tasked to highlight their boundaries and landmarks. This will enable the researcher understand how communities prefer to represent spatial features on maps for their easy orientation and understanding. Conclusions will be drawn to ascertain whether this has an influence in discouraging communities from participation.
1.8 Thesis structure
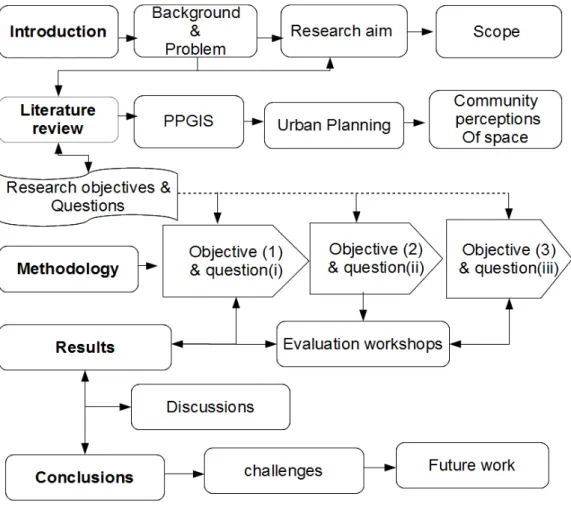
The structure followed as illustrated in figure 5 below, is in relation to the study goal of enhancing public participation and the procedures followed to achieve the objectives as outlined above.
Chapter 1, in the Introduction, the general perspective of the project is explained, to provide an understanding of the purpose of the study. The subject area is elaborated; expressing the originality of the problems and the background which enhances the motivation to carry out the research. The goal and objectives of this study are explicitly explained.
The project design that will be followed is illustrated especially in line with the objectives of the study to provide an understanding of the background studies as well as the choice for the study problem. The subsequent steps that will be followed in order to achieve the study goals are then illustrated. The geographic scope and project scope are elaborated as well.
In chapter 2, the theoretical framework is presented especially targeting areas of interest to public participation from the broad perspective and dwindling down to PPGIS which creates a basis for this research and study. PPGIS approaches are examined in the developed countries with advanced technological equipment and lessons are drawn from the experiences. PPGIS experiences in developing parts of the world are then examined to relate the studies to the research being conducted as well as borrowing ideas that are applicable in the Ugandan setting.
Literature about Town planning is revisited, to illustrate its significance in social-economic development, the significance that community participation portrays is considered. Studies on community perceptions of space are analysed to borrow ideas for the study being conducted. In chapter 3, the methodology for the study is illustrated with specific consideration to the study objectives and research questions. The conceptual frame work provides a general understanding of the problem and the purpose of carrying out the study. The web application design follows a simple interface and a traditional community meeting is still followed. The steps to test the application in a real time workshop are explained in detail. The design processes and procedure are illustrated in diagrams for better understanding of the methodology used. The design methods are mainly centred at achieving the study goal of the research to enhance participation than to draw people away from participation.
The results are shown in chapter 4, this involves the results from the developed web application; illustrations of the workshop proceedings are shown in this section of the report. The results from the consultative workshops are elaborated giving analysis of the proceedings in the field work scenario.
The application is evaluated using questionnaires filled in by the participants during the consultative meeting, physical checks and recordings. The results from this evaluation are further analysed in relation to the study objectives.
In chapter 5, the results are discussed in relation to observations made, responses from the questionnaires and physical observations. The discussion is done in line with the hypothesis being tested to ascertain if the hypothesis and research questions are answered. A comparison is made in relation to studies carried out in the discipline of public participation, literature reviewed, to ascertain the level of consistency or contrast with this study carried out in Uganda and its contribution the discipline of PPGIS.
In chapter 6, conclusions are drawn about the study, analysing its impact in PPGIS in developing countries and above all its applicability in Uganda. Arguments are made whether the application enhances participation or it doesn’t in relation to the results and analysis made from chapter 4. Recommendations are made for further research areas especially addressing the challenges that were faced during the research and the study workshops.
2. RELATED STUDIES
2.1 INTERACTIVE PUBLIC PARTICIPATION, URBAN PLANNING AND
COMMUNITY PERCEPTIONS OF SPACE.
Public participation approaches have caused a lot of interest in many disciplines, producing enormous results which have led to intensifying applications to “better” methods with motives of attaining even better results to phenomenon studied. From the town planning perspective, to plan for any community, there is need to understand how, when and where, to ensure that informed decisions are made that will stand the taste of time. The how, when and where are easily addressed by communities since locals understand their priorities better than any outsider, they are more familiar with their surroundings and have a better view of how their neighbourhoods should look like even in the future.
2.2 Public Participation
Public participation studies are rooted to the Arnstein’s 1969. Public participation models have been designed to further guide the process and stages at which individuals should be involved. The spectrum in figure 6 below, as a model of public participation from IAP2, looks at different participation levels in which communities should be involved. Five core aspects of participation are highlighted and the level of engagement increases from the stage of inform to empowerment. These different stages provide a basis for determining at which stage the community should take part in a particular level of the participation process.
Davidson 1998, commented about the South Lanarkshire council's wheel of participation illustrated in figure 7 below, as a tool for promoting positive and responsive approaches for
developing partnership in public participation processes. He emphasised that the wheel enables authorities to go beyond the limitations of the traditional public meetings since they include opinion meters, software, techniques for planning of real time focus communal groups. South Lanarkshire council in Scotland, developed this model to improve the communication gap between the authorities and the locals so that areas that need emphasis are identified in the planning process. Many local governments are using these participation models to engage communities in decisions that directly affect their lives.
2.3 Interactive Public Participation
Interactive approaches to public participation have increased over the years with the motive of encouraging communities to participate at their convenience and gain confidence that their opinions are highly considered. Public participation over the years was centred on traditional methods since technology was still in the early stages. Communities were involved in traditional mapping exercises for planning to demonstrate their ideal neighbourhoods and identify changes needed for development of these areas.
This trend was further uplifted when the term: “public participation geographic information systems” (PPGIS) was established in 1996 at the meeting of the National Centre for Geographic Information and Analysis (NCGIA). The meeting was intended to discuss GIS and society; the
social implications of how people, space, and environment are represented in GIS. It was from this meeting that numerous studies arose to guide PPGIS in all parts of the world.
Public participation GIS (PPGIS) in the broader context implies participatory mechanisms where the general public facilitated by GIS provide and make changes according to the subject under discussion.
According to Hacklay and Tobón 2002, “public Participation GIS (PPGIS) is a field of research that, among other things, focuses on the use of GIS by non-experts and occasional users. These users tend to have a diverse range of computer literacy, world views, cultural backgrounds and knowledge“. It is from these non-expert users that geographic information needed is obtained to address issues in their jurisdictions. Communities provide an expertise in ideas or knowledge that is rich in content and relates to the subject being discussed, these rich contents would otherwise be omitted if these locals are left out of the picture.
2.4 Traditional GIS
Traditional methods of public participation involve the use of pen, paper, analogue maps; here communities have the opportunity to express their views either by way of writing or drawing. Mental maps have been cited as the best examples that involve communities, designing their ideal neighbourhood plan, by allocating places for various facilities. These methods though termed out dated are still interactive, interesting and exciting to communities since the locals directly influence the way their towns will grow in the near future.
Noticeable are the wide range of advantages that these methods present ranging from being readily available, cheap to flexible, however they come with a wide range of complications. Al-Kodmany 2000, argues that, the main drawbacks of freehand sketching are that it is limited in presenting information about the current context of the planning area, and it is not highly interactive.
2.5 GIS and the Internet.
GIS where internet is the medium of transition became popular since the 1990s, the trend has grown over the years. “Citizens can view the maps in real time with dynamic data queries. The interactive features of web GIS, such as querying, searching, and mapping dynamically on the fly, have further expanded the use of GIS for citizen participation” (Kingston 2007, Tang and Waters 2005).
Technological advancement in the GIS field has contributed to productivity in all sectors as a multidisciplinary approach especially in relating things that would be totally unrelated. “Using the medium of Internet, GIS systems can be developed to address the notions of democratization with respect to spatial data and decision-making processes, open accessibility, and an effective distribution of spatial information”(Boroushaki and Malczewski 2010, Hanzl 2007).
Al- kodmany 2000 adds that the Internet has already proven to be valuable on its own as a low-cost mode of communication for participatory planning though Web sites, e-mail, surveys, and online conferencing. In particular, Web-based GIS and Web-based virtual reality are becoming two new frontiers for visualization in public participation planning.
GIS and the internet have advanced the approaches used in PPGIS, however, the methods and interfaces for web applications are often complicated for a number of users. As a result people tend to shy away when faced with unfamiliar technology. “Web-PPGIS practitioners need not only upload a Web-PPGIS to a Web site, but also must design it in an effective, efficient, and satisfying way for users to perform specific tasks.”(Meng and Malczewski, 2010)
2.6 The web 2.0
The need for more interactive means of public participation, advancements in technology and the use of the internet led to the birth of web 2.0 applications in 2005. The term ‘Web 2.0’ is commonly associated with web applications that facilitate interactive information sharing, interoperability, user-centred design, and collaboration on the World Wide Web. A Web 2.0 site allows its users to interact with other users, sharing web content or to change website content, in contrast to non-interactive websites where users are limited to the passive viewing of information that is provided to them. (Batty et al 2010, Goodchild 2007)
Web GIS improved the application in traditional GIS through giving capacity to users on the client side as the main data providers. The communities participate at any time, place through a few clicks and browsing. The data and maps are accessible to anyone on a computer with an Internet connection. (Ganapati 2011, Krygier, 1998, Batty 1997).
The ability to keep users anonymous made Web 2.0 preferred over the traditional methods. A Web-PPGIS enables people to express their views by posting comments in a relatively non-confrontational manner while relating the information provided by other users. (Meng and Malczewski 2010)
Web 2.0 is an innovation from the web 1.0, latter not only provided information from the programmers, but also in static formats, browsed according to the “experts” design, centering on the expert’s choices.
While map-based communication have traditionally been unidirectional, universal online base maps and associated application programming interfaces have paved way for the emerging cadre of ‘neo-geographers’ to democratize map production to the extent that the distinction between map makers and map consumers has blurred (Turner 2006, Gartner et al 2007, Hall et al 2010, Goodchild, 2009).
Web 2.0 is interactive and designed basically for the local person with limited or no GIS knowledge to feed in their views and opinions. Web 2.0 comes with outstanding significance, (O’Reilly, 2007) shifting the Web to turn it into a participatory platform, in which people not
only consume content (via downloading) but also contribute and produce new content (via uploading). In the web 2.0 applications the users are no longer on the receiving end but rather the major contributors of the knowledge base.
2.7 Low Technology or High Technology
The level of technology greatly influences the levels of participation, prior knowledge about the community and their past experiences in participation is important and a guiding factor, whether to have low-tech or high -tech methods. Al-Kodmany 2000, argues that, “many stakeholders in urban planning are lay persons with varying amounts of experience with computers. The simplicity of many of the traditional methods can instil confidence and encourage people who retreat from technology to participate. Tools such as pen and paper sketching, paper maps, photographs and physical models draw forth high levels of participation and input from the participants”.
Arias 1996, suggests that, “real-time social interaction among neighbours surpasses computer simulations even when they have user friendly computer interfaces. He adds that computerized methods lose their advantages when people have to work the computer.
There is no knowledge base that is a prerequisite for participation. Participants do not need to know how to move a mouse, for instance. The low technology methods generally carry a lower price tag, which is a prime consideration for many community groups. It must be acknowledged that the computerized tools may simply be out of reach for many organizations.(Al-domany 2000)
However the low technology methods present a number of disadvantages which makes their choice highly questionable, they lack competency in handling large volumes of information; they lack functionalities like formatting the data easily and retrieving it, which functions are relevant to any GIS environment.
In the Geo-spatial environment, GIS offers a wide range of applications which turn the data into meaning. Spatial analysis is an outstanding application that the GIS benefits from unlike the other computer systems and worse still with the low technology methods.
However, the high technology methods if not well used, discourage participation among the communities as they may be misleading and difficult to interpret. Al-Kodmany 2000,
emphasizes that when choosing a computerized method for use with the community, it must be as simple and less intimidating as possible in order to facilitate a high degree of involvement. He adds that “It is becoming widely accepted that in communicating planning ideas, the form of representing the information is as important as the information itself”.
According to Marsden 2009, Africa has been largely referred to as the least in technological development and use as shown in figure 8 below, yet the technology in Africa is sufficient for citizens to work with in the means.
He explains that Africa has been referred to as technological 'wasteland5, the cost of technology
is much higher in Africa than in developed countries. He emphasises on the need to have systems that extract more functionality than having new designs.
2.8 Interactive Public Participation in Practice
Interactive public participation applications have been widely used around the world and the efforts have shown tremendous results which have led to the continuous improvements in the approaches used in the public participation studies.
Traditional methods of participation although termed out dated, provide a learning ground for improving methods being tested, it is from these experiences that adjustments are made to enhance participation. These methods still play a significant role in PPGIS especially in communities where technology advancement is still very low.
Examples for the study have been drawn from all parts of the world to create an understanding of the methods initially used, what is currently used, how and for which community. These examples provide ground for the study strategies to be put in place in Uganda.
5 According to the google searches, the length and the intensity of the coloured lines represent how many searches are happening at that instant in that place in the world.
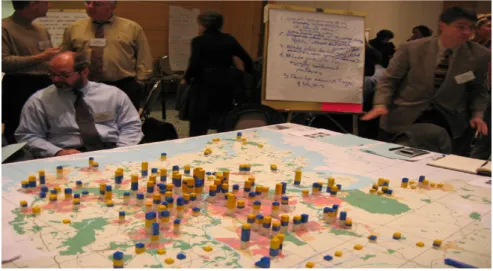
In reality check lessons to enhance participatory planning in Washington DC in figure 9 below, coloured Legos were used to map the anticipated growth in terms of jobs and in the housing sector for each grid with a unique ID.
These predictions were later entered into a data base for further planning exercises and the development of the neighbourhood. The gist is in the simplicity of the method used; legos, children' favourite play toy, to create a friendly environment while encouraging the community to participate.
In most developed countries, the traditional mapping exercises are no longer widely used firstly because of the advancement in technology and secondly it is not always easy to have the entire community gather in the same place and time. Web applications have therefore taken course in most of the studies, with the wide internet connections.
Web technology has changed over the years as described in table 2, with web 1.0 commonly used in 1995 and earlier years, web 2.0 in 2003 and web 3.0 in 2008, all ranging in applications for different uses.
Web 1.0 Web 2.0 Web 3.0
10 million users 100 million users Billion users
Pushed web Two way web Real time web
Text and graphics Email, audio, video, wikis, blog, social networks
Avatar representation, media flows and virtual worlds
HTML, XML AJAX, RSS Web semantics
Content consumers Content shares Content interoperability
Slow connections Fast connections Ubiquitous connection
flash 2D 3D
>1995 >2003 >2008
Table 2: Web changes over the years (source: Geisa et al 2010)
Public participation web 2.0 approach in Canela Brazil developed by Geisa et al 2010, in figure 10, was used to address planning concerns, the community made comments on planning topics using makers to show the different colours for different planning topics. The meeting followed a traditional method where the whole community gathered and commented about the planning topics from computers installed with the application.
The application was literally translated in Portuguese so that the local people could easily find their way around the application.
The Woodberry online public participation experiment6 by Hudson-smith et al 2002, was used to
engage residents in making suggestions for a housing scheme, to improve the housing conditions in wood berry down estate in the London borough of Hackney. The participation was categorized into two forms; an exploratory platform was placed at a school for the community to make comments while there was an online version which expressed the feature development of the area in 3D and the locals were encouraged to comment and a make a choice of their preference. The approach here is a combination of both traditional methods where those who can't access the
6 Http//hackney.gov.uk/woodberry/
application on line have the opportunity to make their comments at a deposited version of the application in a school.
The beauty in the method is that a large group is reached on line and also in the traditional meeting. The site provided the locals with options to chose from, the alternative plans were pre designed, participants made a choice of the most desired neighbourhood and submitted it to the authorities.
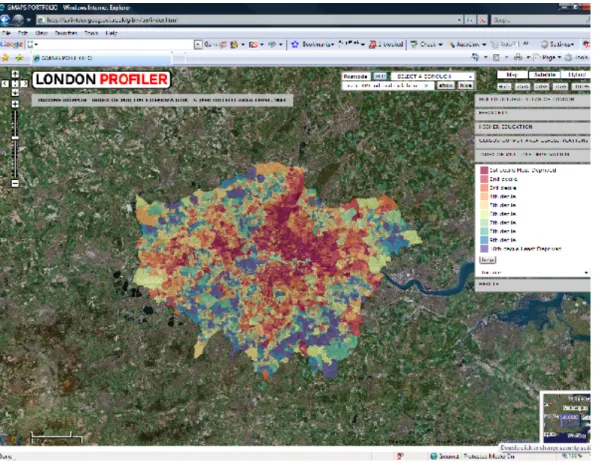
Hudson-smith et al 2007, looked at studies of second life in web 2.0 applications7, as shown in
figure 11, a Map Tube was designed as an environment where users created maps, viewed them and engaged in simple manipulation using the time-honoured method of map overlay. The users could share these maps with other users. Such experiences enable the users to have confidence that their comments are considered
2.9 Interactive Public Participation in Practice in Africa
In South Africa, Weiner and Harris 2007, examine how GIS plays a central role in how people view their physical resource base and exploit it. The study was based in Mpumalanga Province
7 http// the London profiler.org
which was undergoing transition in environmental features, facing rapid per-urbanisation and recovering from the apartheid forced removals. The multimedia CiGIS application developed was based on providing a platform for identification of potential land reforms. The method was a combination of traditional GIS methods where the base data was mapped on tracing paper and later on digitized and integrated in the CiGIS. The mapped data included how groups would use any land allocated through land reform.
Kyem 1999, in his study of promoting local community participation in forest management in southern Ghana, encourages the community to use GIS in the management of the forest resources. The meeting followed the traditional method of central communal gathering. The women and men were engaged in groups to discuss and map ideal land uses. The use of GIS helped to merge ideas and thoughts of the various groups into a common vision. He discovers that the PPGIS method he used provided a mechanism for harmonising multiple view points, it helped the participants to develop a common sense of mission for the protection of local forests. Auma 2012, in her study of integrating community participation for urban redevelopment planning in Zanzibar, engages residents in mapping their ideal neighbourhoods using paper and pen as shown in figure 12 and 13.
Figure 12: Communities map their ideal neighbourhood
Figure 13: The community mental map is digitised
2. 10 Urban Planning
Public participation is significant in urban planning since all the planning approaches are directly based on opinions that communities make in their societies to improve the development of the area in which they live, work and relate with each other. It is therefore no doubt that most of the public participation approaches in one way or another are targeted at addressing town planning concerns regardless of the geographic scale of operation and the time frame.
Urban planning studies are rooted back to the mid-19th century of the industrial revolution era
which led to health nuisances due to the haphazard developments. Urban planning was therefore a means to combat the un healthy environments and create orderly and aesthetic environments. Most countries developed health acts to address the nuisances and most of the content was directed at how town planning would address these threats in one way or the other.
Planning approaches have changed over the years, as shown in table 3, as time passes by, different skills and approaches are used that best suit the situation and circumstances around.
Decade Planning theory IT GIS PPGIS
60´s Applied science: IT as resource to a rational, objective planning.
Data and electronic data
process 70´s Politics: IT as political tools,
reinforcing
existent power organizations.
Information and management system. 80´s Communication: information
distribution ways with great value
Knowledge and decision support system
GI Systems
90´s Reasoning together: IT as tool to
enable discussion and communication.
Intelligence GI Science PPGIS
00´s Participatory Planning Collective, social
data.
Voluntary GIS Web PPGIS
Table 3: Planning theory, IT and GIS (source: Geisa et al 2010)
Communities are central in the planning process, planning for culturally diverse populations will require planners to move beyond their reliance on technical-rationality and scientific methods to embrace different ways of knowing that include experiential, intuition and local knowledge (Sandercock 1998, Dragicevic and Balram 2004, Myers et al 1995).
Planning is an exercise of mental mapping to shaping areas in the future. “Literature has demonstrated that the planner’s role in shaping the future should not be limited to outcomes but extend to process. Such a process should beinclusive of the under represented, engaging to the community from its earliest stages, and use technical and other tools to communicate trade-offs”. (Chakraborty 2011, Rittel and Webber 1973)
Although planning approaches are centred at reaching out to a large group of people, it is often difficult to obtain a suitable time and place to conduct participatory meetings for the whole community. Most residents in an area are considered stakeholders, scale is a great determinant of the many factors that limit who should be included or who shouldn't. (Chakraborty 2011)
Planning in Uganda is highly participatory, taking on the bottom – up approach. Communities are central in the process, they are the driving force behind the development plans, their opinions are sought from the initial planning stages and mapped, the output is later presented to them for further consultation until the plan is ready for implementation, as shown in figure 14. In the planning meetings the traditional paper and pen methods for obtaining community comments are still employed as shown in figure 15.
Figure 14: Public participation meetings in Uganda
The planners takes down the comments on paper, incorporate these comments into the digital plan at a later stage. This method comes with a vast range of advantages ranging from easily available to flexibility but also a wide range of challenges await both the planer and the community, in terms of double efforts of data entry, errors from estimations and difficulties in data sharing as the planner has to adjust the comments fast before giving out the required information.
2.11 Community Perceptions Of Space
Professionals have different ways of representing spatial features, a road, for example, means differently to a town planner, cad-astral engineer, road engineer, and surveyor. For some, a road is just the carriage way, while for others it includes the utilities lines, drainage channels, the pedestrian precinct and the cycle lane. This therefore influences the way the road is represented on maps that are presented to communities (Talen 2000, Harris and Weiner 1996, George 1997). There is need to seek standard ways of design and representation of spatial features, cartographic standards are at times difficult to interpret even for the lay persons.
A South African community of Mpumalanga, (Weiner and Harris 2007) was tasked with mapping and identifying areas for land reform as shown in figure 16. In the exercise they
represented their perception of the space they live in and the ideal land reforms. Community metal maps provide a rich ground for understanding their perceptions of space and how planners can incorporate these features in the neighbourhood plans.
Figure 16: The women's metal map. (source: Weiner and Harris 2007)
A research conducted by Panek 2011, in Nairobi Kenya, was geared at PPGIS and understanding the community perceptions of space in different age groups for purposes of slum upgrading in Kangemi slum. Children (figure 17) were involved in an interview to map areas that they considered unsafe in the slum setting and the coordinates of these areas were picked, added into a GIS environment to produce the final map for slum upgrading strategies as shown in figure 18.
Figure 17: children map the unsafe areas, these location are later picked by GPS. (source: Panek 2011)
Figure 18: Final map showing the slum areas and their insert pictures. (source: Panek 2011)
3. METHODOLOGY
3.1 CONCEPTUAL FRAMEWORK
The conceptual frame work gives an ideal and illustration of the theoretical framework discussed in the previous section of related studies. The conceptual frame work explicitly relates to the research aim and objectives of this study.
To demonstrate the significance of the study, the thematic lines as suggested by Ganapati 2011, were used to relate to the study aims and create an understanding of the methods proposed for the study.
Figure 19 above illustrates that PPGIS is based on 4 themes, place and people; this relates to questions about which place will the PPGIS study be carried out from, who are the people and what cultural and social setting do they live in. In the theme of technology and data; which technology will be used and data, is the technology data driven or vice versa. It is important to understand the people and the level of technology they are used to, other wise the PPGIS process deviates from the intended objective of enhancing participation as many people tend shy away when faced with unfamiliar technology. The third theme of; the role of institutions, looks at the position of the authority and institutions in enhancing community participation. Finally empowerment; involves making the local people in charge and in control of decisions that affect their lives.