UNIVERSIDADE DE LISBOA
FACULDADE DE CIÊNCIASDEPARTAMENTO DE BIOLOGIA ANIMAL
SPIDER (ARACHNIDA: ARANEAE) ON PEAR ORCHARDS
IN THE “OESTE” REGION OF PORTUGAL
Catarina de Azevedo Tavares
MESTRADO EM ECOLOGIA E GESTÃO AMBIENTAL 2007
UNIVERSIDADE DE LISBOA
FACULDADE DE CIÊNCIASDEPARTAMENTO DE BIOLOGIA ANIMAL
SPIDER (ARACHNIDA: ARANEAE) ON PEAR ORCHARDS
IN THE “OESTE” REGION OF PORTUGAL
Catarina de Azevedo Tavares
Dissertação Orientada:
Prof. Doutora Maria Teresa Rebelo (DBA/FCUL) Doutora Célia Mateus (INRB/EAN)
MESTRADO EM ECOLOGIA E GESTÃO AMBIENTAL 2007
Nota Prévia
Esclarece-se que os capítulos da presente dissertação de Mestrado irão ser submetidos a revistas internacionais, depois de sujeitos a correcção. Tendo sido realizados em colaboração, a candidata esclarece que participou integralmente no planeamento, na análise e discussão dos resultados e na elaboração de todos os trabalhos apresentados.
Os artigos estão apresentados segundo as normas das revistas a que serão posteriormente submetidos:
The Journal of Arachnology:
- Ground-dwelling spiders (Araneae) in pear orchards under three agricultural management systems in Portugal: analysis of abundance and diversity Revista Ibérica de Aracnología:
- Utilization of the higher taxa surrogacy approach for spiders (Aranaeae) in pear orchards in Portugal. –Revista Ibérica de Aracnología.
Index
Abstract...1
Introduction...2
Ground-dwelling spiders (Araneae) in pear orchards under three agricultural management systems in Portugal: analysis of abundance and diversity...3
Introduction...3
Material and Methods...4
Results ...5
Discussion...10
Acknowledgments...12
References ...12
Utilization of the higher taxa surrogacy approach for spiders (Aranaeae) in pear orchards in Portugal...15
Introduction...15
Material and Methods...16
Results ...16
Discussion...18
Acknowledgments...19
References ...19
Checklist of spiders (Araneae) detected in pear orchards in Portugal ...21
Introduction...21
Material and Methods...21
Results ...22 Discussion...30 Bibliography ...31 Conclusion ...34 References...35 Acknowledgments...36
ABSTRACT
Along six months, we studied the ground dwelling spider communities of six pear orchards, under different management agricultural practices: Conventional Agriculture (CA1 and CA2), Integrated Pest Management (IPM1 and IPM2) and Organic Agriculture (OA1 an OA2).
A high number of specimens was collected and two new species were recorded to the portuguese arachnofauna.
No significant differences were found in spiders diversity and abundance between the different management practices. Analysing the orchards themselves, differences were found between some of them. CA2 and IPM1 orchards had a high abundance of individuals, specially of some species, while at OA and IPM2 orchards, species abundance was more equitable. CA1 presented high diversity and abundance of spiders.
We concluded that spiders react strongly to environmental characteristics of orchards. The existence of habitat diversity around the orchards, allows spider movement from the agricultural fields during pesticide applications and posterior return after it. Thus, the presence of ecological infrastructures is of major importance in the maintenance of the spider’s community.
We also tested the use of higher taxa surrogacy approach for spiders in this kind of agroecosystems. This approach is an effective and less expensive way to assess biodiversity. We concluded that to evaluate species’ richness, genera can be used as higher taxa surrogate with reasonable accuracy.
INTRODUCTION
Agriculture is a human activity which makes great use of terrestrial ecosystems. Land occupation associated with wrong use of pesticides has lead to serious environmental issues (Amaro, 2003; Norris et al. 2003).
In the last few decades, the idea of a sustainable agriculture that could be economically viable and environmentally friendly arose in Europe and in USA (Communication from the Commission to the Council and the European Parliament, 2000).
Biodiversity is a critical component of ecosystems sustainability. Without biodiversity, ecosystems loose their ability to autoregulate, which can lead to their collapse (Duelli, 1999; Altieri, 1999). Consequently, biodiversity assessment is a fundamental issue on sustainable agriculture (Paoletti, 1999).
In Portugal, one of the measures adopted towards a sustainable agriculture was the implementation of AGRO Program, in the year 2000. The project AGRO 545, aimed to contribute to the development of environmental friendly practices in agroecosystems, through the use of adequate environmental indicators (Medida 8.1 do Programa AGRO, 2003). One group tested as a possible indicator was spiders (Araneae: Arachnida).
Spiders are a very important group of generalist predators, since they can keep pests at low density levels, contributing to the agroecosystem regulation (Marc et al., 1999). Their abundance and diversity are affected by pesticide use (Bostanian, 1984; Pekár, 1999a) and the environmental characteristics of the agroecosystem (Bogya & Markó, 1999; Marc et al., 1999; Pekár, 1999c).
Consequently, to test the possible use of spiders as bioindicators in agroecosystems, it was necessary to learn more about their community dynamics under the different agricultural management practices implemented in Portugal – Organic Agriculture, Integrated Pest Management and Conventional Agriculture.
Biodiversity evaluation is usually made by knowing the number of species. However this procedure is rather time consuming, difficult and expensive. The use of higher taxa surrogacy is an approach already used in other taxonomical groups, which allows a much faster and less expensive assessment of biodiversity (Gaston & Williams, 1993). Spiders as bioindicators could be used much more diligently if applying the higher taxa surrogacy approach.
The study presented here was conducted in pear orchards in the “Oeste” region of Portugal and had the following objectives:
- To identify the species presented in those ecosystems;
- To evaluate the effect of three different agricultural management systems in spider’s community;
- To test the use of higher taxa surrogacy approach of spiders in agroecosystems studied.
GROUND-DWELLING SPIDERS (ARANEAE) IN PEAR ORCHARDS UNDER THREE AGRICULTURAL MANAGEMENT SYSTEMS IN PORTUGAL: ANALYSIS
OF ABUNDANCE AND DIVERSITY
Catarina A. Tavaresa,b, *, Ana F. Gouveia c, Nuno G. Oliveirab,c, Célia Mateusa & Maria T. Rebelob
aINRB-IP, Instituto Nacional dos Recursos Biológicos, Av. da República, Quinta do Marquês, Nova
Oeiras, 2784-505 Oeiras; bDepartamento de Biologia Ambiental, Faculdade de Ciências da Universidade
de Lisboa, Rua Ernesto Vasconcelos, Ed. C2, Campo Grande 1749-016 Lisboa; and cAmBioDiv ~ Valor
Natural, Lda, R. Filipe da Mata, 10, 1º Frente,1600-071 Lisboa.
*corresponding author: catarina.a.tavares@gmail.com
ABSTRACT: During six months, we studied the effect of three agricultural management systems -
Conventional Agriculture (CA), Integrated Pest Management (IPM) and Organic Agriculture (OA) –on the ground dwelling spider community, in six pear orchards, using pit-fall traps. No significant differences were found in spiders diversity and abundance between the different management practices. However significant differences were found in spiders abundance between orchards CA1 and IPM2, and in spiders diversity between orchards CA1 and CA2. It is suggested that differences are mainly due to environmental characteristics of the orchards and not to management practices. The existence of habitat diversity around the orchards, allows spiders movement away from the orchards during pesticide applications and posterior return after it. At CA and IPM orchards some species were much more abundant than others, while at OA orchards, species abundance was more equitable. One CA orchard presented high abundance and diversity of spiders. Under different management practices, spiders react more strongly to environmental characteristics of orchards, than to the management practices. Thus, the presence of ecological infrastructures is of major importance in maintaining spiders diversity and abundance.
Key-words: spiders, orchards, agricultural management practices, migration INTRODUCTION
Spiders are one of the most important arthropods group in agroecosytems. They colonize almost all habitats and have great ability in resisting to adverse ecological conditions. Although spiders are generalist predators, they can be seen as a group of specialised predators, if their different ecological niches are taken into account (Marc & Canard, 1997). Therefore, spiders are extremely important in maintaining pests’ densities at low levels, having an important role in pest limitation in agroecosystems (Marc et al., 1999).
Several studies demonstrated that spiders are sensitive to pesticides (Legner & Oatman, 1964; Bostanian et al., 1984; Pekár, 1999b). Studies conducted in agroecosystems presented higher abundance and diversity of spiders in Organic Agriculture or Integrated Pest Management plots than on Conventional ones (Marc et al., 1999). However spider species are not all affected in the same way. Each spider guild has its own way of exploring the environment and pesticide impact will differ according to it (Legner & Oatman, 1964; Pekár, 1999b; Uetz et al., 1999).
Spiders densities are influenced by a multitude of different factors, some inherent to the pesticide and the conditions in which it is applied, others regarding the environmental characteristics of the agroecosystem (Bogya & Markó, 1999; Marc et al., 1999; Pekár, 1999a).
Landscape diversity is an important factor to spider communities (Isaia et al., 2006). Spiders depend on the surrounding habitat vegetation, shrub and herbaceous layer, since these structures can act as refugee areas (Alderwireldt, 1989; Samu et al., 1999). Habitat diversity around the fields enhances migration from the orchard’s surroundings, allowing recolonization of the agroecosystem (Bishop & Riechert, 1990; Bogya & Markó, 1999; Bogya et al, 2000).
Spiders have been considered as bioindicadors at the population and community level, because of their high densities in a multitude of habitats, their quick response to environmental chances and their specific ecological demands towards their natural habitat (Marc et al., 1999).
Few studies on spiders have been carried out in orchards. The first ones were carried out in England (Chant, 1956), Canada (Specht & Dondale, 1957; Dondale et al., 1979) and California (Legner & Oatman, 1964). Recently, some studies were carried out in Europe (Marc & Canard, 1997; Bogya & Markó, 1999; Pekár, 1999a).
In Portugal spider’s knowledge on agroecosystems is very poor: many spider species still remain to be described and there is a great difficulty in this taxon identification, given the scarce information available (Cardoso, 2004). There are some studies on spiders in citrus orchards (Ribeiro, 2004) and in vineyards (Nobre, 1998), but none in pear orchards. Since spiders seem to be among the most abundant generalist predators occurring in orchards (Jenser et al., 1999), it’s relevant to enhance our knowledge on the spider fauna of portuguese agroecosystems.
In Portugal, three management agricultural types are implemented: Conventional Agriculture (CA) which uses broad-spectrum pesticides applied rigidly at certain establish periods, Integrated Pest Management (IPM) which uses chemical control and other control measures, preferring selective pesticides and Organic Agriculture (OA), where no synthetic pesticides are applied (Amaro, 1982, 2003; Frescata, 2004).
The objective of this study was to evaluate the effect of three different management systems on ground-dwelling spiders in pear orchards in the “Oeste” region of Portugal. It is also a contribution to the knowledge of orchard’s spider fauna and the reasons that can lead to spider’s communities’ maintenance in pear orchards.
MATERIAL AND METHODS
Sites. Work took place in six pear orchards in the Oeste region of Portugal. Two orchards of each type of production were chosen: Organic Agriculture (OA1 and OA2), Integrated Pest Management (IPM1 and IPM2) and Conventional Agriculture (CA1 and CA2). OA1 orchard (0.6 ha), in Vilar village, was situated in the backyard of a house, surrounded by a non-cultivated field and orchards, a vineyard and vegetable plots. It was bordered by wildflower strips and a stone wall covered with weeds. Vegetation covered the intertree-strips. OA2 (1ha), in Freiria village was also located in the backyard of a house. It was bordered by a road and shrub hedges, surrounded by vineyard, orchards and a non-cultivated field. It had wildflower strips along the field edge, intertree-strips with cover plants and botanically rich alleyways. IPM1 (3.5 ha), near Caldas da Rainha city, was situated in a valley, surrounded by pine trees, eucalyptus and river vegetation, and bordered by other orchards (pear and apple). It had wildflower strips along the orchard edges, botanically rich alleyways and vegetation covering the intertree-strips. IPM2, in Peral village (3 ha) was bordered by a road, a small brook with riparian vegetation, wildflowers strips, hedges trees and shrubs, and was surrounded by orchards and non-cultivated fields. Vegetation covered the intertree-strips. CA1 (0.1ha), also in Peral village, was situated above a valley, bordered by vegetable crops, weeds, apple trees, and piles of dried plants (canes). It was bordered in one side by a wooden wall with a nearby grassland field. Intertree-strips were covered with plants. CA2 (4 ha), in Vermelha village, was situated in a valley, bordered by other pear orchards, riparian vegetation, wildflowers stripes, shrubs and tree hedges. Intertree-strips were covered with plants. Nearby run a small brook. It was surrounded by pine trees and eucalyptus. Vegetation covered the intertree-strips.
Sampling. Sampling occurred from August to November 2006 and from April to June 2007. In the first sampling period, there was no pesticide application and in the second one, pesticides were regularly applied (Table 1).
Pit-fall traps (10 cm diameter) were used to collect spiders. Ten pit-falls were used in each field, along the intertree-strips, separated by 5 meters. They had 30% ethylene glycol inside and were emptied every two weeks. A plywood square was placed as a roof, allowing spiders to crawl, but avoiding the accumulation of debris. The liquid content was filtered with a filter paper and the solid content was stored in 75% alcohol. Spiders were later separated from the remaining material in laboratory and stored in 70% alcohol and glycerine.
Adults were identified up to species level, with few exceptions using identification keys (Simon, 1914, 1926, 1929, 1932, 1937; Roberts, 1985, 1987, 1995; Barrientos, 2003).
Statistical analysis. Kruskal-Wallis tests (STATISTICA 7.0) were used to compare abundance and species richness of spiders between orchards (OA1, OA2, IPM1, IPM2, CA1, and CA2). The two sampling periods were analysed together and separately. Spiders communities were characterised by their species diversity, abundance and equitability. Two indexes were used to analyse these parameters: Shannon-Wiener function (H’) and Equitability index (H’/Hmax) (Krebs, 1989; Pité & Avelar, 1996).
Patterns in assemblage structure were quantified by the Principal Component Analysis (PCA) using the CANOCO 4.5 software (Ter Braak & Smilauer, 2002). A linear method of ordination was used because a preliminary detrended correspondence analysis (DCA), not presented here, showed turnovers <2SD which is the recommended criterion for choosing linear versus uni-modal models (Leps & Smilauer, 2005). The PCA was carried out on the inter-species correlation matrix. Counts of individual spider species at sampling sites were used to build the species abundance matrix (Table 2). Correlation coefficients were used to identify the maximal contribution of each species in the first two PC axes (Leps & Smilauer, 2005). Species with coefficients less than |0.6| were not included in PCA plots.
RESULTS
In this study, 1288 adult spiders were collected in pit-fall traps. Fifteen families, 49 genera, 64 species and morphospecies were identified (Table 2). Three families represented more than 50% of the specimens sampled: Gnaphosidae (47%), Lycosidae (18%) and Linyphiidae (15%). The two most abundant species were: Zelotes aeneus (Simon, 1878) (32%) and Alopecosa albofasciata (Brullé, 1832) (13%) (Fig.1). Z. aeneus was the most abundant species in IPM1, IPM2 and CA2, while A. albofasciata was the most abundant species in OA1, OA2 and CA1 (Fig.1). The highest number of spiders was caught in the orchard IPM1, with 367 adult individuals, followed by CA1 and CA2 (Table 2).
Analysing spiders individuals abundance along the time (Fig. 2a), in the first sampling period (August-November 2006), the number of captured individuals was higher in August and September in IPM and CA orchards. In the case of CA2 orchard, higher abundance was maintained until October. In the case of OA orchards, abundance was relatively low and stable along the time (a pattern followed also by IPM2). During the second sampling period (April-June 2007), abundance was high in late April, and mostly in the beginning of May for all orchards, although are different levels of abundance.
In relation to species abundance along time (Fig. 2b), data from the first sampling period indicate that, in general, diversity was higher during August and September with peaks of abundance in those months for the CA and IPM orchards. In relation to OA orchards, diversity was less variable along the time. In relation to the second sampling period, all orchards had a similar variation in their species abundance, except OA2: species abundance
2007 OA1 OA2 IPM1 IPM2 CA1 CA2 10 April copper hydroxide sulphur sulphur flusilazole difenoconazol captan cyprodinil captan ciprodinil
16 April sulphur cyprodinil
difenoconazol thiram flusilazol chlorpyrifos flusilazole captan glyphosate teflunenzuron difenoconazol mancozeb 1 May sulphur
copper hydroxide sulphur
flusilazole dodine abamectin mineral oil chlorpyrifos abamectin minerail oil thiram tebuconazole fluquinconazol pirimetanil captan methidation difenoconazol captan chlorpyrifos 14 May sulphur
copper hydroxide sulphur kresoxim-methyl thiram
fluquinconazole pyrimethanil chlorpyrifos bitertanol dodine captan flusilazole glyphosate diazinon thiram flusilazole 29 May tebuconazole bitertanol dodine thiacloprid thiram kresoxim-methyl abamectin diazinon tebuconazole glyphosate tetraconazole thiram teflunenzuron 11 June sulphur
copper hydroxide sulphur kresoxim-methyl
thiram tebuconazole difeboconazole thiacloprid thiram phosmet thiram kresoxim-methyl phosmet captan thiacloprid 0% 20% 40% 60% 80% 100%
OA1 OA2 IPM1 IPM2 CA1 CA2
Orchards Nemesia bacelerei Alopecosa albofasciata Pardosa proxima Tenuiphantes tenuis Zelotes aeneus Zelotes tenuis
Fig. 1. Relative abundance of the individuals belonging to the six more abundant species, during the two sampling periods in the six pear orchars. OA (Organic Agricultural), IPM (Integrated Pest Management) and CA (Conventional Agriculture).
Table 1. Active substances of pesticides applied in the six pear orchards. OA (Organic Agricultural), IPM (Integrated Pest Management) and CA (Conventional Agriculture).
Family Species OA1 OA2 IPM1 IPM2 CA1 CA2
Agelenidae Malthonica lusitanica 2 0 1 0 9 0
Tegenaria atrica 1 0 0 0 0 0
Tegenaria feminea 13 2 15 4 6 0
Tegenaria montigena 0 1 3 0 1 0
Tegenaria spp 0 0 0 0 0 1
Corinnidae Phrurolithus minimus 0 0 1 0 0 0
Liophrurillus flavitarsis 0 0 0 0 2 0
Dyctinidae Dictyna civica 1 0 0 1 1 0
Altella sp. 0 0 0 0 1 0
Dysderidae Dysdera crocata 3 2 0 1 4 0
Dysdera fuscipes 5 0 0 2 2 0
Dysdera lusitanica 0 0 2 1 0 0
Harpactea spp 0 0 6 1 8 0
Rhode scutiventris 0 0 0 0 0 2
Gnaphosidae Drassodes lapidosus 0 0 0 1 2 0
Drassodes luteomicans 0 0 1 2 2 0 Gnaphosa alacris 1 1 0 0 2 0 Haplodrassus dalmatensis 0 2 1 1 1 0 Haplodrassus macellinus 2 0 3 0 2 0 Micaria pallipes 0 2 3 0 2 1 Trachyzelotes fuscipes 3 12 18 1 4 13 Setaphis carmeli 0 1 2 1 1 0 Zelotes aeneus 18 13 163 18 34 166 Zelotes civicus 0 0 1 0 1 0 Zelotes electus 0 0 1 0 0 0 Zelotes tenuis 7 12 29 11 22 6 Zelotes ruscinensis 0 1 0 1 2 0
Linyphiidae Canariphantes zonatus 0 0 0 0 1 0
Gongylidiellum vivum 0 0 0 1 0 0 Lessertia dentichelis 0 0 0 5 0 0 Microctenonyx subitaneus 0 0 0 5 0 0 Prinerigone vagans 0 0 0 1 0 0 Palliduphantes stygius 32 2 5 5 18 0 Pelecopsis inedita 0 0 1 0 0 0 Tenuiphantes tenuis 19 21 27 6 22 16 Linyph.spp1 1 0 0 0 0 0 Linyph. spp2 0 0 2 0 0 0 Meioneta spp. 1 0 1 0 0 0
Liocranidae Agraecina lineata 1 3 5 1 0 1
Agroeca brunnea 0 0 1 0 0 0
Lycosidae Alopecosa albofasciata 41 34 22 8 60 7
Arctosa excellens 0 0 0 3 0 0 Hogna radiata 0 1 0 0 4 0 Pardosa proxima 3 10 30 2 1 4 Pardosa hortensis 1 3 0 0 0 0 Pardosa pullata 0 0 0 0 1 0 Trochosa ruricola 0 1 0 0 0 0
Nemesiidae Nemesia bacelerei 0 0 0 0 41 0
Pisauridae Pisaura mirabilis 4 0 0 0 0 0
Table 2. Spiders species sampled in the six orchards (total number of adults) of Organic Agriculture (OA), Integrated Pest Management (IPM) and Conventional Agriculture (CA).
Family Species OA1 OA2 IPM1 IPM2 CA1 CA2
Salticidae Euophrys herbigrada 1 0 0 0 1 0
Euophrys sulphurea 1 0 1 0 0 0
Evarcha jucunda 0 0 1 0 0 0
Phlegra fasciata 1 0 1 0 1 0
Pseudeuophrys erratica 0 0 0 1 0 0
Talavera aequipes 0 0 0 0 1 0
Titanoecidae Nurscia albomaculata 0 1 4 1 1 1
Theridiidae Robertus arundineti 1 0 0 0 0 2
Robertus spp. 0 0 0 1 0 0
Theridion spp. 0 0 0 0 1 0
Thomisidae Ozyptila bicuspis 1 0 1 3 3 20
Ozyptila pauxilla 7 2 5 0 13 10
Xysticus kochi 0 0 0 1 0 0
Xysticus nubilus 1 0 0 0 0 0
Zodariidae Zodarion atlanticum 0 1 10 0 2 1
Total number of individuals 172 128 367 90 280 251
Total number of species 27 22 32 29 37 15
Fig.2. a. Seasonal variation in spiders abundance in six pear orchards; b. Seasonal variation in the number of spider species in six pear orchards. OA (Organic Agricultural), IPM (Integrated Pest Management), and CA (Conventional Agriculture). 0 2 4 6 8 10 12 1 7 .8 .0 6 3 1 .8 .0 6 1 8 .9 .0 6 2 .1 0 .0 6 1 8 .1 0 .0 6 6 .1 1 .0 6 2 0 .1 1 .0 6 1 6 .4 .0 7 1 .5 .0 7 1 4 .5 .0 7 2 9 .5 .0 7 1 1 .6 .0 7 2 5 .6 .0 7 N u m b e r o f s p e c ie s OA1 OA2 IPM1 IPM2 CA1 CA2 0 10 20 30 40 50 60 70 80 1 7 .8 .0 6 3 1 .8 .0 6 1 8 .9 .0 6 2 .1 0 .0 6 1 8 .1 0 .0 6 6 .1 1 .0 6 2 0 .1 1 .0 6 1 6 .4 .0 7 1 .5 .0 7 1 4 .5 .0 7 2 9 .5 .0 7 1 1 .6 .0 7 2 5 .6 .0 7 N u m b e r o f in d iv id u a ls OA1 OA2 IPM1 IPM2 CA1 CA2 a) b) (continuation of table 2 )
increased in the beginning of May and again by the end of that month and beginning of June, except for OA2, which had an opposite pattern of variance.
Concerning Kruskal-Wallis analysis, no significant differences were found between orchards in spiders abundance in the first sampling period (p>0.05). In the second sampling period, significant differences (p=0.025) were found between orchards IPM2 and CA1, which had the lowest (6.67) and the highest (25.17) abundance, respectively, and the same was obtained when the two sampling periods were analysed together (p=0.032) (Table 3) (a mean of 22.08 individuals for CA1 and 7.00 individuals for IMP2).
No significant differences were found in the number of species between orchards in the first sampling period. Significant differences were detected between the orchards CA1 and CA2 in the first sampling period (p=0.0114) and when the two periods were analysed together (p=0.0224) (Table 3). In the second sampling period and in the two periods together the highest mean number of species was found in CA1 (7.67 and 6.46 respectively), while CA2 showed the lowest one (4.17 and 3.23 respectively).
Shannon-Wiener index was higher in IPM2 and CA1 orchards, which then presented higher diversity. AC2 had the lower Shannon-Wiener index (Table 4).
Equitability indexes were high (>0.70) in OA1, OA2, IPM2 and CA1 (Table 4). The OA orchards had a very close equitability index, although the sampled species were different. IPM2 presented the highest equitability index and IPM1 and CA2 had the lowest equitability indexes.
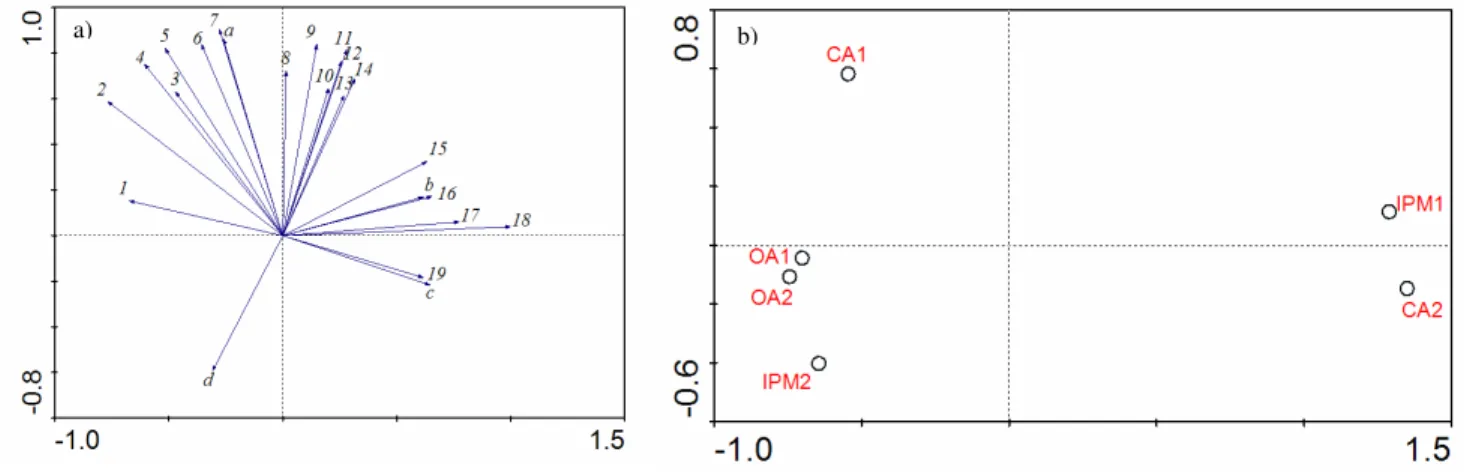
Concerning PCA analysis, the first two axis accounted for 93.5% of all the variation in the spider species abundance matrix (Fig. 3a). The first PC axis (84.4%) highlighted a gradient of variation in the abundance of Dyctina civica (Lucas, 1850), Dysdera crocata (C. L. Koch, 1838), Gnaphosa alacris (Simon, 1878) to Zodarian atlanticum (Pekár & Cardoso, 2005); Phrurolithus minimus (C. L. Koch, 1839) Zelotes electus (C. L. Koch, 1839); Agroeca brunnea (Blackwall, 1833); Linyph. spp2; Pelecopsis inedita (O. P.-Cambridge, 1875); Evarcha jucunda (Lucas, 1846); Nurscia albomaculata (Lucas, 1846); Trachyzelotes fuscipes (L. Koch, 1866), Zelotes aeneus (Simon, 1878), Ozyptila bicuspis (Simon, 1932), Tegenaria spp.; Rhode scutiventris (Simon, 1882).
The second PC axis (9.1%) highlighted a gradient of variation in the abundance of Lessertia dentichelis (Simon, 1884); Gongylidiellum vivum (O. P.-Cambridge, 1875); Pseudeuophrys erratica (Walckenaer, 1826); Microctenonyx subitaneus (O. P.-Cambridge, 1875); Arctosa excellens (Simon, 1876); Robertus spp.; Xysticus kochi (Thorell, 1872) to Alopecosa albofasciata (Brullé, 1832); Hogna radiata (Latreille, 1817); Malthonica lusitanica (Simon, 1898); Phlegra fasciata (Hahn, 1826); Harpactea spp.; Haplodrassus macellinus (Thorell, 1871); Zelotes civicus (Simon, 1878); Ozyptila pauxilla (Simon, 1870); Zelotes tenuis (L. Koch, 1866); Tenuiphantes tenuis (Blackwall, 1852) (Fig. 4a).
Overall, assemblages could be separated in three clusters: orchards IPM1 and CA2, showing high scores in axis 1; orchards OA1, OA2 and IPM2 showing low scores in both axis 1 and 2, and orchard CA1 showing high scores in axis 2 (Fig.3b).
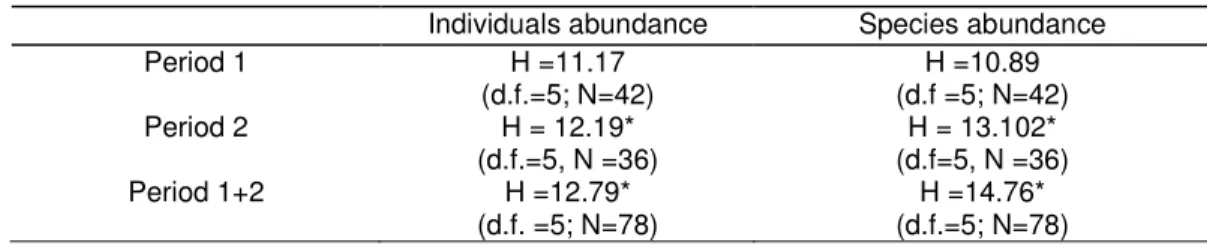
Individuals abundance Species abundance
Period 1 H =11.17 (d.f.=5; N=42) H =10.89 (d.f =5; N=42) Period 2 H = 12.19* (d.f.=5, N =36) H = 13.102* (d.f=5, N =36) Period 1+2 H =12.79* (d.f. =5; N=78) H =14.76* (d.f.=5; N=78)
Table 3. Kruskal-Wallis test for spiders abundance and species richness in the six orchards. Period 1 (First sampling period), Period 2 (Second sampling period), Period 1+2 (The two sampling periods together).
DISCUSSION
Most spiders sampled in the six pear orchards studied belong to only three families: Gnaphosidae (47%), Lycosidae (18%) and Linyphiidae (13%). Lycosidae and Gnaphosidae are hunting spiders that colonize agroecosystems by ground movement from adjacent habitats. Linyphiidae are sheet-web-building spiders that colonize agroecosystems through ballooning from adjacent and distant habitats (Bishop & Riechert, 1990; Uetz et al., 1999). These three families were found to be dominant in pit-fall traps in orchards, in other studies (Miliczky et al., 2000; Samu & Szinetár, 2002; Pekár, 2003).
No differences were found between spider’s communities under different management practices. At least it would be expected that OA orchards would be different from CA and IPM since no pesticides were applied there.
Analysing orchards, significant differences were only found in the second sampling period and when the two periods were tested together, regarding orchards CA1, CA2 and
Indexes OA1 OA2 IPM1 IPM2 CA1 CA2
Shannon-Wiener (H') 3.58 3.45 3.28 4.15 3.94 2.01 Equitability index ( H'/Hmax) 0.75 0.77 0.65 0.85 0.75 0.50
Table 4. Shannon-Wiener and Equitability Indexes for spider communities of the different orchards. Organic Agriculture (AO), Integrated Pest Management (IPM) and Conventional Agriculture (CA).
Fig. 4. Ordination diagram of the Principal Component Analysis of spiders abundance in the six orchards.
a) Factor loading biplot (correlation axis > |0.6|). Axis 1 horizontal, axis 2 vertical. Species: 1: Dictyna civica; 2: Dysdera
crocata; 3: Euophrys sulphurea; 4:Gnaphosa alacris; 5: Alopecosa albofasciata; 6:Hogna radiata; 7: Malthonica lusitanica; 8: Phlegra fasciata; 9: Harpactea spp. 10: Haplodrassus macellinus; 11:Zelotes civicus; 12: Ozyptila pauxilla;
13: Zelotes tenuis; 14: Tenuiphantes tenuis; 15: Zodarion atlanticum; 16: Nurscia albomaculata; 17: Trachyzelotes
fuscipes; 18: Zelotes aeneus; 19: Ozyptila bicuspis. Lists of species which are too close to distinguish between,
represented by letters: a. Liophrurillus flavitarsis; Theridion spp.; Pardosa pullata; Altella spp.; Talavera aequipes;
Nemesia bacelerei; Canariphantes zonatus. b. Phrurolithus minimus; Zelotes electus; Agroeca brunnea; Linyph. spp2; Pelecopsis inedita; Evarcha jucunda. c. Tegenaria spp.; Rhode scutiventris. d.Lessertiadentichelis; Gongylidiellum
vivum; Pseudeuophrys erratica; Microctenonyx subitaneus; Arctosa excellens; Robertus spp.; Xysticus kochi.
Fig.4b. Site score biplot. Axis 1 horizontal, axis 2 vertical.
Organic Agriculture (AO), Integrated Pest Management (IPM) and Conventional Agriculture (CA).
IPM2. Differences in spiders community were only found in the second sampling period and not in the first one, which can be attributed to pesticide application.
Based on PCA analysis we defined three orchard clusters, each one presenting a similar spider species assemblages: IPM1 and CA2; OA1, OA2 and IPM2; and CA1. These clusters did not reflect orchards management practices. Other factors, like the environmental characteristics of the orchards, are suggested to explain the differences in spider’s communities.
The cluster of IPM1 and CA2 in the PCA may be due to the high presence of Z. aeneus in high abundance on both orchards. Like most nocturnal hunting spiders Z. aeneus, has two characteristics that may account for it’s presence in this agroecosystem in such high number: a great mobility potential which allows them to vacate locally disturbed areas and re-invade them later (called the cyclic colonization strategy) and a lower exposure to pesticide effect, since during the day they hide under stones and grass (Alderweireldt, 1989; Pekár, 1999a; Rypstra et al., 1999; Samu et al., 1999; Miliczky et al., 2000; Samu & Szinetár, 2002; Pekár & Haddad, 2005). The present of such an abundant species represents a less diverse ecosystem which is confirmed by the lower values in Shannon-Winner and Equitability indexes.
High diversity of species was found in orchards OA1, OA2 and IPM2, which is supported by the values of Shannon-Wiener indexes (>3.40). None of the more abundant species – Alopecosa albofasciata, Z. aeneus and Tenuiphantes tenuis – was found in high presence in these orchards. Despite the low abundance of individuals, there’s a certain equilibrium not presented in the anterior orchards, a high equitability index (>0.70), and a certain community stability through time.
CA1 formed a single cluster in the PCA analysis, due to its unique characteristics. It presented high spiders abundance and diversity. Some species like Liophrurillus flavitarsis (Lucas, 1846); Pardosa pullata (Clerck, 1757); Altella spp; Talavera aequipes (O. P.-Cambridge, 1871) and Nemesia bacelerei (Decae et al., 2007) were only found on this orchard. Alopecosa albofasciata, one of the most abundant species was present in high numbers. This species has the same colonization characteristics of Z. aeneus. CA1 seems to offers the optimal conditions for spider’s recolonization (Samu et al., 1999) since there’s a mosaic of microhabitats surrounding the orchard that provide shelter when pesticides are “active” on the orchard. Also, the orchard small size facilitates spider’s quick migration (Rypstra et al., 1999, Samu et al., 1999, Boller et al., 2004).
In this study we proposed that abundance and diversity of spiders were more affected by vegetation structure, orchard area, surrounded field habits and edge effect, than by agriculture management practices. Other studies reached the same conclusions (Pékar, 1999c; Miliczky et al., 2000; Schmidt et al., 2005).
The high abundant communities presented in IPM1 and in both CA orchards compared with the low abundant but more stable populations from the OA orchards are in accordance with the hypothesis proposed by Schmidt et al., 2005. This author supports the idea that organic fields keep a more self-sustained population while spider community in conventional field is mainly due to migration. No explanation can be advanced for the stable population found in IPM2, except migration from the surroundings.
Since spiders are among the most abundant generalist predators in orchards (Jenser et al., 1999), and can keep pests at low densities (Mark et al., 1999), it seems that increasing ecological infrastructures and habitat diversity around the orchards can be an important pest management practice.
Acknowledgements
To Prof. Filomena Magalhães (FCUL) for all the help in the statistical part. To Prof. Elizabete Figueiredo (ISA/UTL) for all the help in pesticide analysis To Luís Crespo (FCTUC) for all the help in spider identification.
References
Alderwireldt, M.,1989. An ecological analysis of the spider fauna (Araneae) occurring in maize fields, Italian ryegrass fields and their edges zones, by means of different multivariate techniques. Agriculture, Ecosystems and Environment 27:293-306.
Amaro, P. 1982. A Protecção Integrada em Agricultura. CNA, Lisboa. Amaro, P. 2003. A Protecção Integrada. ISA Press, Portugal.
Barrientos, J.A. 2003. I Curso Prático de Aracnologia – Taxonomia de arañas ibéricas. Grupo Ibérico de Aracnología. Jerez de la Frontera.
Bishop, L. & S.E. Riechert. 1990. Spider colonization of agroecosystems: mode and source. Environmental Entomology 19 (6):1738-1745.
Bogya S. & V. Markó. 1999. Effect of pest management systems on ground-dwelling spiders assemblages in an apple orchard in Hungary. Agriculture, Ecosystems and Environment 73:7-18.
Bogya S., V. Markó, Cs. Szinetár. 2000. Effect of pest management systems on foliage and grass-dwelling spiders communities in an apple orchard in Hungary. International Journal of Pest Management 46(4):241-250.
Boller E.F., F. Häni & H. Poehling. 2004. Ecological Infrastructures: Ideabook on functional biodiversity at the farm level Temperate Zones of Europe. LBL, CH.8315 Lindau, Switzerland.
Bostanian N.J., C.D. Dondale, M.R Binns & D. Pitre. 1984. Effects of pesticide use on spiders (Aranae) in Quebec apple orchards. Canadian Entomologist 116:663-675.
Braak, C.J.F. ter; Smilauer, P. 2002. CANOCO Reference Manual and CanoDraw for Windows User's Guide: Software for Canonical Community Ordination (version 4.5)
Chant, D.A. 1956. Predaceous spiders in orchards in southeastern England. Journal of Horticulture Science 31:35-36
Cardoso, P. 2004. The use of arachnids (Class Arachnida) in biodiversity evaluation and monitoring of Natural Areas. Tese de doutoramento em Biologia (Ecologia e Biossistemática) pela Faculdade de Ciências da Universidade de Lisboa.
Cardoso, P. 2007. Portugal spider catalogue (v1.3). Available online at http://www.ennor.org/catalogue.php (viewed in December 2007)
Decae A., P. Cardoso & P. Selden. 2007. Taxonomic Review of the Portuguese Nemesiidae (Araneae, Mygalomorphae). Revista Ibérica de Aracnología 14:1-18.
Dondale, C.D., B. Parent & D. Pitre. 1979. A 6-year study of spiders (Araneae) in a Quebec apple orchard. Canadian Entomologist 111:377-380.
Frescata, C. 2004. Protecção contra pragas sem luta química. Publicações Europa-América, Portugal.
Isaia M., F. Bona & G. Badino. 2006. Influence of landscape diversity and agricultural practices on spider assemblage in italian vineyard of Langa Astigiana (Northwest Italy). Environmental Entomology 35(2):297-307.
Jenser G., K. Baláz, Cs. Erdélyi, A. Haltrich, F. Kádár, F. Kozár, V. Markó, V. Rácz & F. Samu. 1999. Chances in arthropod population composition in IPM apple orchards under
continental climatic conditions in Hungary. Agriculture, Ecosystems and Environment 73:141-154.
Krebs, C. 1989. Ecological Methodology. University of British Columbia, Harper Collins Publishers.
Legner, E.F. & E.R. Oatman. 1964. Spiders on apple in Wisconsin and their abundance in a natural and two artificial environments. Canadian Entomologist 96:1202-1207.
Leps & Smilauer. 2005. Multivariate analysis of ecological data using CANOCO.Cambridge. University Press.
Marc, P. & A. Canard. 1997. Maintaining spider biodiversity in agroecosystems as a tool in pest control. Agriculture, Ecosystems and Environment 62: 229-235.
Marc, P., A. Canard & F. Ysnel. 1999. Spiders (Araneae) useful for pest limitation and bioindication. Agriculture, Ecosystems and Environment 74:229-273
Miliczky, E.R., C.O. Calkins & D.R. Horton. 2000. Spider abundance and diversity in apple orchards under three insect pest management programmes in Washington State, U.S.A. Agriculture and Forest Entomology 2:203-215.
Nobre, T. 1998. A aracnofauna na vinha. Relatório de estágio profissionalizante em Biologia Aplicada aos Recursos Animais Terrestres. Faculdade de Ciências da Universidade de Lisboa. Pekár, S. 1999a Effect of IPM practices and conventional spraying on spider population
dynamics in an apple orchard. Agriculture, Ecosystems and Environment 73:155-166.
Pekár, S. 1999b. Foraging mode: a factor affecting the susceptibility of spiders (Araneae) to insecticide applications. Pesticide Science 55:1077-1082.
Pekár, S. 1999c. Side-effect of integrated pest management and conventional spraying on the composition of epigeic spiders and harvestmen in an apple orchard (Araneae, Opiliones). Journal of Applied Entomology 123:115-120.
Pekár, S. 2003. Chances in the community of epigeal spiders and harvestmen (Araneae, Opiliones) with the age of an apple orchard. Plant Soil and Environment 49 (2): 81-88.
Pekár, S. & C. R. Haddad. 2005. Can agrobiont spiders (Araneae) avoid a surface with pesticide residues? Pest Management Science 61:1179-1185.
Pité, M.T., T. Avelar. 1996. Ecologia das Populações e das Comunidades. Uma abordagem evolutiva do estudo da diversidade. Fundação Calouste Gulbenkian, Lisboa.
Ribeiro, C. S. P. 2004. Aracnofauna associada a pomares de limoeiros com três modalidades de gestão da flora adventícia e a limitação natural das pragas de citrinos. Relatório do Trabalho de Fim de Curso de Engenharia Agronómica.
Roberts, M.J. 1985. The spiders of Britain & Northern Europe – Atypidae to Theridiosomatidae. Harper-Collins Publishers, London. 32
Roberts, M.J. 1987. The spiders of Britain & Northern Europe – Linyphiidae and Check List. Harper-Collins Publishers, London.
Roberts, M.J. 1995. Spiders of Britain & Northern Europe – A field guide. Harper-Collins. Publishers, London.
Rypstra, A., P.E. Carter, R.A. Balfour & S.D. Marshall. 1999. Architectural effects of agricultural habitats and their impact on the spider inhabitants. The Journal of Arachnology. 27:371-377.
Samu F., K.D., Sunderland & Cs. Szinetár. 1999. Scale-dependent dispersal and distribution patterns of spiders in agricultural systems: a review. The Journal of Arachnology 27:325-332. Samu F. 1999. Chances in arthropod population composition in IPM apple orchards under continental climatic conditions in Hungary. Agriculture, Ecosystems and Environment 73:141-154.
Samu, F. & Cs. Szinetár. 2002. On the Nature of Agrobiont Spiders. The Journal of Arachnology 30:389-402.
Schmidt M.H, I. Rochewitz, C. Thies & T. Tscharnteke. 2005. Differential effects of landscape and management on diversity and density of ground-dwelling farmland spiders. Journal of Applied Ecology 42:281-287.
Simon, E. 1914. Les arachnides de France. Synopsis générale et catalogue des espèces françaises de l'ordre des Araneae; 1re partie, 6:1-308.
Simon, E. 1926. Les arachnides de France. Synopsis générale et catalogue des espèces françaises de l'ordre des Araneae; 2e partie, 6:309-532.
Simon, E. 1929. Les arachnides de France. Synopsis générale et catalogue des espèces françaises de l'ordre des Araneae; 3e partie, 6:533-772.
Simon, E. 1932. Les arachnides de France. Tome VI. Synopsis générale et catalogue des espèces françaises de l'ordre des Araneae; 4e partie, 6:773-978.
Simon, E. 1937. Les arachnides de France. Tome VI. Synopsis générale et catalogue des espèces françaises de l'ordre des Araneae; 5e et derniére partie, 6:979-1298.
Specht, H.B. & C.D. Dondale, 1957. Spider population in New Jersey apple orchard. Journal of Economic Entomology 53:810-814.
Uetz, G.W., J. Halaj, B.C. Alan. 1999. Guild structure of spiders in major crops. The Journal of Arachnology 27:270-280.
UTILIZATION OF THE HIGHER TAXA SURROGACY APPROACH
FOR SPIDERS (ARANEAE) IN PEAR ORCHARDS IN PORTUGAL
Catarina A. Tavaresa,b, Ana F. Gouveiac , Célia Mateusa, Maria T. Rebelob
a INRB-IP, Instituto Nacional dos Recursos Biológicos, Av. República, Quinta do Marquês,
Nova Oeiras, 2784-505 Oeiras
b Departamento de Biologia Animal, Faculdade de Ciências da Universidade de Lisboa, Rua Ernesto
Vasconcelos, Ed. C2, Campo Grande 1749-016 Lisboa
c AmBioDiv ~ Valor Natural, Lda, R. Filipe da Mata, 10, 1º Frente,1600-071 Lisboa.
Abstract:
The use of higher taxa surrogacy has been proposed as an effective and less expensive way to assess biodiversity. In agroecosystems, the evaluation of biodiversity is extremely important given its relation with their sustainability. In this study, we tested the use of higher taxa surrogacy approach for spiders in pear orchards, in the “Oeste” region of Portugal. We concluded that genera can be used as a higher taxa surrogate of specie’s richness with reasonable accuracy.
Key-Words:
Higher taxa surrogacy, spiders, agroecosystem
Introduction
In the last few years the idea of a connection between nature conservation and agriculture has increased enormously in Europe (Amaro, 2003). Several measures have been taken to implement a sustainable agriculture in European regions, and it has become of extreme importance to evaluate their effectiveness (Communication from the Commission to the Council and the European Parliament, 2000).
One way of measuring the sustainability of an agroecosystem is through the evaluation of its biodiversity (Paoletti, 1999).
Biodiversity is often measured by the number of species sampled in an ecosystem (Primack, 2002). This is a rather difficult and expensive task, especially when considering invertebrate taxa (Duelli et al., 1999; Martín-Piera, 2000). Still, since invertebrates account for more than 90% of genetic variability in agroecosystems, it seems convincing to use them as the closest correlates to overall biodiversity (Duelli, 1997).
The use of higher taxa surrogacy (order, family, genera) has been proposed by several authors as a way of measure diversity, based in the knowledge that there is a strong correlation between higher taxa richness and species richness (Gaston & Williams, 1993; Anderson, 1995; Wilkie et al., 2003).
The higher taxa approach has already been used with several different organisms (Gaston & Williams, 1993; Gaston et al., 1995; Anderson, 1995; Martín-Piera, 2000; Ricotta, 2002, Cardoso et al., 2004). The main advantage of this approach is that a large amount of information from several taxa can be obtained with lower effort and resources than when identification to the species level is used (Gaston & Williams, 1993).
Still, some limitations must be taken into account when using this approach, because several aspects can influence the relationships between species and higher taxa richness: genealogy and status of higher taxa, choice of higher taxa rank, spacial scale at which the assessment occurs, areas with unusual patterns of speciation, and sampling period. (Gaston & Williams, 1993; Andersen 1995).
Spiders are pest suppressors in agroecosystems, and so, the monitorization of their diversity seems important regarding the idea of a sustainable agriculture (Duelli, 1997; Marc & Canard, 1999).
The higher taxa approach has already been used on spider’s priority conservation areas in Portugal (Borges, 2002; Cardoso et al., 2004; Gouveia, 2004), but not yet in agroecosystems. In fact few studies in higher taxa surrogacy have been tested in agroecosystems (Duelli, 1997).
However caution must be taken. Genera identification is extremely difficult on spider; there is a lack of information on this group on Portugal; and taxonomy is continuously changing (Cardoso et al., 2004; Platnick, 2007).
In this work, the use of higher taxa surrogacy for spiders in pear orchards in the “Oeste” region of Portugal was tested.
Material and methods
The study took place in six pear orchards, in the “Oeste” region of Portugal, from June to November 2006 and April to June 2007. Two orchards of each type of agricultural management were sampled; Organic Agriculture (OA1 and OA2), Integrated Pest Management (IPM1 and IPM2) and Conventional Agriculture (CA1 and CA2).
To collect the spiders ten pit-falls traps (10cm diameter) were used in each field, along the intertree-strips, separated by 5 meter from each other.A plywood square was placed as a roof over the traps, allowing spiders to crawl, but avoiding the accumulation of debris. Pit-falls had 30% ethylene glycol inside and were emptied every two weeks. The liquid content was filtered with a filter paper and the solid content was stored in 75% alcohol. Spiders were later separated from the remaining material in laboratory and stored in 70% alcohol and glycerine. All adult specimens were identified to species or morphospecies, using identification keys (Simon, 1914, 1926, 1929, 1932, 1937; Roberts, 1985, 1987, 1995; Barrientos 2003).
Regarding the potential use of family and genus as higher taxa surrogates, we have tested a regression analysis over data from the different orchards separately and as a whole. We tested three regression models, as proposed in Borges et al. (2002): a linear model (y=a+bx), an exponential model (y =a·ebx) and a log-log model (logy=a+b·logx). Species were tested as the dependent variable, and the higher taxonomic categories as the independent variables. Determination coefficient (r2) was calculated and scatter plots were analyzed. Scatter-plots of family-species and genus-species relationships from the orchards all together are presented here. Analysis was performed with STATISTICA 7.0 and SPSS softwares.
Results
In this study 1288 adults were collected with the pit-fall traps. Fifteen families, 49 genera and 64 species and morphospecies were identified.
All the regressions tested are statistically significant (p<0.001), except an exponential one in AC2 (p=0.04) (Table 1b). Both higher taxa (family and genus) present a good relationship with species (r2>0.65), independently of the models applied. When all orchards are analyzed together, r2 is very strong (r2 > 0.90) for both higher taxa-species relationships. Still, for the different sites, there is a higher variation on r2 values in the regressions families-species analyses, than there is in the regressions genera-families-species analyses (Table 1).
Concerning the relationship species-genera, log-log model is the best fitted for most of the cases. For the relationship family-species the linear model is the best model for most cases (Table 1). When all sites were analyzed together, the linear model appeared as the strongest (highest r2) one for the relationship genus-species and the exponential model for the relationship family-species (Fig1).
Orchard Model slope Ajusted r2 p-value Linear 1.2779 0.7990 <0.001 Exponencial 0.3322 0.6842 <0.001 OA1 Log-Log 1.115 0.8637 <0.001 Linear 1.3492 0.6780 <0.001 Exponencial 0.3025 0.5739 <0.001 OA2 Log-Log 1.0606 0.6966 <0.001 Linear 2.0711 0.8050 <0.001 Exponencial 0.244 0.7540 <0.001 IPM1 Log-Log 1.2259 0.71856 <0.001 Linear 1.2799 0.6440 <0.001 Exponencial 0.2696 0.9479 <0.001 IPM2 Log-Log 0.9816 0.7145 <0.001 Linear 1.5818 0.8238 <0.001 Exponencial 0.2383 0.8217 <0.001 AC1 Log-Log 1.0327 0.7688 <0.001 Linear 1.1548 0.8860 <0.001 Exponencial 0.3904 0.6200 = 0.004 AC2 Log-Log 1.0452 0.8480 <0.001 Linear 1.5663 0.8397 <0.001 Exponencial 0.058 0.8623 <0.001 All together Log-Log 1.1465 0.8475 <0.001
Orchard Model slope Adjusted r2 p-value
Linear 0.96 0.9566 <0.001 Exponencial 0.2508 0.8389 <0.001 OA1 Log-Log 0.0256 0.9672 <0.001 Linear 1.0278 0.9280 <0.001 Exponencial 0.2322 0.8755 <0,001 OA2 Log-Log 1.0052 0.9518 <0.001 Linear 1.245 0.9582 <0.001 Exponencial 0.1467 0.9564 <0.001 IPM1 Log-Log 1.1389 0.9287 <0.001 Linear 1.0694 0.9000 <0.001 Exponencial 0.2159 0.8493 <0.001 IPM2 Log-Log 0.9486 0.9169 <0.001 Linear 1.0659 0.9280 <0.001 Exponencial 0.1598 0.9641 <0.001 AC1 Log-Log 0.9486 0.9169 <0.001 Linear 0.9458 0.8540 <0.001 Exponencial 0.2992 0.9577 <0.001 AC2 Log-Log 0.968 0.8355 <0.001 Linear 1.1006 0.9019 <0.001 Exponencial 0.0399 0.8598 <0.001 All together Log-Log 1.0513 0.8818 <0.001
Table1. a. Regression analysis between the number of species (dependent variable) and the number of genera
(independent variable) and b. Regression analysis between number of species (dependent variable) and number of families (independent variable). Organic Agriculture (OA1, OA2), Integrated Pest Management (IPM1, IPM2) and Conventional Agriculture (CA1, CA2)
a) b) 8 10 12 14 16 18 20 22 24 26 28 Genera 8 10 12 14 16 18 20 22 24 26 28 30 32 34 S p e c ie s 8 10 12 14 16 18 20 22 24 26 28 Genera 8 10 12 14 16 18 20 22 24 26 28 30 32 S p e c ie s y =1.03x-1.6188 r2=0.90919 y=5.4604e0.0562x r2 =0.8598 a) b) 4 5 6 7 8 9 10 11 12 13 Families 8 10 12 14 16 18 20 22 24 26 28 30 32 S p e c ie s 0,9 1,0 1,1 1,2 1,3 1,4 1,5 log (Genera) 0,9 1,0 1,1 1,2 1,3 1,4 1,5 1,6 lo g ( S p e c ie s ) y =0.8969x+ 0.1772 r2=0.8818 y =2.8271x-5.7444 r2=0.8397 c) d)
Discussion
The relationship between species-family and species-genera was statistically significant which is explained by Martín-Piera, 2000: an increase in higher taxa implies an increase in the number of species.
For the relationship genera-species the regression model log-log is the best fitted one. For the relationship family-species the linear model is the best fitted. According to Borges (2002), log-log model is usually the most liable model, because it normalizes residuals distribution and consequently has a more powerful statistical prediction. When all orchards were analysed together, the linear model was the most adequate for the relationship genus-species and the exponential one for the relationship family-genus-species. The same conclusion was reached by Cardoso et al., (2004) and Gouveia, (2004): the linear model has been shown to be more adequate in the relationship genus-species and the exponential one for the relationship family-species.
The taxon that best predicted species richness was the genus. According to Martín-Piera, (2000), genus explains a higher percentage of variance than the families. Also, when analyzing the different sites separately, the relationship families-species has r2 values of a
wide range, while the relationship genera-species presents more stables r2 values.
This study presents additional evidence that higher taxa can be used to predict species richness in a given area with reasonably accuracy, being the genera the best surrogate for species. Other studies reached the same conclusion(Borges, 2002; Cardoso et al., 2004; Gouveia, 2004).
One limitation of the higher taxa surrogacy approach is that genus richness may not be a reliable surrogate for species richness, when comparing different regions (Anderson, 2005). However, in Portugal this has not been observed: studies conducted in different regions presented similar results (Borges, 2002; Cardoso et al., 2004; Gouveia 2004). According to Cardoso at al. (2004), neither geographical location nor habitat type appears to have a strong influence in the higher taxa approach of spiders in Portugal.
The higher taxa surrogacy approach for spiders seems to be an interesting method to a more rapidly biodiversity assessment in agroecosystems, although other taxonomic groups should also be evaluated in order to obtain the maximal amount of information in biodiversity (Duelli et al., 1999). Identification to genus level, and posterior extrapolation through a regression model, linear or log-log appears to be the best methodology to be used in studies like the one presented here.
Fig.1. Relationship between families-species (a-c) and genera-species (d-e) of all orchards analysed together. The three models tested are presented for each situation (linear, exponential and log-log).
0,65 0,70 0,75 0,80 0,85 0,90 0,95 1,00 1,05 1,10 Families 0,9 1,0 1,1 1,2 1,3 1,4 1,5 1,6 S p e c ie s 4 5 6 7 8 9 10 11 12 13 Families 8 10 12 14 16 18 20 22 24 26 28 30 32 S p e c ie s y=4.3539e0.1639x r2 =0.8623 y =1.2575x+ 0.0847 r2=0.8475 e) f)
Acknowledgements
To Elizabete Figueiredo and Filomena Magalhães for helping on the statistical analysis. References
AMARO, P. 2003. A Protecção Integrada. ISA Press, Portugal.
ANDERSEN, A.N. 1995. Measuring more of biodiversity: genus richness as a surrogate for species richness in Australian ant faunas. Biological Conservation, 73:39-43.
BARRIENTOS, J.A. 2003. I Curso Prático de Aracnologia – Taxonomia de arañas ibéricas. Grupo Ibérico de Aracnología. Jerez de la Frontera.
BORGES, P.A.V., C. Aguiar, G. André, H. Enghoff, C. Gaspar, C. Melo, J. A. Quartau, S. P. Ribeiro, A.R.M. Serrano, L. Vieira, A. Vitorino & J. Wunderlich. 2002. Relação entre o número de espécies e o número de táxones de alto nível para a fauna de artrópodes dos Açores. In C. Costa, S.A. Vanin, J.M. Lobo & A. Melic (eds.) Hacia un proyecto CYTED para el inventario y estimación de la diversidad entomológica en
Iberoamérica: PrIBES 2002. m3m –Monografías Tercer Milenio, Vol. 2, Sociedad Entomológica Aragonesa (SEA), Zaragoza. pp. 55-68
CARDOSO, P., I. SILVA, N.G. DE OLIVEIRA & A.R.M. SERRANO. 2004. Higher taxa surrogates of spider (Araneae) diversity and their efficiency in conservation. Biological Conservation, 117:453-459.
Communication from the Commission to the Council at the European Parliament. 2000. Indicators for the integration of environmental concerns into the common agricultural policy.
DUELLI, P. 1997. Biodiversity evaluation in agricultural landscapes: An approach at two different scales. Agriculture, Ecosystems and Environment 62:81-91.
DUELLI, P., M.K. OBRIST & D.R. SCHMATZ. 1999. Biodiversity evaluation in agricultural landscapes: above-ground insects. Agriculture, Ecosystems and Environment 74:33-64.
GASTON, K.J. & P.H. WILLIAMS. 1993. Mapping the world’s species – the higher taxon approach. Biodiversity Letters 1:2-8.
GASTON, K.J. & T.M. BLACKBURN. 1995. Mapping biodiversity using surrogates for species richness: macro-scales and New World birds. Proceeding: Biological Sciences 262:335-341.
GOUVEIA, A.F. 2004. Araneofauna (Arachnida: Araneae) do Parque Natural da Serra de São Mamede: Faunística e Métodos de Avaliação da Riqueza Específica. Relatório de estágio profissionalizante em Biologia Aplicada aos Recursos Animais Terrestres. Faculdade de Ciências da Universidade de Lisboa
MARC, P., A. Canard & F. Ysnel. 1999. Spiders (Araneae) useful for pest limitation and bioindication. Agriculture, Ecosystems and Environment 74:229-273
MARTÍN-PIERA, F. 2000. Estimaciones prácticas de biodiversidad utilizando táxones de alto rango en insectos. In F. Martín-Piera, J.J. Morrone & A. Melic (eds.) Hacia un
proyecto CYTED para el inventario y estimación de la diversidad entomológica en Iberoamérica: PrIBES 2000. m3m – Monografías Tercer Milenio, Vol. 1, Sociedad Entomológica Aragonesa (SEA), Zaragoza. pp.35-54.
PLATNICK, N. I. 2007. The world spider catalog, version 8.0. American Museum of Natural History, online at
http://research.amnh.org/entomology/spiders/catalog/index.htmllatinick, 2007 (viewed on December 2007).
PAOLETTI, M. G. 1999. Using bioindicators based on biodiversity to assess landscape sustainability. Agriculture, Ecosystems and Environment 74:1-18.
PRIMACK, R. B. 2002. Essentials of Conservation Biology. Sinauer Associates, Inc. Publishers. Sunderland, Massachusetts U.S.
RICOTTA, C., M Ferrari, G. Avena. 2002. Using the scaling of higher taxa for assessment of species richness. Biological Conservation 107:131-133.
ROBERTS, M.J. 1985. The spiders of Britain & Northern Europe – Atypidae to Theridiosomatidae. Harper-Collins Publishers, London.32
ROBERTS, M.J. 1987. The spiders of Britain & Northern Europe – Linyphiidae and Check List. Harper-Collins Publishers, London.
ROBERTS, M.J. 1996. Spiders of Britain & Northern Europe – A field guide. Harper-Collins Publishers, London.
SIMON, E. 1914. Les arachnides de France. Synopsis générale et catalogue des espèces françaises de l'ordre des Araneae; 1re partie, 6:1-308.
SIMON, E. 1926. Les arachnides de France. Synopsis générale et catalogue des espèces françaises de l'ordre des Araneae; 2e partie, 6:309-532.
SIMON, E. 1929. Les arachnides de France. Synopsis générale et catalogue des espèces françaises de l'ordre des Araneae; 3e partie, 6:533-772.
SIMON, E. 1932. Les arachnides de France. Tome VI. Synopsis générale et catalogue des espèces françaises de l'ordre des Araneae; 4e partie, 6:773-978.
SIMON, E. 1937. Les arachnides de France. Tome VI. Synopsis générale et catalogue des espèces françaises de l'ordre des Araneae; 5e et derniére partie, 6:979-1298. WILKIE, L., G. CASSIS & M. GRAY. 2003. A quality control protocol for terrestrial
CHECKLIST OF SPIDERS (ARANEAE) DETECTED IN PEAR
ORCHARDS IN PORTUGAL
Catarina A. TAVARESa,b, Ana F. GOUVEIAc , Luís CRESPOd, Célia MATEUSa, Maria T.
REBELOb
a INRB-IP, Instituto Nacional dos Recursos Biológicos, Av. República, Quinta do Marquês, Nova Oeiras,
2784-505 Oeiras
b
Centro de Biologia Ambiental, Faculdade de Ciências da Universidade de Lisboa, Rua Ernesto Vasconcelos, Ed. C2, Campo Grande 1749-016 Lisboa
c AmBioDiv ~ Valor Natural, R. Filipe da Mata, 10, 1º Frente,1600-071 Lisboa. d Faculdade de Ciências e Tecnologia da Universidade de Coimbra.
Abstract: Spiders are one of the most diverse groups of predators in agroecosystems. Here we present a list of the spider species found in six pear orchards on the “Oeste” region of Portugal, under three different management practices (Organic Agriculture, Integrated Pest Management and Conventional Agriculture). The high number of specimens collected and the fact that two new species for Portugal were found in such a habitat, reflects the high relevance of biodiversity in this type of agroecosystems.
Key-words: orchards, Portugal, spiders Introduction
The known spider fauna registered to Portugal includes 730 species (Cardoso, 2007). In Portugal, information about spiders is still scarce and many species are waiting to be described (Telfer et al., 2003; Cardoso, 2004).
Spider study in Portugal started only by the end of the XIX century with E. Simon, who listed a series of spiders to Portugal (Bacelar, 1927). Later, between 1927 and 1949, several papers on new spider’s species detected and registered for Portugal were published (Bacelar, 1927a, 1927b, 1933, 1935, 1940; Machado, 1937, 1941, 1949).
Only recently, the study of spiders has restarted in Portugal mainly with the works of Nobre (1998), Telfer (2003), Cardoso (2003, 2004) and Gouveia (2004), among others.
In Portugal, very few studies were developed in agroecosystems regarding spider communities: there are some in citrus orchards (Ribeiro, 2004) and vineyards (Nobre, 1998), but none in pear orchards. Since spiders are important pest predators in agroecosystems (Marc et al., 1998), the knowledge of their community composition will contribute to the improvement of the agroecosystem management.
The main aim of this study is to increase knowledge about the spider fauna in Portugal particularly in pear orchards.
Material and Methods
This study took place in six pear orchards, in the “Oeste” region of Portugal. Two orchards of each management system were chosen: Organic Agriculture (OA1 and OA2), Integrated Pest Management (IPM1 and IPM2) and Conventional Agriculture (OA1 and OA2).
Two sampling methods were used. Pit-fall traps (10 cm diameter) were used to collected epigeic spiders from June to November 2006 and from April to June 2007. They had 30% ethylene glycol and were emptied every two weeks. A plywood square was placed as a roof, to avoid the accumulation of debris. The liquid content was filtered and the solid content
was stored in 75% alcohol. Ten pit-falls were used in each field, separated by 5 meters along the intertree-strips.
A beating tray was used to collect arboreal spiders in the trees canopy. At each orchard ten trees were chosen randomly and each one was stroked 12 times, in different branches. This occurred between 9.00 a.m. and 18.00 p.m. and each field was sampled at the same period of the day. Due to weather conditions and availability of resources, beatings took place when possible in October, December, May, June and August 2006 and July 2007.
Spiders were sorted, in laboratory and stored with 70% alcohol and glycerin.
Adult spiders were identified up to species level or morphospecies, when the species could not be determined, using identification keys Simon, 1914, 1926, 1929, 1932, 1937; Roberts, 1985, 1987, 1995, Barrientos, 2003; Nentiwig et al., 2003).
Results
During the study 1,685 adult specimens were collected. Sixteen families and 66 species were identified. Two species were added to the Portuguese fauna (Zelotes electus and Phrurolithus szilyi). They are referred for Portugal for the first time.
Abbreviations: f = female, m = male, sp = specimen; OA = organic agriculture orchard; IPM = Integrated Pest Management orchard, CA = Conventional Agriculture orchard.
Species detected and respective data: Family Agelenidae C.L. Koch, 1837
Lycosoides coarctata (Dufour, 1831)
LOCALITY: Caldas da Rainha (IPM), 22.VI.2006 (1m), DISTRIBUTION: Mediterranean Region (Platnick, 2007) Malthonica lusitanica (Simon, 1898)
LOCALITIES: Vilar (OA), 16.IV.2007 (1sp); Caldas da Rainha (IPM), 1.V.2007 (1sp); Peral (CA), 18.IX.2006 (3m), 2.X.2006 (5m), 18.X.2006 (1f)
DISTRIBUTION: Portugal to France (Platnick, 2007). Tegenaria atrica (C. L. Koch, 1843)
LOCALITY: Vilar (OA), 18.IX.2006 (1m). DISTRIBUTION: Europe (Platnick, 2007). Tegenaria feminea (Simon, 1870)
LOCALITIES: Vilar (OA), 16.IV.2007 (7m, 3f), 1.V.2007 (21sp), 29.V.2007 (1sp); Freiria (OA), 16.IV.2007 (2sp); Caldas da Rainha (IPM), 22.VI.2006 (3m, 1f); 17.VIII.2006 (1sp); 16.IV.2007 (8sp); 1.V.2007 (5sp); 25.VI.2007 (1sp); Peral (IPM), 16.IV.2007 (4sp); Peral (CA),18.IX.2006 (1m), 16.IV.2007 (2m, 3f).
DISTRIBUTION: Portugal, Spain (Platnick, 2007). Tegenaria montigena (Simon, 1937)
LOCALITIES: Caldas da Rainha (IPM), 22.VI.2006 (5sp), 7.VII.2006 (2 sp),17.VIII.2006 (1sp), 30.VIII.2006 (2sp); Peral (IPM), 7.VII.2006 (1sp); Peral (AC),
22.VI.2006 (3m); 25.VI.2007 (1sp).
Family Corinnidae (Karsch, 1880)
Liophrurillus flavitarsis (Lucas, 1846)
LOCALITIES: Peral (CA), 22.VI.2006 (1f); Vermelha (CA), 29.V.1007 (2sp). DISTRIBUTION: Europe, Madeira, North Africa (Platnick, 2007).
Phrurolithus minimus (C. L. Koch, 1839)
LOCALITY: Caldas da Rainha (IPM), 11.VI.2007 (1m) DISTRIBUTION: Palearctic (Platnick, 2007).
Phrurolithus szilyi (Herman, 1879)
LOCALITY: Freiria (OA), 22.VI.2006 (1m) DISTRIBUTION: Europe (Platnick, 2007). Family Dictynidae (O. P.-Cambridge, 1871)
Dictyna civica (Lucas, 1850)
LOCALITIES: Vilar (OA), 6.VIII.07 (1sp); Peral (IPM);30.VIII.2006(1sp);23.VII.07 (2sp); Peral (CA), 22.VI.2006 (1m); 11.VI.07 (1m), 23.VII.07 (1sp).
DISTRIBUTION: Europe, North Africa, North America (Platnick, 2007). Family Dysderidae (C. L. Koch, 1837)
Dysdera crocata (C. L. Koch, 1838)
LOCALITIES: Vilar (OA), 17.VIII.2006 (1m), 30.VIII.2006 (1m),11.VI.2007 (1m); Freiria (OA), 17.VIII.2006 (1m), 29.V.2007 (1sp), 30.VIII.2006 (1sp); Peral (CA), 21.VII.2006 (1sp); 18.X.2006 (2sp) 20.XI.2006 (1sp); 16.IV.2007 (1sp).
DISTRIBUTION: Cosmopolitan (Platnick, 2007). Dysdera fuscipes (Simon, 1882)
LOCALITIES: Vilar (OA), 7.VII.2006 (2m), 18.X.2006 (2m); 16.IV.2007 (2m), 1.V.2007 (1m); Peral (IPM), 16.IV.2007 (1m), 14.V.2007 (1m); Peral (CA), 11.VI.2007 (1m); 25.VI.2007 (1m).
DISTRIBUTION: Portugal, Spain, France (Platnick, 2007). Dysdera lusitanica (Kulczyn'ski, 1915)
LOCALITIES: Caldas da Rainha (IPM), 3.VIII.2006 (3m), 30.VIII.2006 (1m), 20.XI.2007 (1m); Peral (IPM), 1.V.2007 (1sp).
DISTRIBUTION: Portugal, Spain (Platnick, 2007). Rhode scutiventris, (Simon, 1882)
LOCALITY: Vermelha (CA), 30.VIII.2006 (2sp).
DISTRIBUTION: Portugal, Spain, Morocco, Algeria (Platnick, 2007). Family Gnaphosidae (Pocock, 1898)
Drassodes lapidosus (Walckenaer, 1802)
LOCALITIES: Vilar (OA), 22.VI.2006 (1m); Peral (IPM), 16.IV.2007 (2sp); Peral (CA), 1.V.2007 (1sp), 28.V.2007 (1sp).