RESEARCH ARTICLE
Inflammatory patterns in fixed airflow
obstruction are dependent on the presence
of asthma
Ida MogensenID1,2*, Tiago Jacinto3, Kjell Alving4, João A. Fonseca3, Christer Janson2, Andrei Malinovschi1
1 Dept. of Medical Sciences: Clinical Physiology, Uppsala University, Uppsala, Sweden, 2 Dept. of Medical
Sciences: Respiratory, Allergy and Sleep Research, Uppsala University, Uppsala, Sweden, 3 CINTESIS, Faculdade de Medicina da Universidade do Porto & Instituto e Hospital CUF, Porto, Portugal, 4 Pediatric Research, Dept. of Women’s and Children’s Health, Uppsala University, Uppsala, Sweden
Abstract
Rationale
Fixed airflow obstruction (FAO) can complicate asthma. Inflammation is a proposed under-lying mechanism.
Objective
Our aim in this cross-sectional investigation was to evaluate the blood leucocyte pattern and level of exhaled nitric oxide in asthmatics and non-asthmatics with or without FAO.
Methods
A total of 11,579 individuals aged�20 years from the US National Health and Nutrition Examination Survey were included. They were grouped as: controls without asthma and FAO (n = 9,935), asthmatics without FAO (n = 674), asthmatics with FAO (n = 180) and non-asthmatics with FAO (n = 790). FAO was defined as post-bronchodilator FEV1/FVC<lower limit of normal. Exhaled nitric oxide�25ppb, blood eosinophil levels�300 cells/μL, and blood neutrophil levels�5100 cells/μL were defined as elevated. Stratified analyses for smoking and smoking history were performed.
Results
Elevated blood eosinophil levels were more common in all groups compared to the controls, with the highest prevalence in the group with asthma and fixed airflow obstruction (p<0.01). In a multiple logistic regression model adjusted for potential confounders including smoking, the asthma groups had significantly higher odds ratios for elevated B-Eos levels compared to the control group (odds ratio 1.4, (confidence interval: 1.1–1.7) for the asthma group with-out fixed airflow obstruction and 2.5 (1.4–4.2) for the asthma group with fixed airflow obstruction). The group with fixed airflow obstruction without asthma had higher odds ratio
a1111111111 a1111111111 a1111111111 a1111111111 a1111111111 OPEN ACCESS
Citation: Mogensen I, Jacinto T, Alving K, Fonseca
JA, Janson C, Malinovschi A (2020) Inflammatory patterns in fixed airflow obstruction are dependent on the presence of asthma. PLoS ONE 15(12): e0243109.https://doi.org/10.1371/journal. pone.0243109
Editor: Stelios Loukides, National and Kapodistrian
University of Athens, GREECE
Received: August 16, 2020 Accepted: November 13, 2020 Published: December 3, 2020
Peer Review History: PLOS recognizes the
benefits of transparency in the peer review process; therefore, we enable the publication of all of the content of peer review and author responses alongside final, published articles. The editorial history of this article is available here: https://doi.org/10.1371/journal.pone.0243109
Copyright:© 2020 Mogensen et al. This is an open access article distributed under the terms of the Creative Commons Attribution License, which permits unrestricted use, distribution, and reproduction in any medium, provided the original author and source are credited.
Data Availability Statement: The data is available
athttps://wwwn.cdc.gov/nchs/nhanes/Default.aspx and a complete list of datasets used are available in theSupporting Informationfiles.
for elevated blood neutrophil levels compared to the controls: 1.4 (1.1–1.8). Smoking and a history of smoking were associated to elevated B-Neu levels.
Conclusion
Fixed airflow obstruction in asthma was associated with elevated blood eosinophil levels, whereas fixed airflow obstruction without asthma was associated with elevated blood neu-trophil levels.
Introduction
Fixed airflow obstruction (FAO) is a non-reversible condition where the airflow during a forced expiratory maneuver is impaired, manifesting spirometrically as a decreased post-bronchodilatory ratio between forced expiratory volume during the first second (FEV1) and forced vital capacity (FVC). This can be due to airway remodeling associated to asthma [1,2], or as seen in chronic obstructive pulmonary disease (COPD), damaged airways caused by exposure to toxins such as cigarette smoke leading to structural changes [3]. A proposed path-ologic mechanism in the development of FAO is a low-grade inflammation. Increased eosino-phils in both blood (B-Eos) and sputum has been associated with FAO or lower lung function in both asthmatics and non-asthmatics [4–8], though results have been contradictory [9–11]. Cigarette smoking has been reported to be related to an increase of leucocytes in blood and sputum in both asthmatics and non-asthmatics [12,13]. Elevated blood neutrophil (B-Neu) count has also been associated with lower lung function both among asthmatics [14] and in the general population [15]. The fraction of exhaled nitric oxide (FeNO) is mainly produced by inducible NO synthase in the airway epithelium. FeNO seems to be more related to respira-tory symptoms [16] than to FAO [17].
The aim of this cross-sectional analysis was to investigate how the inflammatory pattern varied with FAO among asthmatics and non-asthmatics compared with in healthy controls; and how this was influenced by smoking. Our hypothesis was that FAO would be related to more inflammation, measured as higher levels of FeNO, B-Eos and/or B-Neu, but that the inflammatory pattern would differ depending on whether or not asthma was present, indicat-ing different pathophysiological mechanisms behind FAO.
Materials and methods
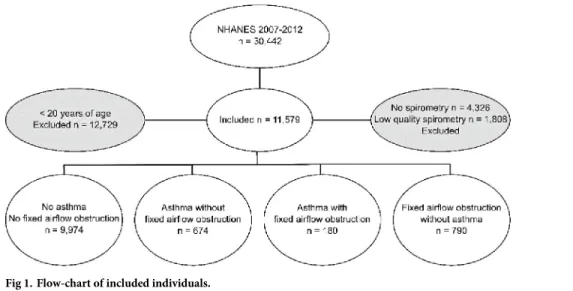
The participants were collected from the US National Health and Nutrition Examination Sur-veys (NHANES) 2007–08, 2009–10 and 2011–12, a population based survey [18]. After exclu-sion of subjects under 20 years of age and subjects who did not have spirometry data or where the spirometries did not fulfill the American Thoracic Society (ATS) criteria regarding accept-ability and reproducibility of measurements [19], the population consisted of 11,579 individu-als (Fig 1). Subjects were divided into four groups: a reference group (controls) without asthma and a FEV1/FVC ratio above the lower limit of normal (LLN) pre- or post-bronchodi-lation (defined as without FAO), a group with asthma without FAO, a group with asthma with FAO, and a group with FAO without asthma. These groups were compared regarding the lev-els of the inflammatory markers.
Funding: The U4 Network (Uppsala University),
financial support and salary for Ida Mogensen (IM) Uppsala City Council, financial support Bror Hjerpstedts Stiftelse, financial support The Swedish Heart-Lung Foundation, travel grants (IM) The funders had no role in study design, data collection and analysis, decision to publish, or preparation of the manuscript.
Competing interests: The authors have declared
Spirometry, questionnaires and body measures
FEV1and FVC were measured with an Ohio 822/827 dry-rolling seal volume spirometer. For the subjects with a non-obstructive pattern (FEV1/FVC � 0.7 and above LLN), only pre-bronchodilatory values were collected. However, for subjects with an obstructive pattern (FEV1/FVC < 0.7 or below LLN [20,21]), bronchodilation was performed with two puffs of albuterol, followed by post-bronchodilation spirometry. The Hankinson reference values were used and corrected for ethnicity [20,21]. FAO was regarded as present if the FEV1/FVC ratio was below LLN post-bronchodilation.
Questionnaire-reported variables (S1 Questionnaires) were obtained through interviews performed by trained interviewers [22]. Hay fever was defined as present if the participant reported an episode of hay fever in the preceding year. A smoking history of less than 100 ciga-rettes defined never smoking. Participant with a smoking history in excess of that were divided into current smokers and ex-smokers. Smoking history (pack-years) was based on the amount of smoking reported. Ethnicity was defined as Mexican-American, other Hispanic, non-His-panic white, non-Hisnon-His-panic black, or other ethnicity, including multi-ethnic and Asian. Asthma diagnosis was considered present if the participant reported current asthma diagnosed by a health professional. Asthma morbidity was self-reported, defined as � 2 different asthma symptoms reported in the preceding year [22]. This has been described in detail previously [23]. Information about medication prescribed for wheezing in the preceding 12 months, and for asthma in the preceding 3 months, and the use of inhaled corticosteroids, combinations of inhaled corticosteroids and long-acting beta-2 agonists, oral corticosteroids, and leukotriene-receptor antagonists in the preceding month was specified. Use of oral or inhaled corticoste-roids during the two days preceding FeNO measurement was the subject of a specific question.
Body mass index (BMI) was calculated by dividing weight in kilograms by the square of length in meters. The participants divided into groups: BMI < 25, 25–30 and > 30. A serum cotinine � 3 ng/mL was regarded as a marker for cigarette smoke exposure [24].
Biomarkers
FeNO was measured using a handheld device with an electrochemical sensor (NIOX MINO; Aerocrine, Stockholm, Sweden) at an exhalation rate of 50 mL/s. The mean was calculated
Fig 1. Flow-chart of included individuals.
after two reproducible measurements and used as the participant’s FeNO value. A value � 25 ppb was defined as elevated in accordance with the ATS guidelines [25].
B-Eos and B-Neu were measured in venous blood using a Beckman Coulter HMX (Beck-man Coulter, Fullerton, CA, USA). Both B-Eos and B-Neu were reported with a resolution of 100 cells/μL. B-Eos counts � 300 cells/μL [26,27] and B-Neu counts � 5,100 cells/μL (upper quartile) were defined as elevated, respectively.
Statistical analyses
The statistical analyses were performed in Stata/IC 15 (Stata Corp, College Station, TX, USA). The three groups, asthma without FAO, asthma with FAO and FAO without asthma, were all compared with the control group regarding baseline characteristics, and levels of FeNO, B-Eos, and B-Neu. Normally distributed continuous variables were analyzed with Wald test and categorical variables with Pearson’s chi-squared tests. Non-normally distributed variables were analyzed non-parametrically with Wilcoxon rank sum test. Analyses were stratified for smoking status (never, ex- and current) and smoking history (dichotomous variable, using 10 pack-years as cut-off) and the prevalence of elevated markers was analyzed in between the case-groups. The asthma characteristics were compared between asthmatics with and without FAO.
Adjusted multiple logistic regression models with the outcomes elevated levels of FeNO, B-Eos, and B-Neu, adjusted for sex, ethnicity, age, steroid use in the preceding two days, study year, cotinine levels, use of anti-inflammatory medications, and smoking status were used. Interaction analyses in adjusted logistic models were done for sex and BMI respectively to eval-uate effect modification by these variables.
The analyses took into account the complex multistage sampling and sampling weights pro-vided by the NHANES [28]. A p value � 0.05 was considered statistically significant. Missing data were handled using only complete cases.
Ethics statement
The National Centre for Health Statistics Research Ethics Review Board approved the proto-cols (ERB protocol numbers #2006–2007 and #2011–2017). The participants provided written informed consent.
Results
Characterization of the groups
The study group consisted of 11,579 individuals with a mean age of 45 years (range 20–79 years). In the whole population, 56% were never smokers, 22% ex-smokers and 22% current smokers. In the control group and asthma without FAO group, the prevalence of never smok-ers was almost 60%, while the asthma with FAO group had 26% never smoksmok-ers and the FAO without asthma group had 24%. The individuals in the two FAO groups were older than con-trols and had been smoking more. In the FAO group without asthma, 5% had reported receiv-ing a diagnosis of emphysema, 3% chronic bronchitis and 1% had been diagnosed with of cancer in the lung. The subject characteristics are further described inTable 1.
Anti-inflammatory medication was mainly used in the two asthma groups. The group with both asthma and FAO was prescribed more asthma medication (anti-inflammatory and or including bronchodilator therapy) (78% vs. 58%, p = 0.005) and more anti-inflammatory med-ication than asthmatics without FAO (43% vs. 26%, p = 0.002). They also more frequently reported presence of at least 2 asthma symptoms (65% vs. 49%, p = 0.004) and a longer
duration of asthma: median (25–75thpercentile) 21 years (11–38 years) vs. 17 years (8–28 years, p = 0.001). No difference in age at asthma onset was seen: 51% in the asthma without FAO group had an onset of disease before 18 years of age vs. 57% in the asthma with FAO group, p = 0.30.
Inflammatory patterns in the groups
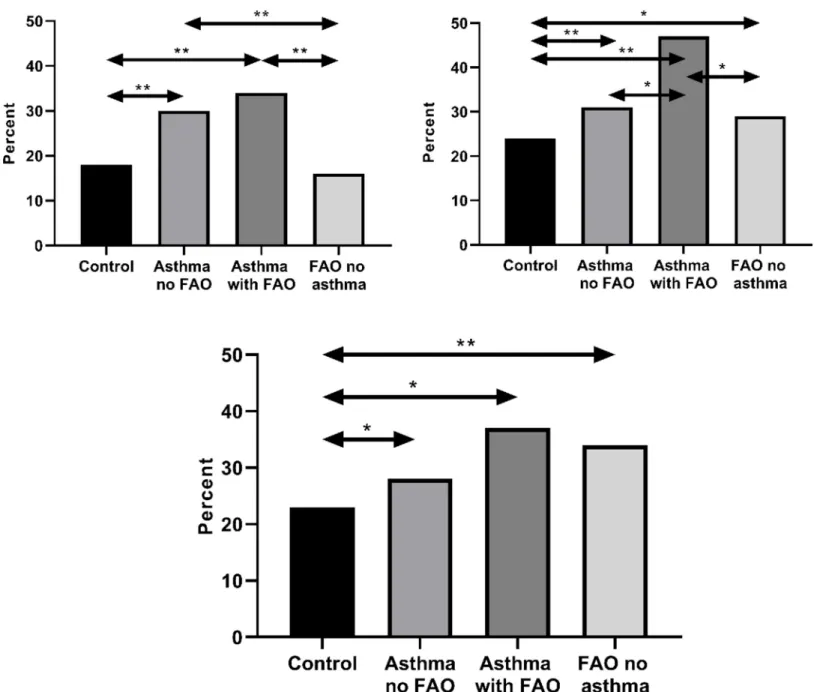
The prevalence of elevated FeNO was 29% in the asthma without FAO group and 33% in the asthma with FAO group, compared with 17% among controls (p < 0.001 for both) (Fig 2A). Elevated FeNO was found in 16% of subjects with FAO without asthma, which was not signifi-cantly different from among control subjects (p = 0.59). Elevated B-Eos was more common in the asthma without FAO (30%), asthma with FAO (48%) and FAO without asthma (30%) groups, compared with the control group: 23% (p < 0.001, p < 0.001, and p = 0.003, respec-tively) (Fig 2B). Elevated B-Neu was also more prevalent in all case groups, asthma without FAO 29% (p = 0.028), asthma with FAO 35% (p = 0.013) and FAO without asthma 34% (p < 0.001), than among controls: 23% (Fig 2C). Elevated FeNO was more prevalent in both asthma groups than in the FAO without asthma group (Fig 2A) (p � 0.001), and elevated
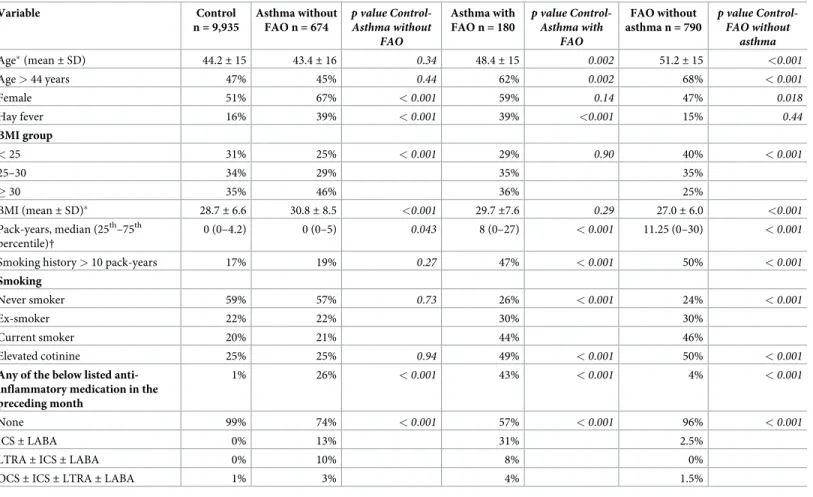
Table 1. Characteristics of the asthma and FAO groups compared with controls. Variable Control n = 9,935 Asthma without FAO n = 674 p value Control-Asthma without FAO Asthma with FAO n = 180 p value Control-Asthma with FAO FAO without asthma n = 790 p value Control-FAO without asthma Age�(mean± SD) 44.2± 15 43.4± 16 0.34 48.4± 15 0.002 51.2± 15 <0.001 Age > 44 years 47% 45% 0.44 62% 0.002 68% <0.001 Female 51% 67% <0.001 59% 0.14 47% 0.018 Hay fever 16% 39% <0.001 39% <0.001 15% 0.44 BMI group < 25 31% 25% <0.001 29% 0.90 40% <0.001 25–30 34% 29% 35% 35% � 30 35% 46% 36% 25% BMI (mean± SD)� 28.7± 6.6 30.8± 8.5 <0.001 29.7±7.6 0.29 27.0± 6.0 <0.001 Pack-years, median (25th–75th percentile)† 0 (0–4.2) 0 (0–5) 0.043 8 (0–27) <0.001 11.25 (0–30) <0.001
Smoking history > 10 pack-years 17% 19% 0.27 47% <0.001 50% <0.001
Smoking
Never smoker 59% 57% 0.73 26% <0.001 24% <0.001
Ex-smoker 22% 22% 30% 30%
Current smoker 20% 21% 44% 46%
Elevated cotinine 25% 25% 0.94 49% <0.001 50% <0.001
Any of the below listed anti-inflammatory medication in the preceding month
1% 26% <0.001 43% <0.001 4% <0.001
None 99% 74% <0.001 57% <0.001 96% <0.001
ICS± LABA 0% 13% 31% 2.5%
LTRA± ICS ± LABA 0% 10% 8% 0%
OCS± ICS ± LTRA ± LABA 1% 3% 4% 1.5%
�Wald test,
†Wilcoxon rank sum test.
Abbreviations: B-Eos: blood eosinophils; B-Neu: blood neutrophils; BMI: body mass index; FAO: fixed airflow obstruction; FeNO: fraction of exhaled Nitric Oxide; ICS: inhaled corticosteroids; LABA: long acting beta agonist; LTRA: leukotriene receptor antagonist; OCS: oral corticosteroids
B-Eos was more common among the asthmatics with FAO than in the other groups (p = 0.004 versus asthma without FAO, and p = 0.003 versus FAO without asthma) (Fig 2B).
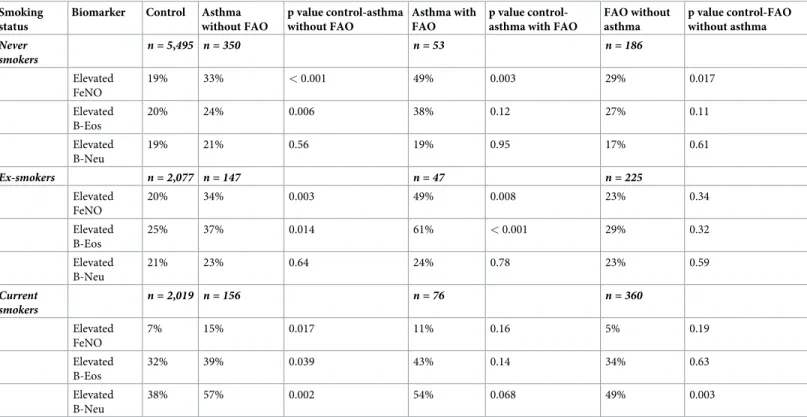
A higher prevalence of elevated FeNO was found in asthmatics compared with in controls among never-smokers. Also, those in the FAO group without asthma who were never smokers had an increased prevalence of elevated FeNO compared with controls (Table 2).
Among subjects with 10 or more pack-years’ smoking, elevated B-Eos was significantly associated with asthma with FAO (Table 3).
Fig 2. Percent with elevated marker in the groups respectively: Panel a: FeNO; panel b: B-Eos; panel c: B-Neu. (a) Percent with elevated FeNO (�25ppb) in the groups:
Control: 17%, Asthma without FAO: 29%, Asthma with FAO: 33%, FAO without asthma: 16%,��p < 0.001. (b) Percent with elevated B-Eos (�300 cells/μL) in the groups:
Control: 23%, Asthma without FAO: 30%, Asthma with FAO: 48%, FAO without asthma: 30%,�p < 0.05,��p< 0.001. (c) Percent with elevated B-Neu (B-Neu �5100
cells/μL) in the groups: Control: 23%, Asthma without FAO: 29%, Asthma with FAO: 35%, FAO without asthma: 34%,�p < 0.05,��p < 0.001. Abbreviations: FeNO:
fraction of exhaled Nitric Oxide, B-Eos: blood eosinophils, B-Neu: blood neutrophils, FAO: fixed airflow obstruction. https://doi.org/10.1371/journal.pone.0243109.g002
Table 2. Percent with elevated markers (FeNO �25ppb, B-Eos�300 cells/μL, B-Neu �5100 cells/μL) in the asthma and FAO groups compared with the control group, stratified by smoking status.
Smoking status
Biomarker Control Asthma without FAO p value control-asthma without FAO Asthma with FAO p value control-asthma with FAO
FAO without asthma p value control-FAO without asthma Never smokers n = 5,495 n = 350 n = 53 n = 186 Elevated FeNO 19% 33% < 0.001 49% 0.003 29% 0.017 Elevated B-Eos 20% 24% 0.006 38% 0.12 27% 0.11 Elevated B-Neu 19% 21% 0.56 19% 0.95 17% 0.61 Ex-smokers n = 2,077 n = 147 n = 47 n = 225 Elevated FeNO 20% 34% 0.003 49% 0.008 23% 0.34 Elevated B-Eos 25% 37% 0.014 61% < 0.001 29% 0.32 Elevated B-Neu 21% 23% 0.64 24% 0.78 23% 0.59 Current smokers n = 2,019 n = 156 n = 76 n = 360 Elevated FeNO 7% 15% 0.017 11% 0.16 5% 0.19 Elevated B-Eos 32% 39% 0.039 43% 0.14 34% 0.63 Elevated B-Neu 38% 57% 0.002 54% 0.068 49% 0.003
Abbreviations: B-Eos: blood eosinophils; B-Neu: blood neutrophils; FAO: fixed airflow obstruction; FeNO: fraction of exhaled Nitric Oxide https://doi.org/10.1371/journal.pone.0243109.t002
Table 3. Percent with elevated markers (FeNO �25ppb, B-Eos�300 cells/μL, B-Neu �5100 cells/μL) in the asthma and FAO groups compared with controls, strati-fied by total smoke exposure (< 10 or � 10 pack-years).
Smoke exposure Biomarker Control Asthma without FAO
p value control-asthma without FAO
Asthma with FAO
p value control-asthma with FAO
FAO without asthma p value control-FAO without asthma Smoking < 10 pack-years n = 8,228 n = 532 n = 107 n = 392 Elevated FeNO 18% 33% < 0.001 44% < 0.001 21% 0.17 Elevated B-Eos 21% 29% < 0.001 44% 0.004 26% 0.15 Elevated B-Neu 21% 25% 0.21 28% 0.21 26% 0.086 Smoking � 10 pack-years n = 1,707 n = 142 n = 73 n = 398 Elevated FeNO 13% 16% 0.49 22% 0.092 11% 0.26 Elevated B-Eos 32% 35% 0.43 53% 0.025 34% 0.60 Elevated B-Neu 33% 46% 0.007 43% 0.23 42% 0.003
Abbreviations: B-Eos: blood eosinophils; B-Neu: blood neutrophils; FAO: fixed airflow obstruction; FeNO: fraction of exhaled Nitric Oxide https://doi.org/10.1371/journal.pone.0243109.t003
Adjusted analysis
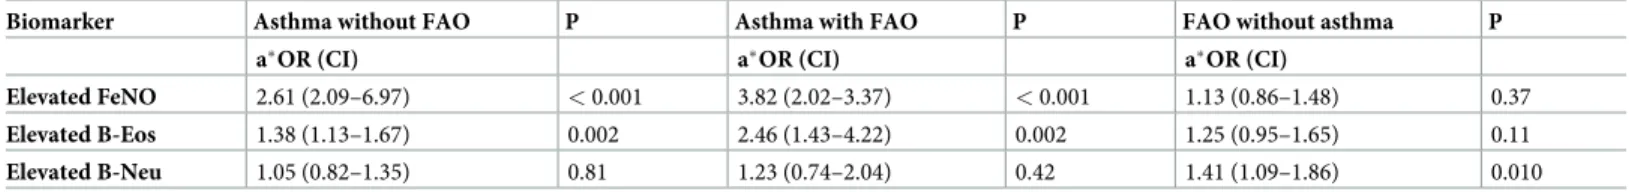
Elevated FeNO and elevated B-Eos were independently associated with asthma without FAO and asthma with FAO, and elevated B-Neu was related to FAO without asthma after adjusting for sex, ethnicity, BMI, age, steroid use in the preceding two days, study year, serum cotinine, smoking habits, and use of anti-inflammatory medication (Table 4).
Interaction analyses for BMI and sex
The interaction analyses for BMI and sex showed significant interactions among asthmatics without FAO for BMI and elevated FeNO for the group with BMI < 25 (adjusted odds ratio (aOR): 4.0 (95% CI: 2.3–6.9)) compared with the group with BMI � 30 (aOR: 2.3 (1.6–3.4); p in-teraction= 0.038). In the FAO without asthma group, there was an interaction with elevated B-Eos, more common at BMI < 25, (aOR: 1.5 (1.0–2.4)) than at BMI � 30 (aOR: 0.74 (0.47– 1.2); pinteraction= 0.024). Female sex was significantly related to elevated FeNO in the FAO without asthma group aOR: 1.8 (1.2–2.8) as compared with male sex (aOR: 0.82 (0.60–1.1); p in-teraction= 0.003).
Discussion
Asthma with FAO was, like asthma without FAO, associated with elevated levels of FeNO and B-Eos. However, asthmatics with FAO had the highest prevalence of elevated B-Eos of all groups. Elevated B-Neu was associated with FAO and smoking, both with and without asthma.
Both asthma with and without FAO were characterized by higher prevalence of elevated FeNO and B-Eos compared with controls. As asthma is an inflammatory disease, elevated els of type-2 inflammatory markers are expected; we reported earlier that having increased lev-els of both biomarkers was related to higher prevalence of asthma morbidity, without
accounting for presence of FAO [29]. These relations were consistent after adjusting for age and smoking, which had previously been reported in the literature to associate with affected B-Eos levels [30–33]. However, asthma with FAO was characterized by the highest prevalence of elevated B-Eos, a finding in line with our recent study in which we reported that increased levels of eosinophil activation markers were found in asthmatics with FAO [17]. This finding is of interest, as elevated B-Eos could signal a treatable component of the disease, and with more than half of the patients not using anti-inflammatory medication the preceding month, there might be further room for optimization of treatment.
Elevated B-Neu levels were found in non-asthmatic subjects with FAO. This is probably related to a large extent to smoking, known to be associated with increased B-Neu levels [12]
Table 4. Adjusted�odds ratios for elevated markers (FeNO �25ppb, B-Eos�300 cells/μL, B-Neu �5100 cells/μL) for the asthma and FAO groups in relation to the
control group in an adjusted logistic regression.
Biomarker Asthma without FAO P Asthma with FAO P FAO without asthma P a�OR (CI) a�OR (CI) a�OR (CI)
Elevated FeNO 2.61 (2.09–6.97) < 0.001 3.82 (2.02–3.37) < 0.001 1.13 (0.86–1.48) 0.37
Elevated B-Eos 1.38 (1.13–1.67) 0.002 2.46 (1.43–4.22) 0.002 1.25 (0.95–1.65) 0.11
Elevated B-Neu 1.05 (0.82–1.35) 0.81 1.23 (0.74–2.04) 0.42 1.41 (1.09–1.86) 0.010
�Adjusted for sex, ethnicity, BMI, age, steroids in the preceding 2 days, study year, serum cotinine, smoking, anti-inflammatory medication in the preceding month.
Abbreviations: aOR: Adjusted odds ratio; B-Eos: blood eosinophils; B-Neu: blood neutrophils; BMI: body mass index; CI: 95% confidence interval; FAO: fixed airflow obstruction; FeNO: fraction of exhaled Nitric Oxide
and also that many in this group probably have COPD. Sub analyses performed in different smoking strata found this relation to be consistent only among current-smoking subjects. This was also found in the group with asthma without FAO, and with a trend in the asthma with FAO-group. Smoking in presence of respiratory or structural airway disease seems to relate to further increase of B-Neu. Elevated B-Neu could reflect decreased ability to resist chronic infections [34] in remodeled or fibrotic tissue, caused by smoking or injuries caused by other respiratory diseases.
The prevalence of elevated FeNO was low in the FAO without asthma group. As smoking is related to lower FeNO levels [35], we studied if this relation was consistent in different smok-ing strata. This findsmok-ing appears to be driven mainly by smoksmok-ing subjects as in the analysis lim-ited to never smokers, elevated FeNO was more prevalent in the FAO without asthma group than among controls. Furthermore, we found a sex difference in subjects with FAO without asthma, where elevated FeNO associated with FAO without asthma among women, but not men. This could be explained by the same cut-off used in men and women despite differences reported in the literature, with lower levels in women than in men due to smaller airways [36]. BMI was also associated to different inflammatory pattern in asthmatics without FAO, with more active type-2 inflammation (FeNO and B-Eos) in subjects with normal BMI compared to obese subjects. Possible explanations for this finding could be both altered inflammation mechanisms in obese subjects with asthma, as higher proportion of neutrophilic asthma has been described in asthma with obesity [37–39]. Another explanation is that in obese subjects with asthma, respiratory symptoms might be more related to mechanical and ventilatory alter-ations [40,41] rather than type 2 inflammation.
FeNO is a marker reflecting local type-2 inflammation in the airways, whereas both B-Eos and B-Neu are sampled in blood and do not necessarily mirror the inflammation in airway tis-sue [42]. However, while increased B-Eos levels have been linked to worse lung function [6,7], the picture is more complicated when it comes to neutrophils. B-Neu is less correlated with the levels in other compartments, such as bronchoalveolar lavage, bronchial biopsies or spu-tum, than B-Eos [42,43]. The increased amount of neutrophils in the airway lumen in COPD is well-established [44,45], and a part of the group with FAO with or without asthma is likely to have COPD. Neutrophilia in airways and blood has, however, been associated with both bet-ter [46] and worse pulmonary function over time [47,48]. Our findings rather link elevated B-Neu to airway disease (FAO, asthma) among smokers, as seen in the stratified analyses (Tables2and3).
There are some limitations in this study. Lung function was only measured at one time point and there was no intervention with optimized treatment preceding the examinations. This makes the reliability of the FAO diagnosis weaker; non-reversibility can also be a symp-tom of under-treatment, though the asthma with FAO group reported using more medica-tions. The cross-sectional study design does not allow for drawing conclusions on causality. Furthermore, the FAO without asthma group was heterogeneous even if it could be assumed that a significant proportion might be subjects with undiagnosed COPD and asthma. We know that COPD is still underdiagnosed [49] and the same might apply to asthma as the cases were defined based on self-reported physician-diagnosed asthma. In the light of this heteroge-neity, this group rather represent the implications of fixed airflow obstruction than a common etiology for the impairment. B-Eos and B-Neu measured in blood do not necessarily reflect the levels in the airways [42,43]. However, the advantage of their accessibility makes the clinical impact of these valuable to scrutinize.
In conclusion, in asthma with FAO the inflammatory pattern was characterized by eosino-philic inflammation and increased levels of FeNO, a pattern also seen in asthmatics without FAO. However, the eosinophil pattern was even more pronounced in asthmatics with FAO.
FAO in non-asthmatics was associated with elevated levels of B-Neu and our results suggested a close association to current smoking. This indicates a need for further studies to evaluate the role of both eosinophil and neutrophil inflammation in the development of fixed airflow obstruction.
Supporting information
S1 Questionnaires. (DOCX) S1 Dataset. (DOCX)Author Contributions
Conceptualization: Kjell Alving, João A. Fonseca, Christer Janson, Andrei Malinovschi.
Data curation: Ida Mogensen, Tiago Jacinto. Formal analysis: Ida Mogensen, Tiago Jacinto.
Funding acquisition: Christer Janson, Andrei Malinovschi. Investigation: Ida Mogensen.
Methodology: Andrei Malinovschi.
Supervision: Christer Janson, Andrei Malinovschi. Writing – original draft: Ida Mogensen.
Writing – review & editing: Ida Mogensen, Tiago Jacinto, Kjell Alving, João A. Fonseca, Christer Janson, Andrei Malinovschi.
References
1. Ferreira DS, Carvalho-Pinto RM, Gregorio MG, Annoni R, Teles AM, Buttignol M, et al. Airway pathol-ogy in severe asthma is related to airflow obstruction but not symptom control. Allergy. 2018; 73 (3):635–43.https://doi.org/10.1111/all.13323PMID:28960335
2. Mauad T, Bel EH, Sterk PJ. Asthma therapy and airway remodeling. J Allergy Clin Immunol. 2007; 120 (5):997–1009; quiz 10–1.https://doi.org/10.1016/j.jaci.2007.06.031PMID:17681364
3. Decramer M, Janssens W, Miravitlles M. Chronic obstructive pulmonary disease. Lancet. 2012; 379 (9823):1341–51.https://doi.org/10.1016/S0140-6736(11)60968-9PMID:22314182
4. ten Brinke A, Zwinderman AH, Sterk PJ, Rabe KF, Bel EH. Factors Associated with Persistent Airflow Limitation in Severe Asthma. Am J Respir Crit Care Med. 2001; 164(5):744–8.https://doi.org/10.1164/ ajrccm.164.5.2011026PMID:11549526
5. Wang X, Mensinga TT, Schouten JP, Rijcken B, Weiss ST. Determinants of maximally attained level of pulmonary function. Am J Respir Crit Care Med. 2004; 169(8):941–9.https://doi.org/10.1164/rccm. 2201011PMID:15072985
6. Hancox RJ, Pavord ID, Sears MR. Associations between blood eosinophils and decline in lung function among adults with and without asthma. Eur Respir J. 2018; 51(4).https://doi.org/10.1183/13993003. 02536-2017PMID:29563173
7. Coumou H, Westerhof GA, de Nijs SB, Zwinderman AH, Bel EH. Predictors of accelerated decline in lung function in adult-onset asthma. Eur Respir J. 2018; 51(2).https://doi.org/10.1183/13993003. 01785-2017PMID:29444915
8. Konstantellou E, Papaioannou AI, Loukides S, Patentalakis G, Papaporfyriou A, Hillas G, et al. Persis-tent airflow obstruction in patients with asthma: Characteristics of a distinct clinical phenotype. Respir Med. 2015; 109(11):1404–9.https://doi.org/10.1016/j.rmed.2015.09.009PMID:26412805
9. Semprini R, Williams M, Semprini A, McDouall A, Fingleton J, Holweg C, et al. Type 2 Biomarkers and Prediction of Future Exacerbations and Lung Function Decline in Adult Asthma. J Allergy Clin Immunol Pract. 2018; 6(6):1982–8 e1.https://doi.org/10.1016/j.jaip.2018.03.004PMID:29609049
10. Nadif R, Siroux V, Boudier A, le Moual N, Just J, Gormand F, et al. Blood granulocyte patterns as pre-dictors of asthma phenotypes in adults from the EGEA study. Eur Respir J. 2016; 48(4):1040.https:// doi.org/10.1183/13993003.00336-2016PMID:27492832
11. Frette C, Annesi I, Korobaeff M, Neukirch F, Dore MF, Kauffmann F. Blood eosinophilia and FEV1. Cross-sectional and longitudinal analyses. Am Rev Respir Dis. 1991; 143(5 Pt 1):987–92.https://doi. org/10.1164/ajrccm/143.5_Pt_1.987PMID:2024855
12. Higuchi T, Omata F, Tsuchihashi K, Higashioka K, Koyamada R, Okada S. Current cigarette smoking is a reversible cause of elevated white blood cell count: Cross-sectional and longitudinal studies. Prev Med Rep. 2016; 4:417–22.https://doi.org/10.1016/j.pmedr.2016.08.009PMID:27583199
13. Chalmers GW, MacLeod KJ, Thomson L, Little SA, McSharry C, Thomson NC. Smoking and airway inflammation in patients with mild asthma. Chest. 2001; 120(6):1917–22.https://doi.org/10.1378/chest. 120.6.1917PMID:11742922
14. Backman H, Jansson SA, Stridsman C, Muellerova H, Wurst K, Hedman L, et al. Chronic airway obstruction in a population-based adult asthma cohort: Prevalence, incidence and prognostic factors. Respir Med. 2018; 138:115–22.https://doi.org/10.1016/j.rmed.2018.03.036PMID:29724382 15. Nerpin E, Jacinto T, Fonseca JA, Alving K, Janson C, Malinovschi A. Systemic inflammatory markers in
relation to lung function in NHANES. 2007–2010. Respir Med. 2018; 142:94–100.https://doi.org/10. 1016/j.rmed.2018.07.011PMID:30170809
16. Mansur AH, Srivastava S, Sahal A. Disconnect of type 2 biomarkers in severe asthma; dominated by FeNO as a predictor of exacerbations and periostin as predictor of reduced lung function. Respir Med. 2018; 143:31–8.https://doi.org/10.1016/j.rmed.2018.08.005PMID:30261989
17. Mogensen I, Alving K, Dahlen SE, James A, Forsberg B, Ono J, et al. Fixed airflow obstruction relates to eosinophil activation in asthmatics. Clin Exp Allergy. 2019; 49(2):155–62.https://doi.org/10.1111/ cea.13302PMID:30365193
18. NHANES. Centers for Disease Control and Prevention (CDC). National Center for Health Statistics (NCHS). National Health and Nutrition Examination Survey Data. Hyattsville, MD: U.S.: Department of Health and Human Services, Centers for Disease Control and Prevention; 2008–2012 [2018-10-23]. Available from:https://wwwn.cdc.gov/nchs/nhanes/continuousnhanes/overviewquex.aspx? BeginYear=2011;https://wwwn.cdc.gov/nchs/nhanes/continuousnhanes/overviewquex.aspx? BeginYear=2009;https://wwwn.cdc.gov/nchs/nhanes/continuousnhanes/overviewquex.aspx? BeginYear=2007. (accessed 2018-10-23)
19. Standardization of Spirometry, 1994 Update. American Thoracic Society. Am J Respir Crit Care Med. 1995; 152(3):1107–36.https://doi.org/10.1164/ajrccm.152.3.7663792PMID:7663792
20. Hankinson JL, Odencrantz JR, Fedan KB. Spirometric Reference Values from a Sample of the General U.S. Population. Am J Respir Crit Care Med. 1999; 159(1):179–87.https://doi.org/10.1164/ajrccm.159. 1.9712108PMID:9872837
21. Hankinson JL, Kawut SM, Shahar E, Smith LJ, Stukovsky KH, Barr RG. Performance of american tho-racic society-recommended spirometry reference values in a multiethnic sample of adults: The multi-ethnic study of atherosclerosis (mesa) lung study. Chest. 2010; 137(1):138–45.https://doi.org/10.1378/ chest.09-0919PMID:19741060
22. National Health and Nutrition Examination Surveyhttps://wwwn.cdc.gov/nchs/nhanes/
ResponseRates.aspx2015[Available from:http://www.cdc.gov/nchs/nhanes/about_nhanes.htm. (accessed 2019-10-22).
23. Mogensen I, Alving K, Jacinto T, Fonseca J, Janson C, Malinovschi A. Simultaneously elevated FeNO and blood eosinophils relate to asthma morbidity in asthmatics from NHANES 2007–12. Clin Exp Allergy. 2018; 48(8):935–43.https://doi.org/10.1111/cea.13137PMID:29575336
24. Benowitz NL, Bernert JT, Caraballo RS, Holiday DB, Wang J. Optimal serum cotinine levels for distin-guishing cigarette smokers and nonsmokers within different racial/ethnic groups in the United States between 1999 and 2004. Am J Epidemiol. 2009; 169(2):236–48.https://doi.org/10.1093/aje/kwn301
PMID:19019851
25. Dweik RA, Boggs PB, Erzurum SC, Irvin CG, Leigh MW, Lundberg JO, et al. An Official ATS Clini-cal Practice Guideline: Interpretation of Exhaled Nitric Oxide Levels (FeNO) for CliniClini-cal Applica-tions. Am J Respir Crit Care Med. 2011; 184(5):602–15.https://doi.org/10.1164/rccm.9120-11ST
PMID:21885636
26. Simmons A, Leaverton P, Elbert G. Normal laboratory values for differential white cell counts estab-lished by manual and automated cytochemical methods (Hemalog D-TM). J Clin Pathol. 1974; 27 (1):55–8.https://doi.org/10.1136/jcp.27.1.55PMID:4132253
27. Tran TN, Khatry DB, Ke X, Ward CK, Gossage D. High blood eosinophil count is associated with more frequent asthma attacks in asthma patients. Ann Allergy Asthma Immunol. 2014; 113(1):19–24.https:// doi.org/10.1016/j.anai.2014.04.011PMID:24846699
28. NHANES. National Health and Nutrition Examination Survey: Analytic Guidelines, 2011–2012 2012 [Available from:https://wwwn.cdc.gov/nchs/data/nhanes/2011-2012/analytic_guidelines_11_12.pdf
(accessed 20191022).
29. Malinovschi A, Fonseca JA, Jacinto T, Alving K, Janson C. Exhaled nitric oxide levels and blood eosino-phil counts independently associate with wheeze and asthma events in National Health and Nutrition Examination Survey subjects. J Allergy Clin Immunol. 2013; 132(4):821-7.e5.https://doi.org/10.1016/j. jaci.2013.06.007PMID:23890753
30. Sunyer J, Springer G, Jamieson B, Conover C, Detels R, Rinaldo C, et al. Effects of asthma on cell com-ponents in peripheral blood among smokers and non-smokers. Clin Exp Allergy. 2003; 33(11):1500–5.
https://doi.org/10.1046/j.1365-2222.2003.01730.xPMID:14616860
31. Giovannelli J, Cherot-Kornobis N, Hulo S, Ciuchete A, Clement G, Amouyel P, et al. Both exhaled nitric oxide and blood eosinophil count were associated with mild allergic asthma only in non-smokers. Clin Exp Allergy. 2015.
32. Jacinto T, Malinovschi A, Janson C, Fonseca J, Alving K. Evolution of exhaled nitric oxide levels throughout development and aging of healthy humans. J Breath Res. 2015; 9(3):036005.https://doi. org/10.1088/1752-7155/9/3/036005PMID:25993061
33. Jacinto T, Malinovschi A, Janson C, Fonseca J, Alving K. Differential effect of cigarette smoke exposure on exhaled nitric oxide and blood eosinophils in healthy and asthmatic individuals. J Breath Res. 2017; 11(3):036006.https://doi.org/10.1088/1752-7163/aa746bPMID:28825404
34. Utokaparch S, Sze MA, Gosselink JV, McDonough JE, Elliott WM, Hogg JC, et al. Respiratory viral detection and small airway inflammation in lung tissue of patients with stable, mild COPD. Copd. 2014; 11(2):197–203.https://doi.org/10.3109/15412555.2013.836166PMID:24088037
35. Kharitonov SA, Robbins RA, Yates D, Keatings V, Barnes PJ. Acute and chronic effects of cigarette smoking on exhaled nitric oxide. Am J Respir Crit Care Med. 1995; 152(2):609–12.https://doi.org/10. 1164/ajrccm.152.2.7543345PMID:7543345
36. Olin A-C, Rosengren A, Thelle DS, Lissner L, Bake Br, Tore´n K. HEight, age, and atopy are associated with fraction of exhaled nitric oxide in a large adult general population sample*. Chest. 2006; 130 (5):1319–25.https://doi.org/10.1378/chest.130.5.1319PMID:17099006
37. Telenga ED, Tideman SW, Kerstjens HA, Hacken NH, Timens W, Postma DS, et al. Obesity in asthma: more neutrophilic inflammation as a possible explanation for a reduced treatment response. Allergy. 2012; 67(8):1060–8.https://doi.org/10.1111/j.1398-9995.2012.02855.xPMID:22686834
38. Desai D, Newby C, Symon FA, Haldar P, Shah S, Gupta S, et al. Elevated sputum interleukin-5 and submucosal eosinophilia in obese individuals with severe asthma. Am J Respir Crit Care Med. 2013; 188(6):657–63.https://doi.org/10.1164/rccm.201208-1470OCPMID:23590263
39. Scott HA, Gibson PG, Garg ML, Wood LG. Airway inflammation is augmented by obesity and fatty acids in asthma. Eur Respir J. 2011; 38(3):594–602.https://doi.org/10.1183/09031936.00139810
PMID:21310876
40. Salome CM, King GG, Berend N. Physiology of obesity and effects on lung function. J Appl Physiol (1985). 2010; 108(1):206–11.https://doi.org/10.1152/japplphysiol.00694.2009PMID:19875713 41. Rutting S, Mahadev S, Tonga KO, Bailey DL, Dame Carroll JR, Farrow CE, et al. Obesity alters the
topographical distribution of ventilation and the regional response to bronchoconstriction. J Appl Physiol (1985). 2020 Jan 1; 128(1):168–177https://doi.org/10.1152/japplphysiol.00482.2019
PMID:31751179
42. Hartjes FJ, Vonk JM, Faiz A, Hiemstra PS, Lapperre TS, Kerstjens HAM, et al. Predictive value of eosin-ophils and neutreosin-ophils on clinical effects of ICS in COPD. Respirology. 2018; 23(11):1023–31.https:// doi.org/10.1111/resp.13312PMID:29696728
43. Schleich F, Brusselle G, Louis R, Vandenplas O, Michils A, Pilette C, et al. Heterogeneity of phenotypes in severe asthmatics. The Belgian Severe Asthma Registry (BSAR). Respir Med. 2014; 108(12):1723– 32.https://doi.org/10.1016/j.rmed.2014.10.007PMID:25456708
44. Pesci A, Balbi B, Majori M, Cacciani G, Bertacco S, Alciato P, et al. Inflammatory cells and mediators in bronchial lavage of patients with chronic obstructive pulmonary disease. Eur Respir J. 1998; 12(2):380– 6.https://doi.org/10.1183/09031936.98.12020380PMID:9727789
45. Rutgers SR, Timens W, Kaufmann HF, van der Mark TW, Koeter GH, Postma DS. Comparison of induced sputum with bronchial wash, bronchoalveolar lavage and bronchial biopsies in COPD. Eur Respir J. 2000; 15(1):109–15.https://doi.org/10.1183/09031936.00.15110900PMID:
46. Lezmi G, Deschildre A, Abou Taam R, Fayon M, Blanchon S, Troussier F, et al. Remodelling and inflammation in preschoolers with severe recurrent wheeze and asthma outcome at school age. Clin Exp Allergy. 2018; 48(7):806–13.https://doi.org/10.1111/cea.13143PMID:29603800
47. Zeig-Owens R, Singh A, Aldrich TK, Hall CB, Schwartz T, Webber MP, et al. Blood Leukocyte Concen-trations, FEV1 Decline, and Airflow Limitation. A 15-Year Longitudinal Study of World Trade Center-exposed Firefighters. Ann Am Thorac Soc. 2018; 15(2):173–83.https://doi.org/10.1513/AnnalsATS.
201703-276OCPMID:29099614
48. Chan-Yeung M, Abboud R, Buncio AD, Vedal S. Peripheral leucocyte count and longitudinal decline in lung function. Thorax. 1988; 43(6):462–6.https://doi.org/10.1136/thx.43.6.462PMID:3420557 49. Lamprecht B, Soriano JB, Studnicka M, Kaiser B, Vanfleteren LE, Gnatiuc L, et al. Determinants of
underdiagnosis of COPD in national and international surveys. Chest. 2015; 148(4):971–85.https://doi. org/10.1378/chest.14-2535PMID:25950276