Universidade de Lisboa Faculdade de Medicina de Lisboa
U
NRAVELING THE FUNCTION OF
CD11b+
MYELOID CELLS IN THE
TUMOR MICROENVIRONMENT
A
NAC
LÁUDIAD
OURADOC
LEMENTETese orientada pelo Doutor Sérgio Jerónimo Rodrigues Dias
M
ASTERS INO
NCOBIOLOGY 2014Todas as afirmações efetuadas no presente documento são da exclusiva responsabilidade do seu autor, não cabendo qualquer responsabilidade à Faculdade de Medicina de Lisboa pelos conteúdos nele apresentados.
A impressão desta dissertação foi aprovada pelo
Conselho Científico da Faculdade de Medicina de
Lisboa em reunião de 24 de Fevereiro de 2015.
“Life is not easy for any of us. But what of that? We must have perseverance and above all confidence in ourselves. We must believe that we are gifted for something and that this thing must be attained.” -Marie Curie
E porque acredito que este trabalho é mais um passo nesta minha busca, dedico-o
À minha mãe e ao meu pai, que sempre acreditaram em mim mais do que eu, e sempre souberam que conseguiria, mesmo antes de eu o achar.
Ao Diogo, que me deu o seu apoio incondicional, a minha base de sustentação.
À Ana e à Inês, que enfim, fizeram com que tudo acontecesse. Nem todas as palavras do mundo seriam suficientes para lhes agradecer. À minha família e aos meus amigos, que me apoiaram, e que me permitiram os momentos divertidos e descontraídos que recarregaram as
baterias ao longo dos anos. Muito obrigada
“Nothing in life is to be feared. It is only to be understood.” -Marie Curie
C
ONTENTS
Contents ... 5 Agradecimentos ... 9 Resumo ... 13 Abstract ... 15 Abbreviations ... 17 Figures Index ... 19 Chapter 1: Introduction ... 21 1. Cancer ... 21 2. Tumor Microenvironment ... 24TGF-β – the ambiguous element ... 25
Hypoxia and angiogenesis ... 26
Cell-Cell communication ... 28
3. Tumor-immunology and Inflammation ... 31
Tumor-mediated immune evasion ... 33
T Regs ... 33
MDSC – our main player ... 34
Macrophages ... 37
4. Cancer as a Systemic Disease ... 39
BM-Derived Cells ... 39
Aims ... 42
Chapter 2: Materials and Methods ... 43
qRT-PCR ... 43
Cell Culture ... 43
Flow cytometry and cell sorting ... 46
Immunofluorescence ... 47
Statistical analysis ... 47
Chapter 3: Results... 49
CD11b+ cells cultured in vitro with tumor microenvironment factors: RNA analysis ... 49
CD11b+ cells co-cultured with CD8+ cells induce T cell proliferation ... 52
CD11b+ cells pre-treated with CoCl2 fail to induce proliferation of CD8+ T cells ... 54
CoCl2 (100µM) induces a pre-apoptotic state in CD11b+ cells ... 58
CD8+ T cells pre-treated with CD11b+ cells show increased activation and cytotoxicity ... 60
Cultured CD11b+ cells show a significant increase in cell surface Jagged2 ... 62
Hypoxia decreases cell surface Jagged2 on CD11b+ cells. ... 64
Notch pathway does not appear to be involved in the induction of proliferation of CD8+ cells by CD11b+ cells .. 65
CD11b+ in vitro differentiate into a CD11b-CD14+Jag2+ population ... 67
Chapter 4: Discussion and Conclusions ... 69 Technical considerations ... 69 General discussion ... 73 Bibliography ... 77 Supplementary data ... 86 Attachments... 89 Primers list ... 89
AGRADECIMENTOS
9
A
GRADECIMENTOS
Um ano de trabalho de laboratório, principalmente quando tudo é novo, e todas as técnicas têm de ser aprendidas, implica muita gente e muita paciência. Não é fácil agradecer a todos.
Quero agradecer primeiro ao Sérgio, por me ter aceitado no laboratório, por me ter integrado e apoiado, pela paciência, disponibilidade e sinceridade, mas principalmente pela oportunidade que me deu de errar, de aprender, de crescer e de me formar. Muito obrigada.
Agradeço à comissão do mestrado, e à equipa de investigadores que me aceitou e tanto ensinou. Ao IPS (Instituto Português do Sangue), por toda a disponibilidade das amostras e trabalho incansável para toda a população.
Quero agradecer à Ana Barros e à Inês Martins, por todo o ano que passou. Pelas discussões, pelo apoio, pela compreensão. Pela amizade. Mas acima de tudo, por tudo o que me ensinaram, quer para a ciência, quer para a vida. A elas devo as páginas de discussão, e os resultados deste trabalho. Devo a invenção das experiências que foram feitas, devo o acalmar das frustrações científicas. Devo o essencial desta tese.
As meninas do lab foram imprescindíveis, destacando a Inês e a Germana, quero agradecer pelo apoio, pelas conversas, pelo ambiente descontraído e do melhor que se pode ter no dia-a-dia. Agradeço a amizade, paciência e descontração. A elas devo os protocolos, as técnicas, todas as horas passadas a ensinar, os conselhos e dicas, adaptações e alterações.
AGRADECIMENTOS
10
À Sara, à Diana, à Carolina e à Mariana quero agradecer estes dois anos. Mal sabíamos nós o que vinha, naquele dia de apresentação em que embarcámos todos na mesma aventura. Foi um caminho cheio de obstáculos e intenso mas foi fácil de ultrapassar tendo pessoas como vocês para partilhar as dificuldades. A elas devo um primeiro ano super atarefado, mas com um óptimo aproveitamento, e portanto, a conclusão deste mestrado com sucesso. Devo o descarregar das energias, os momentos de relax, e novas amizades que durarão para a vida.
Quero agradecer à Rita pelo apoio, pela amizade e compreensão, pela força que me deu desde sempre, por acreditar em mim desde o primeiro dia que me pediu para ser sua madrinha, ainda que mal me conhecesse. Por tornar os meus dias mais leves, mesmo quando ao fim do dia, saía do IMM com todo o peso em cima dos ombros. A ela devo muita da minha confiança.
Quero agradecer ao IMM, por me ter acolhido, e a todos os trabalhadores que de qualquer forma me ajudaram e ensinaram ao longo deste período. Um agradecimento especial à Ana Vieira, pelo apoio e ajuda incansáveis nas minhas idas ao FACS.
E por último, mas nunca menos importante, quero agradecer à minha família. À minha mãe, cuja disponibilidade é total quando se trata de me apoiar, não sei como é que ela faz, mas espero um dia estar à altura e poder demonstrar o meu agradecimento. Ao meu pai, sempre curioso sobre o que eu fazia, tantas vezes me deu a motivação que faltava, simplesmente por lhe explicar o que andava a fazer no laboratório. Ao Diogo, que viveu tão de perto comigo todos os momentos deste mestrado. Que me apoiou, que me ajudou a relativizar, que me aturou em todos os momentos, bons e maus. Que
AGRADECIMENTOS
11 me ajudou a concentrar, ou a afastar, consoante as necessidades. Que me estabilizou.
À minha avó, que tantas vezes me fez sentir útil ao perguntar-me curiosidades e dúvidas científicas. Ao perguntar-meu irmão, à minha tia, à minha prima, aos meus amigos e amigas, que apesar de não saberem as palavras desta tese, tiveram uma contribuição inimaginável. Quer pela curiosidade demonstrada, quer pelo simples facto de tantas vezes me permitirem viajar pelo universo com uma visão mais relaxada da ciência. Por me permitirem afastar do tema, e assim tomar consciência do mesmo. Por me mostrarem sempre, que há mais na vida, e que é cheia de coisas lindas.
E como podem ver, este trabalho que tem o meu nome, tem efetivamente muito pouco de só meu.
RESUMO
13
R
ESUMO
De acordo com a OMS (Organização Mundial de Saúde), em 2012 ocorreram 14.1 milhões de novos casos de cancro em todo o mundo, e a cada dois minutos, uma pessoa é diagnosticada com cancro no Reino Unido, por exemplo. Apesar do cancro ser uma doença conhecida há muito tempo, são divulgadas e publicadas descobertas científicas importantes todos os anos, o que torna a investigação em cancro um desafio atual.
Nos dias de hoje o cancro é entendido como uma doença “sistémica”, isto é, que influencia vários órgãos e não apenas uma massa de células com crescimento descontrolado e localizado num determinado órgão. A influência dos sistemas vascular e imunitário é um fator determinante para o desenvolvimento e progressão do cancro, para a eficácia terapêutica, e também para o estadiamento da doença.
Recentemente, com o desenvolvimento da imunoterapia, têm sido adotadas novas estratégias terapêuticas, com tentativas de tratamentos menos agressivos para os doentes, mais eficazes e com menos efeitos secundários.
Além das células cancerígenas em proliferação, o alvo preferencial para as estratégias terapêuticas atuais é o microambiente tumoral, que inclui todos os tipos celulares em contacto direto ou influenciados pelas células cancerígenas, pela matriz extracelular e pelos vasos sanguíneos que as rodeiam.
As células da linhagem hematopoiética mielóide têm um papel fundamental no microambiente tumoral. Em particular, as MDSCs, (células supressores derivadas da linhagem mielóide), um fenótipo
RESUMO
14
imaturo de células mielóides, suprimem a função de certos tipos de linfócitos T, originando uma forma de evasão tumoral ao sistema imunitário. Os mecanismos envolvidos na interação entre as MDSC e outros componentes da resposta imunitária são conhecidos, embora os fatores tumorais que estimulam a função das MDSC e a sua diferenciação estejam mal definidos.
Neste projeto isolámos MDSC (CD11b+) de sangue periférico de indivíduos saudáveis e conseguimos clarificar que as células CD11b+ induzem proliferação e ativação de células T num ensaio funcional in vitro mas que, após exposição a hipóxia, esse efeito deixa de ser observado. Procurámos assim identificar sinais do microambiente tumoral que pudessem estar envolvidos na ativação ou diferenciação das MDSC, bem como sinais que pudessem regular a comunicação entre as MDSC e células T.
A via Notch é uma das principais vias envolvidas na diferenciação de células mielóides, estando também implicada na comunicação inter-celular, nomeadamente entre células de diferentes linhagens. Neste trabalho mostramos que o ligando da via Notch denominado Jagged2 aumenta a sua expressão significativamente nas células CD11b+ ao longo do tempo em cultura, indicando o seu envolvimento na diferenciação destas células. Contudo, quando expostas a hipóxia, a expressão de Jagged2 diminui.
O trabalho realizado permitiu identificar sinais do microambiente tumoral que poderão modular a resposta imunitária do hospedeiro, nomeadamente no recrutamento e ativação ou diferenciação de MDSC.
ABSTRACT
15
A
BSTRACT
According to the WHO (World Health Organization) 14.1 million of new cases of cancer occurred worldwide in 2012, and every two minutes one person is diagnosed with cancer in the UK, for example. Although cancer is an old known disease, important findings are published every year, turning cancer research a contemporary challenge.
Nowadays cancer is understood as a systemic disease, meaning that it influences several organs and not only the cellular mass of uncontrolled cells localized in a specific organ. The influence of the vascular and immune systems is a key factor for the development and progression of cancer, cancer treatment, as well as the staging of the disease.
Recently, with the development of immunotherapy, new strategies for cancer treatment have been adopted, attempting for less aggressive treatments for the patients, more effective and with lower side effects.
Besides the proliferative cancer cells, the preferential target for current therapies is the tumor microenvironment which includes all the cell types contacting with or influenced by the cancer cells, the extracellular matrix and the surrounding blood vessels.
Myeloid cells are major players in tumor microenvironment. Myeloid Derived Suppressor Cells (MDSCs), an immature phenotype of myeloid cells, suppress the functions of specific T cells, generating another form of tumor evasion of the immune system. The mechanisms involved in the interaction between MDSC and other
ABSTRACT
16
components of the immune response are well known, however, which tumor factors trigger MDSCs functions and differentiation is unknown.
In this project we isolated MDSCs (CD11b+ cells) from healthy human peripheral blood and were able to clarify that CD11b+ cells induce T cells proliferation and activation, through a functional assay, but after exposed to hypoxia they failed to do it. Subsequently we tried to identify signals from the tumor microenvironment that could have an involvement in activation and differentiation of MDSC, as well as the signals that could regulate the communication between MDSC and T cells.
The Notch pathway is a major pathway in myeloid cells differentiation, and it is implied in inter-cellular communication, namely between cells with different lineages. In this work we show that the Jagged2, a ligand from the Notch pathway, increases its expression significantly over time, in vitro, in CD11b+ cells, suggesting a role in this cells differentiation. However, when exposed to hypoxia, Jagged2 expression decreases.
Together our data allowed the identification of tumor microenvironment signals that could have a role in modulating the host’s immune response, namely in the recruitment and activation or differentiation of MDSC.
ABBREVIATIONS
17
A
BBREVIATIONS
APC Antigen-presenting Cells
BM Bone-Marrow
BM-DC Bone Marrow-Derived Cells
BSA Bovine Serum Albumin
CAF Cancer Associated Fibroblasts
CD Cluster of Differentiation
cDNA Complementary DNA
CFSE Carboxyfluorescein Succinimidyl Ester CSF-1
(M-CSF)
Colony-stimulating factor-1 or macrophage colony-stimulating factor
CTL Cytotoxic T Lymphocytes
CTLA4 Cytotoxic T-Lymphocyte-Associated Protein 4
DNA Deoxyribonucleic Acid
ECM Extracellular Matrix
EGF Epidermal Growth Factor
EMT Epithelial-Mesenchymal Transition EPC Endothelial Progenitor Cells
FAS Fatty Acid Synthase
FGF Fibroblast Growth Factor
Hif Hypoxia Inducible Factor
IL-2 Interleukin 2
IMC Immature Myeloid Cells
iNOS Inducible Nitric oxide synthase
mAb Monoclonal Antibody
MDSC Myeloid Derived Suppressor Cells
ABBREVIATIONS
18
PBMCs Peripheral Blood Mononuclear Cells
PBS Phosphate Buffered Saline
PD1 Programmed cell death protein 1
PDGF Platelet Derived Growth Factor PI3K Phosphatidylinositol-3-kinase
PS Phospholipid Phosphatidylserine
qPCR Quantitative Polymerase Chain Reaction
RBC Red Blood Cells
RNA Ribonucleic Acid
RT-PCR Reverse Transcription Polymerase Chain Reaction T-ALL T cell Acute Lymphoblastic Leukemia
TAM Tumor Associated Macrophages
TGF Transforming Growth Factor
FIGURES INDEX
19
F
IGURES
I
NDEX
Figure 1. Therapeutic Targeting and the Hallmarks of Cancer 22 Figure 2. Major players in tumor microenvironment 24 Figure 3. Some examples of angiogenic activators and inhibitors 27 Figure 4. Illustration of the Notch signaling pathway. 29
Figure 5. The origin of MDSCs. 34
Figure 6. Illustrative protocol for the Suppression/Proliferation assay, adapted
from from Melissa G Lechner et al. 45
Figure 7. Cobalt Chloride mechanism of action. 46 Figure 8. RNA analysis shows a large heterogeneity among donors. 50 Figure 9. CD11b+ cells induce proliferation of CD8+ cells. 52
Figure 10. CD11b+ cells previously treated with CoCl2 (100µM) fail to induce
proliferation of CD8+ cells. 54
Figure 11. Co-culture of CD11b+ cells pre-treated with breast cancer cells or
hypoxia showed CD8+ cells inhibition of proliferation. 56 Figure 12. Cobalt Chloride cultured cells show thereabout more 40% of cells
in apoptotic and pre-apoptotic state, and more 20% of dead cells. 58 Figure 13. CD8+ cells pre-treated with CD11b+ cells kill breast cancer cells
more efficiently. 60
Figure 14. Jagged2 increases in CD11b+ cells in vitro.. 62
Figure 15. CD11b+ cells treated with CoCl2 show decreased Jagged2. 64 Figure 16. Inhibitors of the Notch pathway did not show any effect in the
FIGURES INDEX
20
Figure 17. CD11b+ cells lose their CD11b expression and differentiate into
two different populations: CD11b+CD14+Jag2+ and CD11b-CD14+Jag2+.
68 Figure 18. CD11b+ cells adhere to the culture plate after 5 days of in vitro
culture. 72
Figure 19. 7 donors represented in the proliferation assay for CD8+ cells. 86
Figure 20. CD11b and CD8 purity after isolation from buffy coats with MACS
beads. 86
Figure 21. Representative example of a Side Scatter/CFSE plot of a
functional assay for CD8+ proliferation. 87
CHAPTER 1: INTRODUCTION - Cancer
21
C
HAPTER
1:
I
NTRODUCTION
1. Cancer
“Cancer, we now know, is a disease caused by the uncontrolled growth of a single cell. This growth is unleashed by mutations— changes in DNA that specifically affect genes that incite unlimited cell growth. In a normal cell, powerful genetic circuits regulate cell division and cell death. In a cancer cell, these circuits have been broken, unleashing a cell that cannot stop growing” wrote Siddhartha
Mukherjee in his book The Emperor of all Maladies (Mukherjee, 2010). In fact cancer can be a lot of different diseases; one for each organ, and even in the same organ, lot of different “cancers” may develop. The molecular signature of certain cancers is, nowadays, used to determine which kind of therapy will be most effective to treat a patient, and what the prognosis should be (Weinberg, 2014).
More than simple genetic alterations, cancer is now characterized as “a complex tissue composed of multiple distinct cell types that participate in heterotypic interactions with one another” (Hanahan and Weinberg, 2011) and the understanding of the neoplastic process has been evolving gradually from considering a cancer as a mass of mutated cells incapable of controlling their proliferation, to a systemic disease, where the whole organism, from the single (or multiple) clone genetic mutations, its own metabolic signals, the whole vascular system and the immune system, are altered and play a part in favoring or fighting the tumor (Weinberg, 2014).
CHAPTER 1: INTRODUCTION –Cancer
22
In the Hallmarks of Cancer: The Next Generation, the authors defined 10 capabilities that cancer acquires during its development (Hanahan and Weinberg, 2011), 10 interconnected “steps” that contribute towards defining and promoting the development of a cancer.
In Figure 1, the 10 capabilities are shown. Each box contains examples of therapeutics designed to block particular capabilities, however most important are the targets. During the last year, we focused essentially in three of them: Activating invasion & metastasis, Tumor-promoting inflammation and Avoiding immune destruction.
Figure 1. Therapeutic Targeting and the Hallmarks of Cancer (Weinberg,
CHAPTER 1: INTRODUCTION – Breast Cancer
23
The example of Breast Cancer
One specific interest of our lab is breast cancer. According to the World Cancer Research Fund, breast cancer is the most common cancer in women worldwide. (Ferlay J. et al., 2013)
A characteristic of breast cancer is its microenvironment, which broadly consists of ECM (extracellular matrix), endothelial cells, immune cells, fibroblasts and adipocytes. These cell types contribute towards disease onset and progression: endothelial cells can proliferate and form new vessels (angiogenesis), immune cells infiltrate the tumor and act either as tumor-promoting or tumor-antagonizing cells, fibroblasts become CAFs (cancer-associated fibroblasts) promoting cancer initiation, angiogenesis and metastasis, and adipocytes promote tumor growth, survival and invasion by secreting specific cytokines. (Hanahan and Weinberg, 2011; Mao et al., 2013)
CHAPTER 1: INTRODUCTION – Tumor Microenvironment
24
2. Tumor Microenvironment
Understanding the tumor microenvironment (schematically represented in Figure 2 where is important to notice the cell types, the vascular net and their interactions) is a very challenging task. One example of such endeavor goes back to 1863, when Rudolf Virchow reported a connection between inflammation and cancer. Later in 1986, Harold Dvorak noticed that cancers share two mechanisms with the inflammatory process: angiogenesis and infiltration of inflammatory cells, being comparable to “Wounds that do not heal” (Balkwill and Mantovani, 2001; Dvorak, 1986; Quail and Joyce, 2013). Today, the tumor microenvironment is an important therapeutic target, and is included in 5 of the 10 hallmarks/capabilities of cancer.
The next Sections will discuss certain features of the tumor microenvironment
CHAPTER 1: INTRODUCTION – Tumor Microenvironment
25
TGF-β – the ambiguous element
TGF-β (transforming growth factor), acts on many “sides” of cell behavior: differentiation, alterations of microenvironment, migration, adhesion and proliferation; its signaling essentially favors proliferation during embryonic development, although, as tissues mature, cell types respond to TGF-β signals with growth arrest or cell death. More than TGF-β itself it’s the nature of a cell that determines the role of these signals (Siegel and Massagué, 2003).
For example, in the skin, TGF-β signals affect the different layers in different ways: in differentiated suprabasal layers, when overexpressed, resulted in an increased proliferation, however, in the proliferative basal layer, this overexpression caused growth inhibition. TGF-β variation of effects is extended to endothelial, immune and neuronal cells (Liu et al., 2001; Siegel and Massagué, 2003).
Because of this variation of effects, it is easy to expect that TGF-β plays key roles in cancer. Mutations are frequently found in TGF-β receptors (TβRI and II) in ovarian, breast, gastric and pancreatic tumors. SMADs, the downstream targets of TGF-β receptors activation, are also frequently mutated in several cancers, and were first identified as tumor-suppressors (Siegel and Massagué, 2003).
Although the role of TGF-β signaling pathway seems to be onco-suppressive in early-stage tumors, there are cases where tumor cells become resistant to TGF-β cytostatic function. When tumor cells growth ceases to be controlled by TGF-β, this cytokine can now act in the tumor microenvironment, contributing to promote invasion and metastasis. (Siegel and Massagué, 2003)
CHAPTER 1: INTRODUCTION – Tumor Microenvironment
26
Apart from its direct effect on cancer cells, TGF-β is described to have major roles in other cell types, re-educating the tumor microenvironment: it inhibits the growth of many haematopoietic cell lineages, and has a very important role impairing T-cell activation (Brabletz et al., 1993) through preventing maturation of APCs (Geissmann et al., 1999; Quail and Joyce, 2013).
TGF-β has an important role also in EMT (epithelial to mesenchymal transition): among other effects, TGF-β induces expression of factors that repress the transcription of E-cadherin, resulting in loss of these adhesion molecules which secure the cell-cell adhesion in epithelial like structured tissues, promoting the transition to a mesenchymal phenotype, that can ultimately lead to the formation of metastasis (Oft et al., 1996).
In angiogenesis, TGF-β can induce the expression of VEGF and other angiogenic factors, whose importance will be explained in the next section (Siegel and Massagué, 2003).
Hypoxia and angiogenesis
One important characteristic of the tumor microenvironment is its deficiency in O2, termed hypoxia: rapidly growing tumors need more
oxygen and nutrients. In 1971 Judah Folkman hypothesized that controlling tumor growth by attacking its blood supply should be considered an effective therapeutic alternative. These first studies set up the stage for tumor “angiogenesis” to be considered - and almost 30 years later - is considered also a Hallmark of all cancers (Folkman, 1971; Hanahan and Weinberg, 2011).
Angiogenesis, the formation of new vessels from pre-existing ones, is crucial for tumor growth (Folkman, 1971). This requires the cooperation of the microenvironment and the contribution of different
CHAPTER 1: INTRODUCTION – Tumor Microenvironment
27 cell types, from vascular endothelial cells to pericytes and BM-derived precursor cells. When tumors reach a size where they no longer have enough oxygen and nutrients to grow, the angiogenic-switch takes place. This switch consists of an unbalance between angiogenic activators and inhibitors, favoring the former over the latter (Folkman and Hanahan, 1991; Liao and Johnson, 2007; Ribatti et al., 2007). In
Figure 3 some of these factors are shown.
VEGF, an angiogenesis activator, has a crucial role in the formation of the new vessels (Leung et al., 1989). VEGF transcription is induced by HIF1 proteins, which are functional when accumulated due to hypoxia (Ryan et al., 1998). VEGF functions as a ligand of tyrosine kinase receptors, and once those are stimulated, the endothelial cells proliferate and start forming new vessels (Carmeliet, 2000).
Additionally to endothelial cells, EPCs (endothelial progenitor cells) can also be recruited from the bone marrow to the tumor microenvironment, where they are believed to differentiate into endothelial cells (postnatal vasculogenesis) (Asahara et al., 1999), Figure 3. Some examples of angiogenic activators and inhibitors (Bergers
CHAPTER 1: INTRODUCTION – Tumor Microenvironment
28
thus contributing towards the expansion of the tumor vascular bed (Caiado and Dias, 2012).
Tumor angiogenesis is perpetuated by the contribution of other cells in the tumor microenvironment. A variety of BM-Derived Cells, such as TAMs (Tumor Infiltrating Macrophages) for example, release VEGF, FGF and other proangiogenic cytokines and can also contribute to the “normalization” of the vasculature after treatment with inhibitors of VEGF signaling (Lewis and Pollard, 2006).
Cell-Cell communication
Besides environmental changes, cytokines and other soluble factors that are secreted into the tumor matrix, other important sort of signals that can influence the tumor are the signals transmitted by other cells trough direct contact: cell-cell communication.
E-cadherin
E-cadherin is the molecule responsible for cell-cell adhesion in epithelial cells, forming the adherens junctions. It regulates growth and invasion since it is the sensor that tells cells if they are already forming an organized layer or tissue and provides structural integrity and polarity to the epithelial cells. It is easy to see now why it is called a tumor suppressor: loss or abnormal expression leads the cancer cells to grow and evade neighboring tissues and organs (Paredes et al., 2012; van Roy, 2014).
NOTCH pathway
Another player in cell-cell communication is the Notch signaling pathway with the ligands: Delta 1, 3 and 4, Jagged 1 and 2, and receptors: NOTCH1 to 4 (Lobry et al., 2011).
CHAPTER 1: INTRODUCTION – Tumor Microenvironment
29 The Notch pathway has a determinant role in cell-fate decisions during development and post-natal life: maintenance of stem cells, proliferation and apoptosis (Artavanis-Tsakonas et al., 1995). The mechanisms involved in the regulation of Notch signaling are depicted in Figure 4.
The role of this pathway in cancer is mainly known by frequent mutations (56%) in T-ALL cases as it encodes a transmembrane receptor required for the commitment of pluripotent progenitors to T cell fate and the assembly of the pre-T cell receptor (Weng et al., 2004).
Figure 4. Illustration of the Notch signaling pathway. Notch signalling is initiated by the direct interaction of Notch receptors with Notch ligands on neighbouring cells. Notch ligands that are expressed by microenvironmental cells bind to Notch receptors on haematopoietic progenitors, inducing the -secretase-mediated cleavage of intracellular Notch (ICN). ICN translocates to the nucleus, where it interacts with several transcription factors (Zúñiga-Pflücker, 2004).
Besides T-ALL, Notch has already been identified as oncogene in other liquid and solid cancers, but more recently, their functions as tumor suppressor have highlighted that this pathway’s role is far more complicated (Lobry et al., 2011). Notch has already been implied in metastasis: Jagged1 was described as an important mediator of bone metastasis of breast cancer, promoting tumor growth by
CHAPTER 1: INTRODUCTION – Tumor Microenvironment
30
stimulating IL-6 release from osteoblasts and directly activating osteoclast differentiation (Sethi et al., 2011).
More recently it was described by our lab that CD11b+ cells expressing JAG2 promote EMT and metastization in colorectal cancer; additionally, this cells are recruited from the bone marrow to the tumor microenvironment, and are correlated with the presence of metastasis in colorectal cancer patients (Caiado et al., 2013).
CHAPTER 1: INTRODUCTION – Tumor-immunology and Inflammation
31
3. Tumor-immunology and Inflammation
The immune system has been known to be related to ”malignant” (oncological) diseases, and in the beginning this was easily explained by an attempt of the body to fight the cancerous cells, as explained by Burnet and Thomas in their cancer immune surveillance hypothesis (Burnet, 1970; Thomas, 1982). Although by that time strong experimental evidence was lacking, nowadays there are examples that verify their theory: immuno compromised mice are more likely to develop tumors, as are people with immunodeficiencies (Dunn et al., 2002; Ostrand-Rosenberg, 2008; Shankaran et al., 2001). Similarly, and perhaps more evidently, chronic inflammation has been associated with increased tumor risk: 20% of cancers arise from chronic infections, for instance Helicobacter pylori infections are linked to gastric cancers (Suerbaum and Michetti, 2002) and HPV infections can promote tumorigenesis in the cervix (Schiffman et al., 2007). Other connection between inflammation and cancer emerges from risky behaviors which trigger chronic inflammation: lung cancers due to smoking and pollutants inhalation, hepatic cancers in alcoholic and/or obese patients, whose risk for pancreatic cancer is increased as well, among many other examples (Fridman et al., 2012; Grivennikov et al., 2010).
Naturally, resulting from this close connection between inflammation and cancer, the tumor microenvironment is full of inflammatory cells: with both pro-tumoral and anti-tumoral effects, and in addition, the tumor itself has mechanisms to escape from all this regulation.
CHAPTER 1: INTRODUCTION – Tumor-immunology and Inflammation
32
The work developed in the context of this Thesis focused mainly in the capacity of tumors to evade the immune system.
CHAPTER 1: INTRODUCTION – Tumor-immunology and Inflammation
33
Tumor-mediated immune evasion
Immune checkpoints are a group of inhibitory pathways that help to control self-tolerance and modulate the duration and intensity of an immune response. It is now clear that tumor cells are “selected” by its capacity of overcoming this regulatory response, thus evading the immune response (Pardoll, 2012). Some examples are the expression of PDL1 and CD80 by tumor cells, which are ligands for the PD1 and CTLA4 (Cytotoxic T Lymphocyte Associated protein 4) receptors that once activated impair CTL activity and consequently act in a tumor protective way (Parry et al., 2005).
T Regs
T Regs are regulatory T cells that have a major role in sustaining self-tolerance and immune homeostasis. Consequently, when the tumor is infiltrated with these cells, they have a pro-tumoral action (Sakaguchi et al., 2008). They can originate from the thymus, and are called natural Tregs, or can be induced locally (iTregs), both subsets can restrain the activation of T effector cells either in a contact-dependent or contact-independent way (Jacobs et al., 2012). Naïve CD4+ CD25- T cells can differentiate into Tregs when exposed to an antigen in immunosuppressive conditions, as in the presence of TGF-β (Chen et al., 2003).
Tumor educated myeloid cells, like MDSC (Myeloid Derived Suppressor Cells) can attract and induce Tregs, and support the de
novo Tregs development in a TGF-β depending (and also
CHAPTER 1: INTRODUCTION – Tumor-immunology and Inflammation
34
MDSC – our main player
Myeloid cells comprise a large group of very distinct cell types such as macrophages, dendritic cells and granulocytes, and are the most abundant nucleated hematopoietic cells in the human body (Kindt et al., 2007).
The tumor microenvironment has the ability to alter myeloid cells into immunosuppressive cells: Myeloid Derived Suppressor Cells (MDSCs), which, together with T Regs are the major component of the immune suppressive tumor microenvironment (Gabrilovich et al., 2012; Lindau et al., 2013).
MDSCs in turn, are a heterogeneous population that comprises different cell subsets: myeloid progenitor cells and immature myeloid cells (IMCs), which in common have a T-cell suppressive activity. Besides their action in the adaptive immune response, MDSCs can also regulate innate immune responses and promote tumor angiogenesis and metastasis (Gabrilovich and Nagaraj, 2009).
Figure 5. The origin of MDSCs a) Myelopoiesis takes place in the bone marrow b)
IMCs migrate to peripheral organs, and differentiate, however, in cases of infection, trauma or cancer, they accumulate at these sites undifferentiated, originating MDSCs (Gabrilovich and Nagaraj, 2009).
CHAPTER 1: INTRODUCTION – Tumor-immunology and Inflammation
35 In healthy individuals, after being generated in the bone marrow, IMCs rapidly differentiate into mature granulocytes, dendritic cells or macrophages whereas in pathological conditions such as cancer, infection or trauma, occurs a blockade of this differentiation, and the IMC population is expanded from which the MDSC population originates (Figure 5) (Gabrilovich and Nagaraj, 2009).
In healthy individuals IMCs are approximately 0.5% of the PBMCs, but the population of MDSCs is increased in several cancer types which is often correlated with a poor prognosis (Almand et al., 2001; Diaz-Montero et al., 2009; Solito et al., 2014).
Defining markers for identification of MDSCs has been a challenging task since this is such a heterogeneous cell population. However, and depending on the tumor context, they are most commonly defined as CD11b+CD33+, but the only accepted definition is obtained through T cell suppression functional assays (Gabrilovich and Nagaraj, 2009; Solito et al., 2014). Human MDSCs include monocytic (MO-MDSC) and granulocytic (G-MDSC) subsets, and the existence of a large number of MDSCs phenotypes (Table 1) led to the foundation of a human MDSC proficiency panel under the guidance of the Association of Cancer Immunotherapy Imunoguiding Program, as an effort to standardization (Solito et al., 2014; Talmadge and Gabrilovich, 2013).
Table 1.Six reported MDSC human phenotypes using a single multicolor staining protocol (Solito
et al., 2014). Definition Phenotype MDSC1 CD14+ IL-4Rα+ MDSC2 CD15+ IL-4Rα+ MDSC3 Lineage− HLA-DR− CD33+ MDSC4 CD14+ HLA-DRlow/− MDSC5 CD11b+ CD14− CD15+ MDSC6 CD15+ FSClow SSChigh
CHAPTER 1: INTRODUCTION – Tumor-immunology and Inflammation
36
Mechanisms of action
There are two main mechanisms for T cell suppression by MDSC: depletion of specific amino acids such as L-arginine trough upregulation of ARG-1 (arginase 1) and iNOS (inducible nitric oxid synthase) which oxidizes L-arginine and generates NO and citrulline. The second mechanism is the production of ROS (reactive oxygen species) such as H2O2, (depletion of L-arginine can also lead to the
production of H2O2) both mechanisms inhibit expression of CD3ζ
chain, arresting T cell cycle in G0-G1 phase (Rodriguez et al., 2004; Solito et al., 2014; Talmadge and Gabrilovich, 2013).
Mechanisms of expansion
Several factors that can be found in the tumor
microenvironment such as VEGF, M-CSF, GM-CSF and
prostaglandins trigger the JAK/STAT3 signaling pathway, involved in cell survival, differentiation, proliferation and apoptosis (Bromberg, 2002; Gabrilovich et al., 1998; Serafini et al., 2004; Sinha et al., 2007). STAT3 activation is related with survival of myeloid progenitors, so abnormal activation impairs myeloid cells maturation/differentiation leading to MDSC expansion (Gabrilovich and Nagaraj, 2009).
In 1978 it was first reported a T cell suppressor activity. Since then, MDSCs were identified, their mechanisms of action described, their different roles in different cancer types unveiled, and even therapies that target their suppressive function are being tested. However, the factors that drive their recruitment into the tumor microenvironment, or what prevents the IMCs from differentiate are far to be known (Solito et al., 2014; Talmadge and Gabrilovich, 2013). In this project we aim to test different factors present in the tumor microenvironment and identify their relation with CD11b+ cells.
CHAPTER 1: INTRODUCTION – Tumor-immunology and Inflammation
37
Macrophages
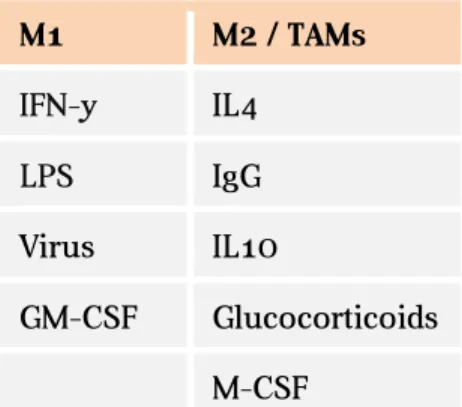
Macrophages, a fully differentiate state of myeloid cells, can present two opposite types of polarization, according to the cytokines available: classic activation vs. alternative activation, distinguishing this way, respectively, M1 and M2 macrophages. In the context of tumor microenvironment, M2 like macrophages are called Tumor Associated Macrophages (TAM) (Galdiero et al., 2013; Mantovani et al., 2002). In the Table 2 are examples of the cytokines that lead to each polarization status.
Table 2.M1 and M2 stimuli in macrophages (Martinez and Gordon, 2014)
TAMs have an important role in tumor progression due to their capacity of remodeling the ECM, promoting invasion and metastasis, as well as angiogenesis and immune suppression (Table 3 illustrates some cytokines produced by TAMs and the consequences). In some tumors CSF1 (colony-stimulating factor 1) is secreted by tumor cells and acts as the key attractant for macrophages/monocytes (Galdiero et al., 2013; Lin et al., 2001).
Although with very distinct roles in cancer, myeloid cell types, such as macrophages, are closely related and can express frequently the same markers, turning their identification through surface markers
M1 M2 / TAMs IFN-γ IL4 LPS IgG Virus IL10 GM-CSF Glucocorticoids M-CSF
CHAPTER 1: INTRODUCTION – Tumor-immunology and Inflammation
38
a non-reliable process. Because of that, during this work we tried to identify different cell types with both functional assays and cell surface markers.
CHAPTER 1: INTRODUCTION – Cancer as a Systemic Disease
39
4. Cancer as a Systemic Disease
At this point one can already understand that cancer is far from being a disease from a specific tissue or organ. Cancer is a systemic disease as it affects different systems and the major cause of death in cancer is the spread of malignant cells to other parts of the body, forming metastasis (Hanahan and Weinberg, 2000).
In 1889, Stephen Paget elaborated the “seed and soil” principle, stating that the disseminated cancer cells could only settle and form metastasis in tissues that they were “adapted” to, which is today the most accepted theory explaining the origin of metastasis since it largely explains why different primary tumors have a “preferential” organ to which they metastasize (Talmadge and Fidler, 2010).
Metastases are formed through a process that encloses the escape of the cancer cells (Intravasation) into the blood circulation where they die, become dormant or proliferate, and Extravasation, when they leave the bloodstream and invade the target organ (Chambers et al., 2002).
One of the processes that “prepares” cells to intravasate is called EMT (Epithelial-to-Mesenchymal Transition), where the epithelial cells that form the tumor lose epithelial markers (responsible for cell adhesion) and start expressing mesenchymal markers (associated with cell motility and invasion capacity) (Hugo et al., 2007).
BM-Derived Cells
Another important example of how systemic cancer is, is the recruitment of cells from the bone-marrow to the cancer
CHAPTER 1: INTRODUCTION – Cancer as a Systemic Disease
40
microenvironment, which has been shown to be important at different stages of the carcinogenic process.
As explained before, the tumor microenvironment comprises different cell types, and some of them are present in the ECM, while others, such as TAMs and MDSCs are recruited from the bone marrow into the tumor site.
It was recently showed by our lab that BM-DCs, CD11b+Jagged2+ are recruited to the tumor site, where they promote EMT and metastization in colorectal cancer (Caiado et al., 2013).
Besides hematopoietic cells, other cell types such as endothelial progenitor cells (EPCs) are also recruited from the bone marrow and contribute to postnatal vasculogenesis via their differentiation into functional endothelial cells and also by the paracrine interaction with pre-existing endothelia at the primary tumor site (Caiado and Dias, 2012).
Metabolic Signals
One emerging hallmark of cancer is the Reprogramming Energy Metabolism, which represents the adjustments that cancer cells need to undergo in order to maintain their proliferative and invasive potential (Hanahan and Weinberg, 2011).
Warburg was the first to observe that cancer cells, even in the presence of oxygen, can reprogram their glucose metabolism limiting it largely to glycolysis instead of proceeding to process the pyruvate into carbon-dioxide (WARBURG, 1956). Although this does not appear to be the most efficient way to obtain energy (ATP), cancer cells adapt to it by upregulating the expression and function of glucose transporters (Feron, 2009). This metabolic switch can also be a protective measure due to the hypoxic conditions frequently observed inside the tumors.
CHAPTER 1: INTRODUCTION – Cancer as a Systemic Disease
41 In recent years, a clear link between well established cancer-related signaling pathways and the regulation of the cell metabolism has been put forward (Cairns et al., 2011; Hanahan and Weinberg, 2011).
One recently recognized alteration in cancer metabolism that correlates with malignancy is the development of a lipogenic phenotype. Among deregulated metabolic pathways, the upregulation of FAS (fatty acid synthase) correlated with poor prognosis in breast cancer patients, and its inhibition resulted in loss of cell viability, decreased cell proliferation and decreased tumor growth in vivo (Menendez and Lupu, 2007; Nomura et al., 2010).
Besides fatty acids, other families of lipids have roles in tumor malignancy. Moreover, membrane-bound lipid based structures such as lipid rafts are involved in cell membrane stability, motility and signal transduction. In addition, protumorigenic lipid signaling molecules (as in the PI3K, phosphatidylinositol-3-kinase signaling pathway), and low density lipoproteins (LDL) have been shown to induce breast cancer proliferation, invasion, promote bone marrow cell mobilization and migration (Antalis et al., 2011; Cairns et al., 2011; Rodrigues Dos Santos et al., 2014; dos Santos et al., 2014).
Previous studies in the Lab have shown that hypercholesterolemia promotes bone marrow cell mobilization, including of CD11b+ cells (as described by (Gomes et al., 2010)) and seems to have a crucial role in the breast cancer progression (Rodrigues Dos Santos et al., 2014), one of the aims of this project was to test if LDL had an effect on CD11b+ cells activation.
AIMS
42
A
IMS
The original project intended to explore the role of LDL in bone marrow cell recruitment and immune suppression in breast cancer.
At first, we wanted to test the effect of an LDL-enriched environment in a population of cells that induces immune suppression in cancer: MDSC (Myeloid Derived Suppressor Cells). Because the results of these experiments did not suggest a causal effect, the LDL condition was abandoned, and we proceeded to study other factors from the tumor microenvironment that could affect immune cell responses such as hypoxia and angiogenic factors (that trigger the formation of new vessels thus allowing the immune cells to invade the tumor microenvironment) and the Notch pathway (involved in myeloid cells differentiation states.).
As such, the global aim for the project was to identify which tumoral factors drive CD11b+ (bone marrow derived) cells into an immune suppressive phenotype, which is nowadays poorly understood, and which surface and functional markers could be relevant for future identification of immune suppressive myeloid cells, which may ultimately result in therapies for reprogramming the pro-tumoral effects of the immune system.
CHAPTER 2: MATERIALS AND METHODS
43
C
HAPTER
2:
M
ATERIALS AND
M
ETHODS
qRT-PCR
RNA extraction (TRIzol, Invitrogen; NZY Total RNA Isolation kit, Nzytech) and cDNA synthesis (Reverse-transcription with Superscript II reverse transcriptases (Invitrogen) were performed following the standard protocols or the manufacturer’s protocol (Nzytech). Concentrations of RNA were determined using Nanodrop ND 1000 (Nucliber). Primers used for qPCR are listed in Primers List, and were designed using Ensembl BLAST/BLAT tool. For qPCR analysis, cDNA was amplified in an 8μL reaction volume with SYBR Green PCR master mix (Applied Biosystems), and reactions were run in ViiA 7 (Applied Biosystems). Reactions consisted in 2 min at 50ºC, 10 min at 95ºC followed by 40 cycles of 15 sec at 95ºC and 1 min at 60ºC. Expression was normalized to 18S and expressed in arbitrary units.
Cell Culture
Primary samples
The human blood buffy coats were kindly provided by Instituto Português do Sangue e Transplantação, IP, from healthy donors of both genders. The blood was processed through Ficoll-Paque (Lymphoprep, Axis-Shield PoC AS) gradient and the red blood cells were lysed with RBC Lysis Buffer (Santa Cruz Biotechnology). CD11b+, CD33+ and CD8+ cells were then sorted using MACS Microbeads (Miltenyi) according to the manufacturer protocol. Sorted cells were kept in culture in RPMI Medium 1640 (GIBCO) supplemented with 10%FBS (fetal bovine serum, Sigma-Aldrich) and antibiotics at 37ºC and 5% CO2.
CHAPTER 2: MATERIALS AND METHODS
44
Cell lines
MDA MB 231 cells were cultured 1x10⁴/well in 96 U bottom well plates in DMEM supplemented medium (GIBCO) with 10% FBS (fetal bovine serum, Sigma-Aldrich).
Suppression/Proliferation assays
CD11b+ or CD33+ cells sorted from human buffy coats were cultured for 72h in a 96 U bottom well plate (Nunc), in RPMI
supplemented medium (GIBCO), Human TGFβ1 (10ng/mL)
(Peprotech,inc), Cobalt chloride CoCl2 (50μM and 100μM)
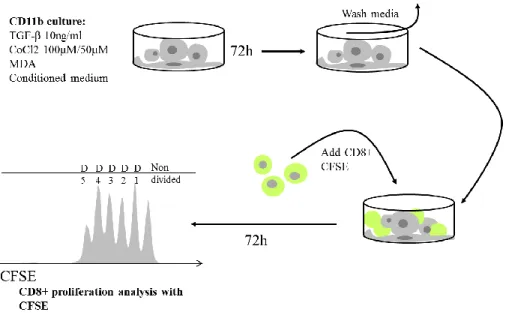
(Sigma-Aldrich), VEGF (5ng/mL) (Sigma-(Sigma-Aldrich), MDA MB 231 cells or Conditioned Medium from MDA MB 231 cells cultured for 48h, were added according to the protocol. 72h after, cells were washed 2x with PBS 1x (GIBCO), and CD8+ cells sorted from human buffy coat were added in a 1:3 ratio. CD8+ cells were labeled with CFSE (CellTrace CFSE kit, Invitrogen, final concentration 0.5mM) and then were co-cultured with the pre-treated CD11b+ cells in RPMI supplemented medium, IL-2 (100U/mL) (Sigma) and α-CD3 pure (10ng/mL) (130-093-387, Miltenyi Biotec) for activation and proliferation.(Wong and Pamer, 2001) Where indicated, γ-secretase inhibitor or GSI (LY-411575, Sigma-Aldrich) was added to co-cultures at a final concentration of 20nM and respective controls received DMSO (Sigma-Aldrich). CD8+ cells proliferation was analyzed by flow cytometry 72h after. This protocol was adapted from (Lechner et al., 2011). See Figure 6.
CHAPTER 2: MATERIALS AND METHODS
45 For RNA extraction, CD8+ cells were not incubated with CFSE, both CD11b+ and CD8+ cells were sorted after 72h of co-culture with High Speed Cell Sorter Aria (BD Biosciences).
Figure 6. Illustrative protocol for the Suppression/Proliferation assay, adapted from from Melissa G Lechner et al.
CHAPTER 2: MATERIALS AND METHODS
46
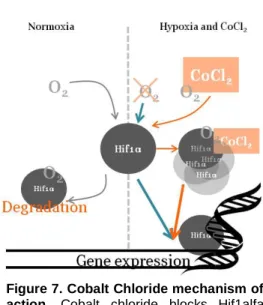
Cobalt Chloride
It is important to note at this point, that one important reagent used in this work was cobalt chloride, which is a chemical inducer of hif1α expression, thus mimicking hypoxia in cell cultures (Al Okail, 2010). Its mechanism of action is illustrated in Figure7.
Flow cytometry and cell sorting
For cell surface staining, cells were washed with PBS 1x and incubated for 15 min at 4ºC with the following mAbs: CD8+ (PerCP, 344707, Biolegend), CD11b+ (APC, 301310, Biolegend), Jagged2 (PE, 346904, Biolegend), CD14 (Dako, M0225) conjugated with Alexa 488 anti-mouse (A11059, Invitrogen), with a 1:100 concentration.
For proliferation analysis, intracellular staining: CFSE (CellTrace CFSE kit, Invitrogen, final concentration 0.5mM) was used following the indications of the manufacturer.
For cell death analysis, PE Annexin V (BD Biosciences) was used, accordingly to the manufacturers’ protocol. Annexin V binds to the PS in the inner leaflet of the plasma membrane serving as a probe for flow cytometric analysis of cells that are undergoing apoptosis. Figure 7.Cobalt Chloride mechanism of
action. Cobalt chloride blocks Hif1alfa
degradation allowing its accumulation leading to the expression of hypoxia responsive genes.
CHAPTER 2: MATERIALS AND METHODS
47 Samples were acquired using FACSCalibur or LSR Fortessa 1 (both from BD Biosciences). Data were analyzed using FlowJo software (Tree Star). Live subsets for RNA extraction were electronically sorted using FACSAria (BD Biosciences).
MFI. Median Fluorescence Intensity, normalized to unstained, was used for statistical analysis and graphic representation of FACS data.
Immunofluorescence
CD11b+ cells cultured either in 24 well-plates (1x10⁶/cm2) or in glass slides (Cytospin); cells were fixed with 2% PFA (Polysciences, Inc.) for 10 min, and then blocked with PBS (1x) BSA 2% for 1 hour. Slides/cells were then covered with primary anti-human antibodies: Jagged2 (MHJ2-523, AbCam), Jagged2 (goat) (SC-8158, Santa Cruz), CD14 (Dako, M0225), after 1 hour incubation, slides/cells were washed 3 x PBS BSA 2% and incubated another hour with secondary antibodies from Invitrogen: anti-mouse Alexa594, anti-mouse Alexa488 and anti-goat Alexa488. DAPI was used together with VECTASHIELD® Mounting Medium (Vector) for nuclear staining. This technique, although highly used, it’s only represented in Figure 22 of the supplementary data.
Statistical analysis
Results are expressed as mean ± standard deviation. Data were analyzed using two-tailed student’s t test and ANOVA. P values of <0,05 were considered statistically significant.
Proliferation Index (PI) used for proliferation analysis and comparison was calculated in FlowJo®. It represents the total number of divisions of the cells that firstly underwent at least on one division,
CHAPTER 2: MATERIALS AND METHODS
48
i.e. it considers only the fraction of responding cells. The formula used
is represented below:
𝑃𝐼 = 𝑛𝑢𝑚𝑏𝑒𝑟 𝑜𝑓 𝑑𝑖𝑣𝑖𝑠𝑖𝑜𝑛𝑠
CHAPTER 3: RESULTS
49
C
HAPTER
3:
R
ESULTS
CD11b+ cells cultured in vitro with tumor microenvironment factors: RNA analysis
Some tumor factors are known that drive CD11b+ cells to arrest their differentiation process and remain in an MDSC “state”. The first step of our project was to characterize the expression of different factors (at the mRNA level) on CD11b+ cells after 72h of stimulation with factors from the tumor microenvironment: VEGF, TGFβ, IFNγ, hypoxia (CoCl2), conditioned media from MDA MB 231 breast cancer
CHAPTER 3: RESULTS
50
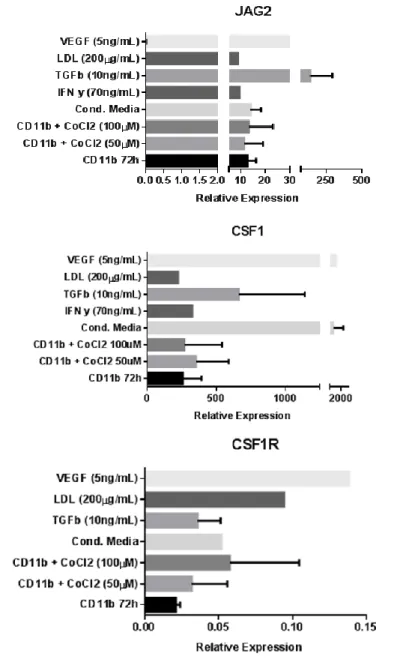
Figure 8.RNA analysis shows a large heterogeneity among donors. Quantitative
real-time (RT-qPCR) for iNOS, ARG1, JAG2, CSF1 and CSF1R in sorted CD11b+ cells cultured in different conditions is inconclusive. Data are arbitrary units normalized to the housekeeping gene 18S. Error bars represent SD, when error bars are absent data represents only one donor. Data shown in this figure represents 4 experiments with one to four donors, with inconsistent results. T student analysis: ns
First, we wanted to characterize the activation state of CD11b+ cells cultured with these different factors. As previously described (Rodriguez et al., 2004), MDSC cells act mainly by upregulating iNOS and ARG1.
CHAPTER 3: RESULTS
51 After RNA extraction, although at the mRNA level there seems to be an increased expression of iNOS in TGFβ, conditioned medium and hypoxia, the same is not true with ARG1 production. Only the increase in TGFβ transcription seemed consistent among both activation markers iNOS and ARG1, although the result is not statistically significant.
Previous work from our lab showed Jagged2, a ligand of the NOTCH pathway, has a role as a marker of CD11b+ cells whose presence induced metastasis in colorectal cancer (Caiado et al., 2013). Furthermore, the NOTCH pathway is also relevant in for cell-cell contact induction of differentiation in myeloid cell-cells (Cheng et al., 2014). Our results suggest an increase in JAG2 expression at the mRNA level after stimulation with TGFβ.
The CSF1-CSF1R axis controls the production, differentiation and function of macrophages, inducing their specific differentiation into M2 like macrophages (Galdiero et al., 2013). Our results show a slightly increase in both ligand and receptor expressions, suggesting that CD11b+ cells may already be differentiated or entering a state of differentiation.
Although the VEGF condition was only successfully achieved with one donor, the result seem to be in accordance with what could be expected: high levels of VEGF induce CSF1/CSF1R expression, similar to what happens in sites of infection. Both TGFβ and conditioned medium suggest an induction of CSF1 expression, but the results are too variable and there is no statistical significance.
Because of the high variation seen at the mRNA level, and without solid results that could be withdrawn from the analysis, we moved to a functional assay, where we tested the same culture conditions on CD11b+ cells, followed by co-culture with CD8+ T cells.
CHAPTER 3: RESULTS
52
CD11b+ cells co-cultured with CD8+ cells induce T cell proliferation
As described in the literature, MDSC can only be identified after a functional T cell suppressive assay. We adapted M. Lechner’s et al. (Lechner et al., 2011) protocol in our experiments.
A co-culture of CD11b+ cells (72h in vitro) with CD8+ cells (freshly isolated or after 72h in vitro) supplemented with αCD3 and IL-2 results in a statistically significant induction of proliferation of CD8+ cells (Figure 9).
Figure 9. CD11b+ cells induce proliferation of CD8+ cells. a) CD11b+ cells were cultured for 72h and CD8+ cells (from the same or different donors) were added in a 1:3 ratio, with αCD3 and IL-2. Proliferation was measured with CFSE staining by flow cytometry and the Proliferation Index obtained with FlowJo®. (n=7; Error bars represent SD, t-student analysis, *p<0.05) b) Representative staining of CD8+ cells with CFSE, after 72h cultured exclusively with IL-2 (black shadow), αCD3 and IL-2 (grey shadow) and αCD3, IL-2 and CD11b+
cells (black line). Each peak represents a cellular division, being the first on the right the parental generation, the 2nd on the right the first generation and so on.
CD8 T cells need IL-2 signals to proliferate but also need αCD3 to bind to its TCR. In this assay, we saw that although IL-2 and αCD3 are enough for CD8 to initiate a cascade of events that leads to cellular
CHAPTER 3: RESULTS
53 proliferation, when cultured with CD11b+ cells, their proliferation rate increased dramatically, as shown in Figure 9 - a). We hypothesize that because APCs, such as dendritic cells and macrophages, have a myeloid origin, our isolated CD11b+ cells could be acting as Antigen Presenting Cells, and inducing CD8 T cell proliferation together with IL-2 and αCD3 (Pozzi et al., 2005). In Figure 9 – b) a representative histogram of one donor is shown: the black curve corresponds to CD8 T cells cultured with IL-2 supplemented medium, resulting in a single generation (parental generation) of cells, which remain alive after 6 days in culture. The grey curve represents 5 generations (5 peaks) of CD8 T cells cultured with IL-2 and αCD3 that bind to the TCR and induce proliferation. The black lined curve represents 6 generations of CD8 T cells that enter proliferation after addition of IL-2, αCD3 and CD11b+ cells. Although these results were not what we had previously hypothesized, we could now test for factors that decrease the effect of CD11b cells in the CD8 T cell proliferation.
CHAPTER 3: RESULTS
54
CD11b+ cells pre-treated with CoCl2 fail to induce proliferation of CD8+ T cells
Because in the usual protocols CD11b+ cells used for MDSC testing are either isolated from cancer patients or previous exposed to cancer cells, we decided to adapt the previous cited protocol to our objectives: the cancer cell lines were replaced by tumoral factors of our interest. Cobalt Chloride (CoCl2) stood out by significantly reducing the
proliferation of CD8+ cells induced by the CD11b+ population (Figure
10).
Figure 10. CD11b+ cells previously treated with CoCl2 (100µM) fail to induce proliferation of CD8+ cells. a) CD11b+ cells were cultured for 72h with CoCl2
(100µM) and CD8+ cells (from the same or different donors) were added in a 1:3 ratio, with αCD3 and IL-2. Proliferation was measured with CFSE staining by flow cytometry, and the Proliferation Index obtained with FlowJo®. (n=7; Error bars represent SD, t-student analysis, *p<0.05, ns=not significantly different) b) Representative staining of CD8+ cells with CFSE, after 72h cultured exclusively with IL-2 (black shadow), αCD3 and IL-2 (grey shadow), αCD3, IL-2 and CD11b+
cells (black line) and αCD3, IL-2 and CD11b+ cells pre-treated with CoCl2 (100µM) (orange line). Each peak represents a
cellular division, being the first on the right the parental generation, the 2nd on the right the first generation and so on.
After being pre-treated with CoCl2, CD11b+ cells seem to fail to
act as APCs towards CD8 T cells. Our initial hypothesis was that CoCl2
was inducing toxicity in the in vitro environment, and less CD11b+ cells were added to the co-culture, diminishing the previous effect. Another
CHAPTER 3: RESULTS
55 reason could be due to the fact that CoCl2 was contaminating the
co-culture and inducing cell death in among CD8+ T cells. These hypotheses were discarded, and are further dissected in the chapter Technical Considerations.
Assuming these results are not artifacts of the experimental setup, we can postulate that CD11b+ cells acting as APCs are now unable to do so: they either entered cell death, with the remaining CD11b+ cells in culture not being able to act as APCs, their MHC1 suffered alterations and is no longer functional, or they dedifferentiated into a less mature phenotype and are not able to act as APCs.
In Figure 10 – a) the proliferation index of CD8 T cells seems to be restored to basal levels of culture upon IL-2 and αCD3 addition, however, solid results from donor to donor are illustrated in Figure 10
– b), where we can see that there is one less generation of CD8 T
cells in the CoCl2 condition.
The values of each donor can be consulted in Figure 19, as well as a dot plot for the CFSE analysis of one donor (representative) in Figure 21, both in the supplementary data.
CHAPTER 3: RESULTS
56
Besides Cobalt Chloride, only when cultured together with MDA MB 231 breast cancer cell line cells did CD11b+ cells fail to induce CD8+ T cell proliferation. Neither TGFβ, LDL, IFNγ, conditioned medium or VEGF reverted their proliferation potential (Figure 11).
Figure 11. Co-culture of CD11b+ cells pre-treated with breast cancer cells or hypoxia showed CD8+ cells inhibition of proliferation. The graphic shows the
normalized values to the condition of the basal proliferation of CD8+ cells with αCD3 and IL-2. Proliferation was measured with CFSE staining by flow cytometry, and the Proliferation Index obtained with FlowJo®. Error bars represent SD. (n=7 for the conditions with CD8+CD11b alone and with CoCl2, n=4 in TGFβ condition, n=3 for
CHAPTER 3: RESULTS
57 Although the TGFβ condition suggested some effects at the mRNA level, in the functional assay it showed no effects.
Another interesting result was the inhibition of proliferation when CD11b+, CD8 and MDA breast cancer cell lines were cultured together.
Several hypothesis can be thought of, from the induction of Tregs, the upregulation of PD1 and CTLA4 (which impairs CTL activity), to a biologic effect of the cancer cells over CD11b+ cells, inducing a MDSC state and consequently a powerful inhibition of CD8 T cells’ proliferation. However, these hypotheses were not tested, and for the following results we assumed this effect was likely to be due to oxygen depletion of the media, since cancer cells have a high proliferation rate.
We then focused in the effects of CoCl2 to the CD11b+ cells in vitro.
CHAPTER 3: RESULTS
58
CoCl2 (100µM) induces a pre-apoptotic state in CD11b+ cells Since CoCl2 exerted such a striking effect on CD11b+ cells,
which affected their capacity to modulate CD8+ T cells proliferation, we decided to check if such dramatic effects could be due to cell toxicity. CD8+ T cells cultured in the presence of 100µM of Cobalt Chloride presented nearly 100% of cell death (Data not shown), whereas CD11b+ cells showed more than 40% of apoptosis (Figure 12).
Figure 12. Cobalt Chloride cultured cells show thereabout more 40% of cells in apoptotic and pre-apoptotic state, and more 20% of dead cells. a) Annexin V
stained cells analysed by flow cytometry show an increasing of 37.6% of cells in early apoptotic and apoptotic states (Annexin + cells, in the blue gate) Data representative of one experiment. b) Flow cytometry analysis of the death fraction (gated on the death parcel in SSC/FFS) show an increase of cell death 24h after the addition of 100µM of CoCl2 in de medium, shows no effect at 48h, and approximately the same increase
after 72h. Data representative of 2 individual experiments with identical results. Error bars represent SD.
a)
b)
CHAPTER 3: RESULTS
59 CoCl2 presents a high toxicity to CD11b+ cells in culture. This
issue was partly overcame as we plated a higher number of cells, counting them a second time upon co-culture. Nonetheless, even though we selected live cells, these could be in a pre-apoptotic state and not fully functional after the toxic shock induce by CoCl2.. This
problem is discussed below, under the Technical Considerations section.
Figure 12 – a) is relative to one experiment only, and shows an
increase in the pre-apoptotic state of CD11b+ cells when exposed to CoCl2, whereas Figure 12 – b) represents two individual experiments,
and shows an increase in the percentage of dead cells obtained through gates in FSC/SSC, over time, with and without CoCl2, after