SUMOL+COMPAL INTERNATIONAL
STRATEGY:
FDI in the African market
Miguel Teixeira-‐Pinto
FALL 2012
A DISSERTATION SUBMITED IN PARTIAL FULFILLMENT OF THE
REQUIREMENTS FOR THE DEGREE OF MSc IN BUSINESS
ADMINISTRATION, AT CATÓLICA LISBON SCHOOL OF BUSINESS AND
ECONOMICS
ABSTRACT
Title: Sumol+Compal International Strategy: FDI in the African Market
Author: Miguel Maria Eugénio de Almeida Teixeira-Pinto
In 2009 Sumol+Compal started its operations as a group after the merger of two companies well known in the Portuguese market for non-alcoholic beverages, Sumol and Compal. Determined in being an international reference in the soft-drink industry, in 2011 the Group was already present more than 60 countries worldwide.
The reduction of consumer's disposable income and contraction of the non-alcoholic drinks industry was a reflect of the economic crisis that world economy was going through. The 2011 domestic turnover of Sumol+Compal suffered a considerable downsizing in that same year while the turnover for international operations increased with special focus on the African Continent, namely in Angola.
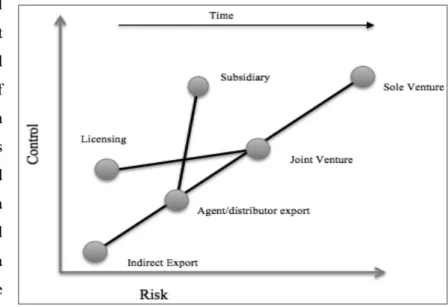
Facing the domestic market situation and the market potential from Africa,
Sumol+Compal managers wanted to go beyond simple exportations and start producing locally in that continent. For that, the international operations department had to present a study on most viable countries to make that investment.
This case is based on a real situation of internationalization process in which
Sumol+Compal had to go in order to seize the opportunity from the African market. The case focuses mainly in the internationalization process as well as in the respective identification of internal strengths, opportunities and other the relevant topics to take the next step.
ACKNOWLEDGEMENTS
In first place I owe much gratitude to my master thesis advisor Nuno Cardeal for his constructive feedback, guidance and support during the last months, which has proven to be essential for the development of this thesis and to my dissertation seminar colleagues Guilherme Sousa, Francisco Cardoso Ribeiro, Francisco Garcia Marques, Elisabeth Grácio, Inês Ferreira and Frederico Marques for their helpful opinions and support during the thesis development.
Secondly I would like to thank to Marta Patrício and Fernando Oliveira for their helpful insight, information sharing and availability. Without them this project would be impossible to develop.
Finally I am very grateful to all my family and friends for their support, assistance and motivation, which helped me to throughout the thesis semester. The final result of this project is in some part thanks to the contribution of family and friends not only at emotional and motivational level but also for their opinions and different perspectives.
Table of Contents
ABSTRACT
... ii
ACKNOWLEDGEMENTS
... iii
LIST OF EXHIBITS
... v
CHAPTERS
1. CASE STUDY ... 1
1.1 Introduction ... 1
1.2 Sumol+Compal ... 2
1.3 Main Brands of the group ... 3
1.4 Sumol+Compal and the Portuguese Market ... 4
1.5 International Presence of Group Sumol+Compal ... 5
1.6 International Strategy and Objectives ... 6
1.7 Interest in Africa ... 7
1.8 Angola ... 9
1.9 Mozambique ... 10
1.10 Conclusion ... 12
Endnotes ... 25
2. TEACHING NOTES ... 28
2.1 Introduction ... 28
2.2 Synopsis ... 28
2.3 Suggested Assignment Questions ... 29
2.4 Teaching Objectives ... 30
2.5 Use of the Case ... 30
2.6 Relevant Theory ... 31
2.7 Analysis and Discussion ... 31
LIST OF EXHIBITS
Exhibit 1 Sumol+Compal Turnover, Domestic VS International Market, 2009-2011
Exhibit 2 Sumol+Compal Brands
Exhibit 3 Sumol+Compal Results, Sales Volume and Cash Flows, 2009-2011 Exhibit 4 Consumer Confidence Index, 2009-2011
Exhibit 5 The Top Ten Economies With Fastest Growth in the World, 2001-2010 Exhibit 6 Africa Population, 2005-2011
Exhibit 7 Africa GDP, 2000 Base, 2003-2011 Exhibit 8 Africa Real GDP Growth Rate, 2003-2011
Exhibit 9 Africa Fertility Rate, Total Births per Woman, 2005-2010 Exhibit 10 Top Sectors in Africa, 2010-2011
Exhibit 11 Main Barriers in Africa, 2010-2011 Exhibit 12 Trade Zones in Africa, 2011 Exhibit 13 SADC Objectives
Exhibit 14 SADC Indicators, 2005-2010 VS Portugal, 2011 Exhibit 15 Angola GDP, Base 2000 and GDP Growth, 2001-2010 Exhibit 16 Angola FDI Inflows and Outflows, 2005-2010
Exhibit 17 Top 5 FDI Investors and Sectors in Angola, 2003-2011 Exhibit 18 Angola Inflation, Consumer Prices, 2001-2013
Exhibit 19 Mozambique GDP, Constant 2000 Prices and GDP Growth, 2001-2010 Exhibit 20 Mozambique FDI Inflows and Outflows, 2005-2010
Exhibit 21 Mozambique Inflation, Consumer Prices, 2001-2010 Exhibit 22 Top 5 FDI Investors and Sectors in Mozambique, 2003-2011
1. CASE STUDY
1.1 Introduction
It was February 2012, when CMVM1 (Comissão do Mercado de Valores Mobiliários)
received a statement giving the account of the constitution of SUMOL+COMPAL Moçambique where the Portuguese group held a stake of 100% on the start-up phase. However it was expected to
sell up to 25% of that company to local partners2.
This important step for the expansionary strategy of the group made part of the plan developed for the possible production in Mozambique and distribution in that and in the remaining
countries making part of the Southern African Development Community (SADC)3
The announcement of the constitution of the new company defined as it main purpose the acquisition of a factory for the production and sale of juices and nectars through brands of the group’s portfolio. The company could still develop agro-industrial activities, importation and exportation of products and brand management.
“This project is an important step in the internationalization process of Sumol+Compal, crucial point in the company’s strategy for coming years, and is part of a broader program of identifying strategic partnerships that can contribute to the consolidation of business in Portugal and growth in international markets” said the group representative for market relations.
However, this was not the first demonstration of interest in investing in Africa through a
FDI4 project. In 2009, Sumol+Compal had signed a memorandum with an Angolan company for the
potential construction of a production facility in that country.
From 2009 to 2011 Sumol+Compal international sales were made throughout exportations and were performing quite well, increasing in value and reaching, in 2011, the maximum of those 3 years. (Exhibit 1)
Under the supervision of the international operations department, the African Continent had
been the main destiny of foreign trade activities. Present in more than 20 countries sales grew by
38,5% in this continent, being Angola the most important market during 20115.
Created in 2009 the international operations department was formed so that there was a responsive structure to develop the kind of investments necessary to achieve a stronger competitive
position in international markets. The department studied Africa for 2 years and in 2011 decided to include and focus on that continent as a segment in the new strategic plan for the coming years.
As the potential of the African continent, its relevance for the group operations and the intention of top managers to expand international activities beyond simple exportations were clear, the international operation departments had to study (i) the most attractive countries to make direct investment, their competitive advantages and relevant relations with the Group as well as (ii) which countries or regions should those plants supply.
For top managers the final configuration was a scale business for which it was necessary to guarantee the presence of market, resources and conditions. And they wanted the international operations team to come with conclusions about these topics to support their expansionary decision.
1.2 Sumol+Compal
By the year 2011 Sumol+Compal was leader in the Portuguese non-alcoholic drinks market6
producing two of the most known Portuguese brands in this industry, representing and distributing some of the most popular and biggest-selling brands of fruit juices, nectars, carbonated soft drinks, sparkling and still water. The group owned brands like Sumol, Compal, Um Bongo, B!, Serra da Estrela and Frize among other. (See exhibit 2)
In 1954 Refrigor came out with a revolutionary product, the first fruit juice soft drink in Portugal. It was the birth of Sumol. The continuous efforts to improve distribution networks, production methods and R&D were in the basis of the growth of the Refrigor Company, later Group
Sumol was created for the brand management, production and distribution of the groupsoft drinks,
waters, beers and juice drinks.
Compal started its activity in the 50’s operating in the concentrated tomato industry. Since its early age, Compal suffered numerous changes on its administration structure, going public and then returning to the private sector in 1993. The company that started with concentrated tomato expanded its operations through the production of fruit juices and nectars. The core business of Compal was expanded internationally and a strong position in Spain was achieved in 2003. In 2005 a consortium
formed by Grupo Sumol and Caixa Geral de Depósitos acquired Compal S.A.7
Sumol+Compal resulted from a merger process started at the end of 2005 and finished by 2009. In 2011 the group had a market share one and a half times greater than that of its nearest competitor in the non-alcoholic beverages sector in Portugal. The group determined its guidelines by reconciling the business strategy of its predecessors and their history of over 50 years of successes. A
vision based on the fact that fruits, vegetables and water are an essential source of pleasure was assumed as a mainstay for the mission of being an international reference company in the market of fruit drinks, to play the lead in high rotation beverage market in Portugal and maintaining the leading position in the markets for prepared vegetables and tomato-based products.
Sumol+Compal was the only company of the food and beverages sector listed on the NYSE Euronext Lisbon. By 2011 the group employed roughly 1400 people, a portfolio of almost 50000
direct customers over the Horeca8, Cash&Carry and retailers and four plants located in Portugal
(Almeirim, Pombal, Gouveia and Vila Flor)9.
1.3 Main Brands of the group
From 2009 to 2011 Sumol+Compal evidenced its commitment to go abroad and that determination and intentions were changing the way the group managed its own brands. Always in pursuit of excellence, the group managing and innovation efforts headed to a more ample framework that guided for new objectives and intervention activities.
The 2011 results and sales volumes highlight the importance and urgency of that change (see Exhibit 3). Taking together the brands of most importance, Compal and Sumol, total 2011 sales
accounted for 211 million litres of which 52% were made in international markets10.
Although Compal and Sumol brands represented the most important ones from the portfolio,
the group business units could be segmented into 3 categories11:
• Nutrition • Soft Drinks • Waters and beers
A wide range of products, result of constant efforts on R&D and innovation, was well known among Portuguese consumers who favoured nutrition products available in a variety of packs and flavours under the brand names of Compal and Um Bongo. Extending from canned vegetables and tomato derivate to nectar juices Sumol+Compal kept up with the trend of consumer’s preference for healthy products. Compal Essencial was developed to meet the needs of the modern consumer who
valued the nutrition equivalence to a piece of fruit in a pack of practical dimensions for daily carry12.
Furthermore, Compal was constantly looking for new flavours and new fruits to expand the portfolio to launch seasonal or permanent new options. The experience and knowledge from the pre-merger Compal was kept in the Group so consumers maintained their trust and kept familiarized with the tradition of these brands translated in quality and innovation.
The soft drinks segment success was in identifying opportunities for the development of brands, to keep with the quality that customers were used to, and to enter into new market segments. The group most known brand, Sumol, made part of this segment and the constant monitoring of consumer needs and trends turned it into a national and international reference in the fruit juice beverages. In this segment were included brands like 7up and Pepsi for which Sumol+Compal had a production, sale and distribution contract for Portugal, and other brands created and adapted by the Group in order to meet the needs from different niches and segments. Example of that concern about the consumer was the GUD brand. Developed specially for the markets from Austral Africa, this product was a source of vitamins very important in growing children.
The waters and beer segment consisted mainly of Água Serra da Estrela (spring water), Frize (a carbonated mineral water) and Tagus (beer).
1.4 Sumol+Compal and the Portuguese Market
About 25 companies formed the Portuguese market for non-alcoholic soft drinks, which included the nutrition and soft drink segments from Sumol+Compal business units. As Portugal was inserted in the E.U. the soft drinks industry was legally regulated by European and national alimentary rules that guarantee the use of the most demanding and technical processes on safe
reception of raw materials, preparation of drinks, bottling, storage and distribution13. Additionally
ASAE14 was in charge of a regular inspection on the quality and safety of raw materials and products
over the entire process of production and distribution. With both national and international players producing and distributing in Portugal this sector represented over 5% of the agro-food industry turnover.
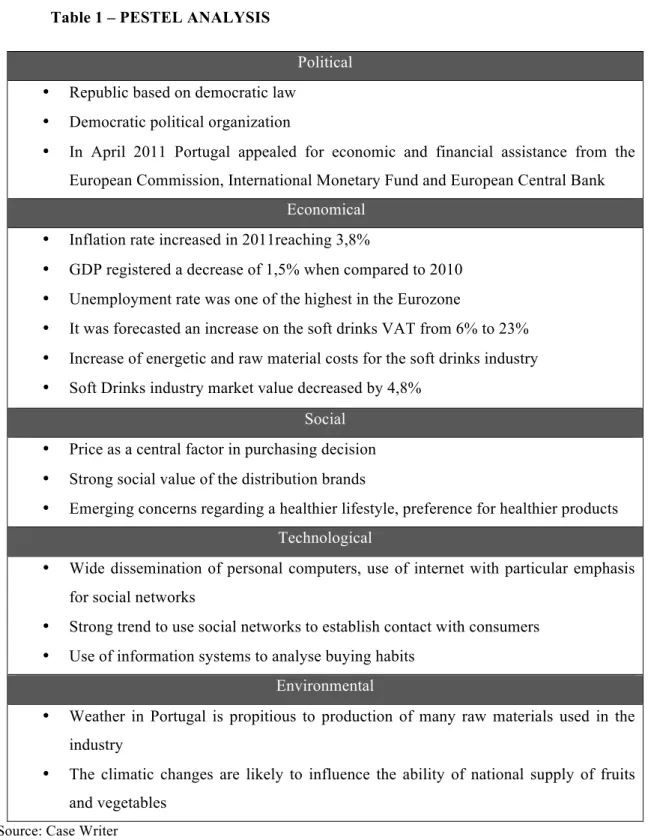
Portugal was under an economic crisis and the economic situation of the country was being felt in the most diverse areas of the industry and during 2011 European Commission, European Central Bank and International Monetary Fund negotiated the terms of a bailout plan for Portugal, defining a set of measures that government would have to meet. The Portuguese GDP decreased by
1,5% and inflation rate was at 3,8%15. In 2011 Portugal was one of the Eurozone members with the
highest unemployment rate at 13,6%16 . The recession had its consequences in almost every
industries and Sumol+Compal was not free of the downturn effects. From 2010 to 2011 the non-alcoholic drinks sector saw its market value back down to 890 million euros, a downsizing of 4,8%
comparatively to 201017.
A substantial drop marked 2011 in the confidence among economic agents. Paralleling the previous year (see exhibit 4) it was clearly evident the early adoption of an adjustment on the
and their manifested preference for distribution brands with more attractive prices. Furthermore, the Soft Drinks and Nutrition sectors were highly dependent on international trade of raw materials and
subject to tremendous pressure from distribution companies 19. From 2010 to 2011 energetic costs
increased along with the increase in the costs of raw materials20 and for 2012 it was expected an
increase on soft drinks VAT from the current 6% to 23%21 .The situation of the Portuguese economy
and the state of the industry took its toll on the Group’s operations. In fact a 10,5% decrease in the 2011 domestic turnover for Sumol+Compal was registered.
The observed depressed macroeconomic environment emphasized the tough trading conditions that affected Sumol+Compal sales in the Portuguese market. Sumol+Compal suffered a loss of 0,4 p.p. in market share. However the leadership in the non-alcoholic beverages segment was maintained with a share of 25%. In-home consumption share dropped from 22,5% to 21% due to the
on going behaviour of private labels while out-of-home consumption achieved a share of 27,5%22.
1.5 International Presence of Group Sumol+Compal
The International Markets represented a business area with great relevance for the Group. Sumol+Compal foreign trade activities covered more than 60 countries over 4 continents through exportations. During 2011 the business structure for international markets was fortified over the establishment of three new employees in target markets. Two elements were placed in Angola and one local collaborator was hired in China. Also the exportation destinations were amplified from 63 to 69 countries.
“In our core brands over 40% of the volume of Sumol and Compal are performed outside Portugal. I would even say that today we sell more Sumol outside Portugal. In the foreign market
strategy is to continue to grow by broadening the geographical base destination of our products”23
Duarte Pinto, Sumol+Compal CEO, highlighted the importance of the foreign markets and the intention of the Group to strengthen its international strategy and reinforce its worldwide presence.
At a growth rate of 30% Sumol+Compal achieved the historic maximum of 80,0million euros sales in international markets in 2011, representing 24,1% of total sales (see Exhibit 1). The most representative brands in foreign markets were Sumol and Compal that observed sales increase
of 57.0% and 19,5%, respectively in the period 24.
Exportations to the rest of Europe increased by 15,9%25 with special focus on the northern
of the different brands and products in the Group’s portfolio. In America and Asia sales performed positively with exception of Caribbean and Canada where sales contracted. In markets considered culturally distant the Group had always made efforts to build good relationships, especially through commercial flexibility and to learn with local partners and collaborators the best way to penetrate the market. The great variety of products produced in Portugal gave opportunity to serve different and distant markets and through the wide variety of quality products to serve each different type of local or regional consumers.
Facing the economic environment and internal signs of a higher degradation of demand the
internationalization strategy of Sumol+Compal was focusing efforts in the Africancontinent. Africa
was the main exportation destination registering a growth in sales of 38,5%26 in 2011. In this
continent some brands of the group were perfectly consolidated. In Angola, Mozambique and Cape Verde the Group’s position was supported by strong marketing campaigns. The consumers were used to the quality and innovation of Sumol+Compal products that made them their favourites, somehow there was a tradition and a strong relation between the Group and the consumers based on long lasting presence in some countries and the fact of being a Portuguese company induced trust.
1.6 International Strategy and Objectives
The domestic operations were in decline while the foreign trade activities were performing quite well and getting more relevant for the whole operation. The recession felt in Portugal was day by day emphasizing the opportunities coming from external markets.
Sumol+Compal stated as part of their mission “to be an international reference company
within the fruit beverages”, in fact they were already present in 69 countries. Nevertheless top
managers wanted to maximize competiveness of domestic and international activities and to explore the potential of international markets through local production.
By exporting to a variety of countries which differed in terms of culture, preferences, demographics, economic and political stability and other topics, Sumol+Compal was learning and acquiring knowledge on those different dimensions, was creating commercial relations that could later be very practical and helpful. The foreign trade activities, exportations, permitted a more detailed and accurate inventory of opportunities that the International Operations Department could then study and allocate resources to find out if in fact there was potential for local production in order to achieve greater sales volumes for the country or region in question.
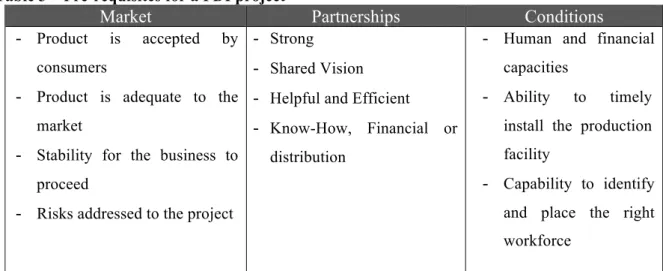
During the study phase the Group would determine, before going ahead with the implementation of a major direct investment, if in fact the products were being well accepted, if there
was no need for further product adaptation, if the target market was stable enough to penetrate it with a long-term investment, basically it was to recognize the presence of a market.
The Group also valued strong partnerships with local agents. Those partnerships should be very useful when collecting information about distant and different markets, should share the same vision and be strategically relevant in terms of know-how, distribution or even financial purposes. The use of partnerships exploited the experience that local agents already had on those markets, and made it easier for the Group to learn how to operate there.
Nevertheless the Group should be able to seize the opportunity of those markets, the Group should have own conditions to do so. To be capable of identify and timely place the qualified human resources and capital to implement the project.
In early 2011, the International Operations Department had already two projects on an advanced phase, Angola and Mozambique had already been studied and their potential had been identified. These were the countries that presented most potential for the successful implementation of the expansionary strategy and to develop a local production project.
1.7 Interest in Africa
The African continent has been recognised, since the 90’s to be on an upward trail economically, socially and politically. The long-term process of reforms at economic and regulatory level that took place across much of the continent underpropped this continent growth path. From the year 2000 the business environment improved, the infrastructure investments increased and commodities in Africa experienced a boom. From 2001 to 2010 six out of ten of the fastest growing economies in the world were in Africa (See Exhibit 5). The African population ascended to 1 billion (See Exhibit 6), GDP in 2011 was 967 361 US$ million (See Exhibit 7) with an average growth rate in of 5,2% between 2003 and 2011 (See Exhibit 8). Africa represented a source of natural resources and raw materials abundance. Regarding human capital, even if with low level of education it had an increasing working age population. Furthermore, a great part of African countries had strong trade links with European countries and the north of Africa proximity to Europe made it easier to access the market.
The African community was becoming wealthier. The growing middle class had more spending power, communications and telecommunications evolved giving place for a new consumer
market27. With an average age on the 19,7 years28 old this continent had high fertility rates (See
Exhibit 9) and life expectancy at birth increased to 57 years old. The tendency for consumption was high. While in Europe a great part of the household income was destined to themes like healthcare or
habitation, in Africa those concerns were not real, so the demand for consumer good was high29. Additionally the risks addressed to investments made in that continent did not allow for industry saturation giving occasion to higher growth margins and emerging markets opportunities. The consumer goods sector was listed on the top 5 sectors with greatest potential (See Exhibit 10).
Despite the great evolution in communications, transports and logistics there were a great number of investors who were not attracted to Africa, arguing as main barrier for investment in Africa the unstable political environment (See Exhibit 11). Moreover, a great part of countries from Southern Africa were not so attractive in terms of corruption and regulatory environment.
Five different trade zones could be found in Africa (See Exhibit 12) with stated goals for the creation of free trade areas or custom unions. These blocks had been formed as a strategy of self-defence and economic development, regional integration was a vehicle for political stability and economic sustainability. Neighbouring states were more cooperative in trade and projects. Sumol+Compal had special interest for the SADC. That region represented a great potential for Sumol+Compal, the union objectives (See Exhibit 13) were supportive for the group’s intentions for Africa, to serve that market. The clear signs of evolution and economic growth of those countries forming the SADC caught the Group’s attention (See Exhibit 14). The SADC trade protocol established as its highest objective the liberalization of intra-regional trade of goods and services. The establishment of a free-trade area was meant to remove the trade barriers and implement a zero tariff for goods produced in that region. Technical standards and norms of commerce were also introduced in order to safeguard and maintain available to consumer competitive goods in terms of quality. Customs rules and procedures were coordinated in order to ease and simplify the transition of goods between countries. However, the increased spending power of the African people was not
uniform and there still was a considerable part of the population living with US$1 a day30.
The extremely low income per capita acted as a barrier for the imported products namely for Sumol+Compal products. Through exportation, consumers were subject to products at twice the price charged in Portugal. The curious thing is that even so they were willing to pay. Mainly because, in general, local supply was limited and with poor quality, so European products were seen as guaranteed quality products. With a strong presence of Brazilian and Chinese companies of soft drinks, in Africa there were also companies like Coke, Don Simon from Spain and Parmalat, which were at the same competitive level of Sumol+Compal products.
Already with operations in most part of those countries, the international operations team believed that great volumes would be possible through local production.
1.8 Angola
After independence in 1975, Angola faced a civil war that lasted several decades until 2002. The
country located in the western coast of Africa occupied an area of 1,246,700 km2 was rich in natural
resources and had extensive oil reserves. With a population characterized by the different African ethnicities that formed it, most part of the population followed the Christian Church. Portuguese was the official language, still there was a lot of local dialects and African languages spoken in the
country. Angolan civil legal system was based on the Portuguese law31. Between 2003 and 2011
Angola was one of the main destinations for Foreign Direct Investment in Africa, those values increased until 2009 and then in 2010 the financial crisis forced a downturn of those values (See Exhibit 16). Kwanza is the official currency, however the dollar is commonly accepted. Oil reserves and mineral resources were the primary focus of attraction. The observed growing middle class and increased private consumption also represented an opportunity to investors looking for new markets
such as real estate, construction and communications32
Between 2001 and 2011 the Angola economy was among the fastest growing economies in the world with a growing rate of 11.3%, (See Exhibit 15) ahead of economies like China. Angola FDI inflows registered a contraction after 2008 (See Exhibit 16), mainly because of the economic crisis affecting the main investors. During that same period Portugal was the country that most invested in Direct Investment projects (See Exhibit 17), in return, the Angolan investment in Portugal increased by 100% between 2007 and 2011 highlighting the close relations between both countries. Included in different free trade areas Angola represented a gateway for those markets. Bank activity in Angola evolved and increased, Portuguese banks were strongly represented and that was a positive factor for the Portuguese investors. Regarding transportation and infrastructures, Angola went through a restructuring of roads and rails that linked the most important cities, smaller airports in provincial areas were under construction and the conclusion of the new Luanda Airport was planned for 2012. The Luanda harbour was constantly congested and cargo ships took a lot of time to unload containers, as they needed to wait patiently and with additional costs for an empty dock.
Investing in African countries required a tremendous ability to adapt and react to the context, it was critical for success an efficient and rigorous implementation of the financial, legal, communication and human resources models. The perceived image from doing business in Angola was that everything was expensive, time consuming, difficult to do and that corruption was still latent
and Angola ranked in 163 on the “Doing Business 2011”33 and had an index of 2 for the corruption
perception while Portugal had 6,134. Human resources were expensive and scarce so companies were
forced to think about creative and flexible solutions for the placement of qualified and professional staff. However the existence of protocols between Portugal and Angola regarding the issuance of
short duration visas facilitated the business start-up. Goodwill, trust, language and strong historical ties helped to establish partnerships together with the help of consultancy agencies specialized in finding the best partnership. Even if only for oil related activities it was legally mandatory to establish a partnership, it was of major interest to foreign companies creating them.
There was also the issue of bureaucracy, which was reflected in a difficult interpretation of the law and its application to projects, the judicial system weighed heavily on the difficulties of the business. Investment projects in Angola were also very demanding in terms of resources and patient.
Since the end of the armed conflict, Angola had undergone several reforms and legislative changes. Backed attractiveness’ increase the political stability, contraction of inflation (See Exhibit 18), several customs tariffs change and the introduction of priority sectors that would benefit from investment incentives. Incentives were made in the sense that Angola was intended to be a key country in the African context and privileged partner with Europe, Asia and America taking advantage of its great economic potential.
Competing against Coca-Cola, Red Bull, Schweppes and Refriango and several local brands, Sumol+Compal held in Angola the most important market in Africa, with very young consumers. It was the main exportations destination and where the Group most invested in communication and marketing efforts. Refriango, an Angolan company, and Coke were the most threatening competitors producing locally, although smaller producers had products with a certain quality.
1.9 Mozambique
This former Portuguese colony occupied an area of 799,380 km2 in the southern and eastern
coast of Africa, with an estimated population of 23.4 million people mainly composed by African ethnicities, only 23% of the population lived in cities. Although the official language was the Portuguese, and in fact it was the most spoken language in the main cities, for most population the mother tongue was an African language. Catholic and Protestant religions were the ones with the
strongest presence in Mozambique35. The Mozambican legal system was a mix of the Portuguese
civil law, Islamic law and customary law. Although the official currency is the Metical, the US dollar, the South African Rand, the Euros are also usually accepted and used in business transactions.
Since 1975 Mozambique was independent from Portugal, but suffered through 16 years of civil war. Even though, it was considered one of the economically better performing countries of Sub-Saharan Africa and made significantly progress towards political and economical stability. Investments made in mineral resources, industry, services and the support from other countries allowed for an average annual economic growth rate of 7,8% between 2001 and 2011 (See Exhibit
19). The development of infrastructures allied with the diversity of resources available in Mozambique were seen as the main drivers to bring changes to Mozambique’s economic outlook. Also the modernization of public administration, reforms and legislative updates created an attractive institutional and legal environment for investors.
The Mozambican non-alcoholic drinks segment was included in the food and beverage sector, which was one of the most important to support an economic sustained growth. Campaigns conducted by the local government encouraged the internal production with greater confidence and pride. The Food and Beverage sector in Mozambique was focus of attraction for Foreign Direct Investments (See Exhibit 22)
The increased interest of foreign investors was latent (See Exhibit 20) and local government conducted a set of measures regarding foreign investments incentives. Private investment would benefit from the right to import capital, export profits and re-export invested capital. Government additionally introduced tax and custom incentives under to which all individuals and companies
properly investing, would benefit from reductions/exemptions to the taxes they would be subject to36.
As part of those benefits the Mozambican State included deductions from taxable income, tax credit
for investment, exemption and reduction in tax rates or their deferral and accelerated amortization. Exposure to international prices of cereals, oil and others products was the main reason of the inflation rate fluctuation (See Exhibit 21).
The hiring system in Mozambique was also under specific law that only allowed foreign workers to be hired when there would be no national citizens qualified for the job or if there was no sufficient work force available. The distinction between small, medium and large companies was important in the scheme of hiring quotas. The number of foreign workers to be hired was related to the size of the company. Compared with Angola, in this country it was easier to access more qualified workforce and to place qualified staff there under expatriation. There was a greater balance between the demand and supply of labour force.
Mozambique bordered with countries of great interest to the Sumol+Compal Group and was rich in raw materials such as pineapple, mango and passion fruit that could later be imported to Portugal. Represented an entry point to the SADC market with 250 million consumers potential. The continued and sustained economic growth of Mozambique was very demanding in terms of infrastructure development. Airports, roads, railways presented lots of deficiencies and somehow were considered as constraints for the economic agents trying to exploit the Mozambican market potential. However investments were being made in order to create better infrastructure conditions, projects for the construction of new airports and modernization of Maputo International Airport. Maputo harbour was the second largest of the oriental coast of Africa, was the most important from the 3 harbours in
Mozambique and was directly connected via railways with the neighboured countries. The increased flows registered in that port made necessary the investment to increase the cargo handling capacity.
In addition, products were free of taxes when exported to other SADC members. The legal framework was more stable and more opened, the process for the constitution of a company was relatively easy, fast and at reasonable costs. The reforms made the legal system and tax regime similar to the Portuguese and the Portuguese banks were strongly represented in the Mozambican financial sector.
Although there was a clear evolution fostering the foreign investment, companies were advised to avoid courts, justice in Mozambique was lengthy and there was absence of private ownership of land. Concessions should be made, and the process was often unclear and prolonged.
The competition in Mozambique was felt mostly by South African companies exporting to that country. Regarding big corporations producing in Mozambique only Santal (Parmalat Group) was
present. The rest of competition consisted mostly of small local producers
.
1.10 Conclusion
The international operations department team had now several decisions and results to present. Top managers were looking for an answer regarding the destination of the Group’s investments abroad. Two countries were already on an advanced phase of the project development. Although, during the opportunity inventory formulation, the team realized the huge dimension of the African market, still their major concern was if any of the countries previously studied had the necessary conditions, if the established partnerships were enough and the right ones and if in fact markets would allow for a sustainable growth of the Group.
Given the potential of the SADC market as a region and the market for Angola and Mozambique, the team was also expected to answer to the following questions:
• Given the potential of the African region, would there be place and opportunity for more than one independent FDI project?
• What would be the strategy and the countries to supply with more than one plant?
The objective was to start African production by early 2013, so the information and decisions from the International Operations team would be conclusive. Even if the team was accustomed to take decisions on foreign activities and top managers had total trust on them, this was a huge step.
It was also a matter of timing and seizing the opportunity as it was at the time of the constitution of Sumol+Compal Mozambique or the signed memorandum with the Angolan company. It was now time to move to the implementation stage.
Exhibit 1 – Sumol+Compal Turnover, Domestic VS International Market, 2009-2011
Exhibit 2 – Sumol+Compal Brands
Source: Sumol+Compal Information
2009
2010
2011
Domestic Market
273,1
281,1
251,5
Foreign Market
53,9
61,6
80,0
Total (M€)
327,0
342,7
331,5
Source: Sumol+Compal Information
83,50 % 16,50 %
2009
82,00 % 18,00 %2010
75,90 % 24,10 %2011
Exhibit 3 – Sumol+Compal Results, Sales Volume and Cash Flows, 2009-2011
2009
2010
2011
Results (in million €)
Absolute gross margin
175,9
192,2
178,0
Operating profit
17,5
32,0
27,8
Consolidated net profit
-5,9
9,4
6,2
Cash Flow (in million €)
EBITDA
36,4
50,1
46,1
Cash flow from operating
activities
42,5
47,9
57,0
Cash flow from investing
activities
-5,9
-12,6
-14,3
Free Cash Flow
36,5
35,3
42,8
Sales Volume (in millions of litres)
Sales Volume
424,5
443,0
430,9
Products
384,1
396,7
398,5
Carbonated soft drinks and Iced
Tea
172,7
187,0
195,9
Juices, Nectars and Fruit Still
Softdrinks
132,6
129,9
129,8
Waters
52,9
54,2
50,4
Beers
5,4
4,9
4,1
Other
20,5
20,7
18,4
Services Provided
40,4
46,3
32,4
Source: Sumol+Compal information
Exhibit 4 – Consumer Confidence Index, 2009-2011
Consumer Confidence Index37
Q3/2009 Q1/2010
Q3/2010 Q4/2011
World Average
86
92
90
94
Portugal
53
51
44
36
Exhibit 5 – The Top Ten Economies With Fastest Growth in the World, 2001-2010
(Average annual GDP growth)
Exhibit 6 – Africa Population, 2005-2011
Source: United Nations Development Program, 2012.
Exhibit 7 – Africa GDP, 2000 Base, 2003-2011
Source: World Bank 2012, Africa Development Indicators 2003-2011.
2005 2006 2007 2008 2009 2010 2011 Population in Millions 909,705 930,96 952,67 974,49 997,49 1 020,65 1 044,30 800 900 1000 1100
Population, total (in Millions)
Country
2001-10
Angola
11,3%
China
10,5%
Myanmar
10,3%
Nigeria
8,9%
Ethiopia
8,4%
Kazakhstan
8,2%
Chad
7,9%
Mozambique
7,9%
Cambodia
7,7%
Rwanda
7,6%
Source: Ernst & Young, 2012. África attractiveness survey 201138
2003 2004 2005 2006 2007 2008 2009 2010 2011 GDP (in Millions) 660 337,0 696 649,0 735 761,0 780 101,0 827 251,0 869 622,0 893 935,0 935 730,0 967 361,0 0,0 200 000,0 400 000,0 600 000,0 800 000,0 1000 000,0 1200 000,0
Africa GDP, 2000 base, 2003-2011
Exhibit 8 – Africa Real GDP Growth Rate, 2003-‐2011
Source: World Bank 2012, Africa Development Indicators 2003-2011
Exhibit 9 – Africa Fertility Rate, Total Births per Woman, 2005-‐2010
Source: World Bank, 2012. African Development Indicators 2005-2010
2003 2004 2005 2006 2007 2008 2009 2010 2011 African real GDP growth rate (in
%) 5,2% 6,1% 5,8% 6,2% 6,5% 5,6% 3,1% 5,0% 3,4% 0,0% 1,0% 2,0% 3,0% 4,0% 5,0% 6,0% 7,0%
African real GDP growth rate (in %)
2005 2006 2007 2008 2009 2010 World 3 3 3 2 2 3 Africa 5 5 5 5 4 4 Angola 6 6 6 6 6 5 Mozambique 5 5 5 5 5 5 0 1 2 3 4 5 6 7
Exhibit 10 – Top Sectors in Africa, 2010-2011
Source: Ernst & Young, 2012. Africa Attractiveness Survey, 2011
Exhibit 11 – Main Barriers in Africa, 2010-2011
Source: Ernst & Young, 2012. Africa Attractiveness Survey, 2011
0% 5% 10% 15% 20% 25% 30% 35% 40% 45% Unstable political environment
We are a local organization Corruption Weak Security Poor transport and logistics infrastructure Inefficient admistrative/regulatory Customers are inaccessible Poor telecomunication infrastructure Poor access to highly skilled labor Lack of entrepreneurial culture Poor utilities and energy security Complex language, culture and values Inefficient tax regime and customs Poor price/quality ratio of labor Low quality of life
0% 5% 10% 15% 20% 25% 30% 35% 40% 45% 50% Mining and metals
Oil and gas Exploitation of natural resources Hotels and toursim Consumer products Construction Telecomunications Financial Services Energy Transportation Industrial and commercial machinery Infrastructure development Electronic and electrical equipment Automotive Alterntive energy Business Service Retail IT services
Exhibit 12 – Trade Zones in Africa, 2011
Arab Maghreb Union – Algheria, Lybia,
Mauritanua, Morocco and Tunisia
Economic Community of West African States – Benin, Burkina Faso, Cape Verde,
Ivory Coast, Gambia, Ghana, Guinea, Guinea-Bisau,Liberia, Mali, Niger, Nigeria, Senegal, Sierra Leone, Togo
Economic Community of Central African States – Cameroon, Central African Republic,
Chad, Republic of Congo, Equatorial Guinea, Gabon
East African Community – Kenya, Uganda,
Burundi, Rwanda, Tanzania
Southern African Development Community
– Angola, Botswana, D.R.Congo, Lesotho, Malawi, Mauritius, Mozambique, Namibia, Swaziland, Tanzania, Zambia, South Africa, Seychelles
Source: Ernst & Young, 2012. Africa Attractiveness Survey, 2011
Exhibit 13 – SADC Objectives
Source: Southern African Development Community 2011
• Achieve development and economic growth, alleviate poverty, support the socially disadvantaged through regional integration;
• Stimulate trade in goods and services among member countries • Evolve common political values, systems and institutions • Promote and defend peace and security
• Promote self-sustaining development and the interdependence of Member States; • Achieve complementarity between national and regional strategies and programs;
• Promote and maximize productive employment and utilization of resources of the Region; • Achieve sustainable utilization of natural resources and effective protection of the
environment; Strengthen and consolidate the long-standing historical, social and cultural affinities and links among the people of the Region.
Exhibit 14 – SADC Indicators, 2005-2010 VS Portugal, 2011
Source: United Nations Development Program, 2012. International Human Development Indicators Doing Business, 2012. Ease of Doing Business Report, 2005;2011
Population, in Millions 2005 | 2010 GDP, constant year 2000 US$ in millions 2005 | 2010 GDP Growth Annual % 2005|2010 GDP/Capita, constant year 2000 US$ 2005 | 2010 Inflation, consumer prices Annual % 2005 | 2010 Life expectancy at birth, total in years 2005 | 2010 Human Development Index 2005 | 2010 Ease of Doing Business (rank) 2006 | 2010 Angola 16,489| 19,081 14 644| 26 126 18 | 3 888 | 1 369 23 | 14,5 48,6 | 50,7 0,445 | 0,482 135 | 169 South Africa 47,198| 49,991 160 367| 187 640 5 | 3 3 398 | 3 753 3 | 4 51,1 | 52,2 0,599 | 0,615 28 | 34 Botswana 1,876 | 2,007 7 277 | 8 408 2 | 7 3 880 | 4 190 9 | 7 50,6 | 53,3 0,601 | 0,631 40 | 45 D.R.Congo 57,420 | 65,966 5 303 | 6 691 8 | 7 92 | 106 21 | N.A. 47 | 48,1 0,260 | 0.282 155 | 182 Lesotho 2,066 | 2,172 860 | 1 076 3 | 6 417 | 496 3 | 4 44,3 | 47,6 0,417 | 0.446 97 | 130 Malawi 12,822 | 14,901 1 924 | 2 758 3 | 7 150 | 185 15 | 7 49 | 53,5 0,351 | 0,395 96 | 132 Mauritius 1,243 | 1,281 5 326 | 6 636 1 | 4 4 284 | 5 181 5| 3 72,5 | 73,2 0,703 | 0,726 23 | 17 Mozambique 20,770 | 23,391 6 483 | 8 972 10 | 7 312 | 384 7,2 | 12,7 48,1 | 49,8 0,285 | 0,317 110 | 135 Namibia 2,080 | 2,283 4 972 | 6 155 3 | 7 2 391 | 2 696 2 | 4 58,7 | 62,2 0,593 | 0,622 33 | 66 Seychelles 0,0829 | 0,0865 598 | 760 7 | 7 7 209| 8 788 1 | -2 72,6 | 73,4 0,766 | 0,771 N.A | 111 Swaziland 1,017 | 1,056 1 691 | 1 911 2 | 2 1 663 | 1 811 5 | 5 45,9 | 48,4 0,493 | 0,520 N.A | 115 Tanzania 38,831 | 44,841 14 317 | 19 965 7 | 7 369 | 445 5 | 6 53,4 | 57,4 0,420 | 0,461 140 | 131 Zambia 11,462 | 12,926 4 093 | 5 587 5 | 8 357 | 432 18 | 9 44,4 | 48,5 0,394 | 0,425 67 | 90 Zimbabwe 12,571 | 12,572 4557 | 4032 -6 | 9 363 | 321 302 | N.A. 44.0 | 50 0,347 | 0,364 126 | 159 SADC (2010) 252,554 - 6 - 6,1 - - - Portugal (2011) 10,367 122 952 -2 11 559 4 80 0,795 31
Exhibit 15 – Angola GDP Base 2000, and GDP Growth, 2001-2010
Exhibit 16 – Angola FDI Inflows and Outflows, 2005-2010
Source: UNTCD, 2012. Foreign Direct Investment in LCD’s, 2001-2010
2001 2002 2003 2004 2005 2006 2007 2008 2009 2010 Angolan GDP growth (%) 3,1 14,5 3,3 11,2 18,3 20,7 22,6 13,8 2,4 3,4 0 5 10 15 20 25 2005 2006 2007 2008 2009 2010 FDI Inflows (Million $) 6 794,0 9 064,0 9 795,0 16 581,0 13 100,0 7 873,0
0,0 5 000,0 10 000,0 15 000,0 20 000,0
Source: World Bank, 2012. African Development Indicators, 2005-2010
2005 2006 2007 2008 2009 2010 FDI outElows (million
$) 221,0 194,0 912,0 2 570,0 8,0 1 163,0 0,0 500,0 1 000,0 1 500,0 2 000,0 2 500,0 3 000,0 2001 2002 2003 2004 2005 2006 2007 2008 2009 2010 GDP, Base 2000 (Million US$) 9 416,0 10 780,0 11 137,0 12 382,0 14 643,0 17 680,0 24 669,0 21 674,0 25 264,0 26 125,0
0,0 5 000,0 10 000,0 15 000,0 20 000,0 25 000,0 30 000,0
Exhibit 17 – Top 5 FDI Investors and Sectors in Angola, 2003-2011
Source: Ernst & Young 2012. Study on the activity in Africa “Construindo Pontes” 2012
Exhibit 18 – Angola Inflation Consumer Prices, Annual %, 2001-2013
Source: United Nations Development Program, 2012. International Human Development Indicators
Top 5 countries in new
FDI projects (2003-2011) Top 5 countries for investors in new FDI projects, by job creation (2003-2011)
Top 5 sectors of new FDI
projects (2002-2011) % on the sector’s contribution to the total of the projects
Portugal United States of America Financial Services 42,6% United States of America Portugal Coal, petroleum and natural gas 8,9%
United Kingdom Germany Beverages 6,0%
Spain China Business Services 6,0%
South Africa United Kingdom Transports 5,0%
2001 2002 2003 2004 2005 2006 2007 2008 2009 2010 2011 2012(e) 2013(e) Angola Inflation, consumer prices (annual
%) 152,6 108,9 98,2 43,5 23 13,3 12,2 12,5 13,7 14,5 13,5 10 9,4 0 20 40 60 80 100 120 140 160 180
Exhibit 19 – Mozambique GDP, Constant 2000 Prices and GDP Growth, 2001-2010
Source: World Bank, 2012. Africa Development Indicators, 2001;2010
Exhibit 20 – Mozambique FDI Inflows and Outflows, 2005-2010
2001 2002 2003 2004 2005 2006 2007 2008 2009 2010 Mozambique GDP constant 2000 prices (in
Million US$) 4 754,0 5 173,0 5 485,0 5 917,0 6 483,0 6 893,0 7 395,0 7 900,0 8 401,0 8 972,0 0,0 1 000,0 2 000,0 3 000,0 4 000,0 5 000,0 6 000,0 7 000,0 8 000,0 9 000,0 10 000,0 2001 2002 2003 2004 2005 2006 2007 2008 2009 2010 Mozambique GDP Growth (annual %) 11,9 8,8 6 7,9 9,6 6,3 7,3 6,8 6,3 6,8 0 2 4 6 8 10 12 14
Source: UNTCD, 2012. Foreign Direct Investment in LCD’s, 2001-2010
2005 2006 2007 2008 2009 2010 FDI inElows (Million US
$) 108 154 427 592 893 789 0 200 400 600 800 1000 2005 2006 2007 2008 2009 2010 FDI outElows (Million
US$) 0 0 0 0 3 1 0 0,5 1 1,5 2 2,5 3 3,5
Exhibit 21 – Mozambique Inflation, Consumer Prices 2001-2010
Source: World Bank, 2012. Africa Development Indicators, 2001-2010
Exhibit 22 – Top 5 FDI Investors and Sectors in Mozambique, 2003-2011
Source: Ernst & Young 2012. Study on the activity in Africa “Construindo Pontes” 2012
Top 5 countries in new FDI projects (2003-‐ 2011)
Top 5 countries for investors in new FDI projects, by job creation (2003-‐2011)
Top 5 sectors of new FDI projects (2002-‐ 2011)
% on the sector’s contribution to the total of the projects
South Africa Portugal Coal, petroleum and natural
gas 22,9%
Portugal India Food and beverage and
tobacco 11,5% United Kingdom United States of America Metal Industry 11,5% India South Africa Construction 6,3% Brasil United Kingdom Financial Services 6,3%
2001 2002 2003 2004 2005 2006 2007 2008 2009 2010 Mozambique Inflation,
Consumer Prices (annual %) 9 16,8 13,4 12,7 7,2 13,2 8,2 10,3 3,3 14,7
0 2 4 6 8 10 12 14 16 18
Endnotes
1 CMVM is the Portuguese Securities Market Commission in charge of supervising and regulating securities and other
financial instruments markets
2 Sumol+Compal 2012. Informação ao Mercado. [Online] Available at: 2 Sumol+Compal 2012. Informação ao Mercado. [Online] Available at:
http://www.sumolcompal.pt/app/uploads/calendario_financeiro/6956694814f5f0c8c17f5a.pdf [Accessed 10 October 2012]
3 SADC is an inter-governmental organization. Its goal is the further socio-economic cooperation and integration among 14
African States
4 Foreign direct investment is the long-term investment made by a company in terms of technology, management skills,
brands or physical assets in another country. It could then be used to replace exports from the home country. Commonly foreign direct investment includes mergers & acquisitions, building new facilities or Greenfield investments.
5 Sumol+Compal, 2012 Annual Management Report 2011. [Online] Available at:
http://en.sumolcompal.pt/investidores/relatorioscontas [Accessed 12 October 2012]
6 The non-alcoholic drinks industry includes different product categories such as soft drinks juice (orange, pineapple,
lemon, etc.), nectars, colas, drinks from extracts of lemon-lime, drinks based on tea, tonic and bitter (bitter drinks) energy drinks, flavoured or fruity waters
7 Sumol+Compal 2011 [online] Available at: http://www.sumolcompal.pt/quemsomos 8 Horeca: Sales channel which includes Hotels, Restaurants and Cafés
9 Sumol+Compal, 2012. Annual Management Report 2011 [Online] Available at:
http://en.sumolcompal.pt/investidores/relatorioscontas [Accessed 13 October 2012]
10Sumol+Compal, 2012 Annual Management Report 2011. [Online] Available at:
http://en.sumolcompal.pt/investidores/relatorioscontas [Accessed 12 October 2012]
11Sumol+Compal 2012 [online] Available at: http://www.sumolcompal.pt/unidadesnegocio [Accessed 12 October 2012] 12 Compal Essencial, 2012. Doses de Fruta. [Online] Available at: http://www.compalessencial.pt/# [accessed 19 October
2012]
13 Probeb, 21012. Legislação [Online] Available at: http://www.probeb.pt/conteudo/Legislação/-/27 [Accessed 15
November 2012]
14 Autoridade de Segurança Alimentar e Económica (ASAE) is the administrative authority specialized in the areas of food
security and economic monitoring. Is responsible for assessing and communicating risks in the food chain, as well as the discipline of economic activities
15 World Bank, 2012. World Economic Indicators 2011. [Online] Available at: http://databank.worldbank.org/ddp/home.do
[Accessed 15 November 2012]
16 Economico, 2012. “Portugal fecha 2011 com desemprego recorde de 13,6%” [Online] Available at:
http://economico.sapo.pt/noticias/portugal-fecha-2011-com-desemprego-recorde-de-136_137061.html [Accessed 16 November 2012]
17 Informa D&B, 2012. Non-Alcoholic Beverages Sector Analysis. [Online] Available at:
http://www.informadb.pt/estudossectoriais/sectores-portugal2012/Fev_SPb-Bebidas_nao_alcoolicas.pdf [Accessed 15 November 2012]
18 Economico, 2012. “Familias perdem 305 Euros no rendimento disponível” [Online] Available at:
http://economico.sapo.pt/noticias/familias-perderam-305-euros-no-rendimento-disponivel_141636.html
19 Probeb, Associação Portuguesa de Bebidas Refrescantes Não-Alcoolicas. [Online] Available at:
20 Probeb, 2012. Enquadramento do Sector [Online] Available at:
http://www.probeb.pt/conteudo/Enquadramento-do-Sector/-/29 [Acessed 14 November 2012]
21 Expreso, 2012. “Subida do IVA aumenta refrigerantes, café e comida para bebé”, 2011. [Online] Available at:
http://expresso.sapo.pt/subida-do-iva-aumenta-refrigerantes-cafe-e-comida-para-bebe=f697118 [Accessed 14 November 2012]
22 Sumol+Compal, 2012 Annual Management Report 2011. [Online] Available at
http://en.sumolcompal.pt/investidores/relatorioscontas [Accessed 12 October 2012]
23 Económico, 2012. “Sumol+Compal fecha ano com 15% das vendas ao estrangeiro”. Económico, 2011 [online] Available
at: http://economico.sapo.pt/noticias/sumolcompal-fecha-ano-com-15-das-vendas-ao-estrangeiro_126883.html [Accessed 3 November 2012]
24 Sumol+Compal, 2012. Annual Management Report 2011 [Online] Available at:
http://www.sumolcompal.pt/investidores/relatorioscontas [Accessed 20 October 2012]
25 Sumol+Compal, 2012. Annual Management Report 2011 [Online] Available at:
http://www.sumolcompal.pt/investidores/relatorioscontas [Accessed 20 October 2012]
26 Sumol+Compal, 2012. Annual Management Report 2011 [Online] Available at:
http://www.sumolcompal.pt/investidores/relatorioscontas [Accessed 20 October 2012]
27 Ernst & Young’s, 2012. Africa attractiveness Survey 2011, [Online] available at
http://www.ey.com/Publication/vwLUAssets/2011Africa_Attractiveness_Survey/$FILE/Attractiveness_africa_low_resoluti on_final_WEB.pdf[Accessed 15 November 2012]
28 United Nations, 2012. Population Division, Population Estimates and Projection Section [Online] Available at:
http://esa.un.org/wpp/Analytical-Figures/htm/fig_12.htm [Accessed 15 November 2012]
29 Interview to the Director of International Operations Department of Sumol+Compal 30 Ernst & Young’s, 2012. Africa attractiveness Survey 2011, [Online] available at
http://www.ey.com/Publication/vwLUAssets/2011Africa_Attractiveness_Survey/$FILE/Attractiveness_africa_low_resoluti on_final_WEB.pdf[Accessed 15 November 2012
31 CIA, 2012. World Fact Book [Online] Available at:
https://www.cia.gov/library/publications/the-world-factbook/geos/ao.html [accessed 15 November 2012]
32 Ernst & Young, 2012. Africa Attractiveness Survey, 2011. [Online] Available at:
http://www.ey.com/Publication/vwLUAssets/2011__Africa_Attractiveness_Survey/$FILE/Attractiveness_africa_low_resol ution_final_WEB.pdf [Accessed 15 November 2012]
33 The Doing Business Project provides objective measures of business regulations and their implementation through 185
economies. Economies are ranked on their ease of doing business, from 1 – 185. A high ranking on the ease of doing business index means the regulatory environment is more favourable to the starting and operation of a local firm. This index averages the country's percentile rankings on 10 topics. Doing Business Rank, 2011 Available at:
http://www.doingbusiness.org/~/media/GIAWB/Doing%20Business/Documents/Annual-Reports/English/DB11-FullReport.pdf [Accessed 17 October 2012]
34 The Corruption Perceptions Index ranks countries/territories based on how corrupt their public sector is perceived to be.
A country/territory’s score indicates the perceived level of public sector corruption on a scale of 0 - 10, where 0 means that a country is perceived as highly corrupt and 10 means that a country is perceived as very clean. A country's rank indicates its position relative to the other countries/territories included in the index. Transparency International, 2012. Corruption Perception Index 2011[Online] Available at: http://www.transparency.org/cpi2011/results/ [Accessed 20 October 2012]
35 CIA, 2012. “World Fact Book” [Online] Available at:
36 PLMJ, 2012. Mozambique Investment Guide. [Online] Available at:
http://www.plmj.com/xms/files/Guias_Investimento/2012/Guia_de_Investimento_em_Mocambique_final.pdf[Accessed 13 October 2012]
37The Consumer Confidence Index Survey measures the level of optimism that consumers have about the performance of
the economy. The highest the value, the highest is the confidence.
38
Ernst & Young’s 2011 Africa attractiveness survey reflected Africa’s attractiveness for foreign investors, perceptions and
2. TEACHING NOTES
2.1 Introduction
Sumol+Compal International Strategy case was prepared for class discussion purposes and not as a source of primary data or an illustration of effective or ineffective management decisions. The Sumol+Compal International Strategy Case should be made available to students and contains a list of exhibits to support the content of the case. Sumol+Compal International Strategy Teaching Notes is destined to instructors only and to provide the recommended approach to the case.
2.2 Synopsis
The history of Sumol+Compal Group dates back to 1954 when Refrigor produced the first fruit juice soft drink in Portugal. Meanwhile Compal, which started operating in the 50’s was becoming well known among Portuguese consumers for the quality of its concentrated tomato products. Both companies crossed paths in 2005 and in 2009 and after a merger process started operating as Group. It was the birth of Sumol+Compal. Present in the high rotation beverages industry with a product portfolio that could be segment into Nutrition Drinks, Soft Drinks, Water and Beer, the Group’s most important brands were positioned in the soft drinks market. In 2010 the Group was market leader in the soft drinks market.
Present in more than 69 countries the Group increased its turnover from foreign markets by 32.6% with most of its exports to Africa. Its products were well accepted especially in Angola, which represented the most important destination. The African market had great potential and opportunity for the maximization of out of international activities and to counter the effects of the economic crisis felt in the Portuguese and European markets. The Group believed that operations in this country could be a success as a result of a longstanding relationship in foreign trade activities between both parties.
The intention to move from simple exportations to direct investment in that continent had already been demonstrated for Angola and Mozambique, the International Operations Department had been studying the expansionary move for a few years and local production was eminent. It was a matter of what would be the best strategy to address that market through local production. The existence of market, the trade relation and partnerships built over the years and the presence of suitable conditions for this strategic advancement would meet the Group’s objectives.