1
The Influence of Risk Aversion on the Entrepreneur’s
Incubation Preferences: A quantitative study
Pedro Miguel de Carvalho Dias
152116181Dissertation submitted in partial fulfilment of the requirements for the degree of MSc in Business Administration at Católica Lisbon School of Business & Economics
Thesis written under the supervision of Cláudia Costa 01/06/2018
2
Acknowledgements
I would like to thank my advisor Cláudia Costa for her dedication, support and comprehension in the process of writing the thesis.
Also, I could not accomplish this without the support of my family and friends, that helped me in not losing the focus, and cheered me up when I lost my enthusiasm.
3
Abstract (EN)
Title: “The Influence of Risk Aversion on the Entrepreneur’s Incubation Preferences: A
quantitative study”
Author: Pedro Miguel de Carvalho Dias
Risk is a concept that is intrinsically related with the concept of entrepreneurship. Decisions are taken in context where there is little precedent on the outcomes and
conditions. This means that the ability of an individual to manage and the way he perceives and reacts to risk will have an impact on the likelihood of him becoming an entrepreneur and his performance.
The purpose of this study is therefore to establish a connection between an
individual’s relationship with risk with organizations that aim to help entrepreneurs reduce the risk and potentiate the growth of their ventures: incubation mechanisms. More precisely we look into the perception of value and the willingness to engage with these mechanisms and try to see if these are influenced by an individual’s aversion or propensity to risk. We’ve chosen 4 different incubation mechanisms: Accelerator, Incubator, Venture Capital Firm and Start-up Studio.
An online survey was conducted among Entrepreneurs and individuals who are considering starting their business. There were 68 valid responses. With this study we were not able to find a significant difference between the choices of incubators by risk averse and risk propense individuals. Similarly, we were not able to confirm that an individual’s risk aversion is able to significatively predict the amount of equity he/she is disposed to
exchange for the support given by different types of incubators. Lastly, our result found that there was no significant difference in risk profile between entrepreneurs who had engaged in start-up competitions and incubation programs and those that didn’t.
4
Abstract (PT)
Título: “A Influência da Aversão ao Risco em Empreendedores nas Preferências de
Incubação: Um estudo quantitativo”
Autor: Pedro Miguel de Carvalho Dias
O Risco é um conceito intrinsecamente ligado ao conceito de empreendedorismo. Decisões têm que ser tomadas num contexto onde existe pouco precedente em relação às consequências da mesma. A capacidade que um individuo tem de gerir o risco e a forma como este é percecionado pelo mesmo, vai ter portanto um impacto não só na probabilidade do mesmo se dedicar ao empreendedorismo como também à performance das suas
empresas.
O propósito deste estudo é então o de estabelecer uma conexão entre a relação de um individuo com o risco com a forma como perceciona organizações que têm como objetivo reduzir o risco e potenciar o crescimento das suas empresas: os mecanismos de incubação. Mais concretamente vamos olhar para a perceção do valor destes mecanismos e a disposição para interagir com os mesmos, de forma a perceber se estes são influenciados pela aversão ao risco do empreendedor. Para analisar esta questão escolhemos 4 tipos de mecanismos de incubação: Aceleradoras, Incubadoras, empresas de capitais de risco e start-up studios.
Um questionário online foi conduzido entre empreendedores e indivíduos que querem começar o seu próprio negócio. Obtiveram-se um total de 68 respostas válidas. Este estudo não encontrou diferenças significativas entre as escolhas de incubação entre
indivíduos avessos ao risco e indivíduos propensos. Adicionalmente, não foi possível confirmar que a aversão ao risco de um individuo prevê significativamente a quantidade de equity que o mesma está disposto a trocar em troca do suporte oferecido pelos diferentes mecanismos de incubação. Por ultimo, a nossa pesquisa não encontrou diferenças
significativas nos perfis de risco dos indivíduos que participaram em competições de start-ups e programas de incubação
5
Executive Summary/Table of contents
Acknowledgements ... 2
Abstract (EN) ... 3
Abstract (PT) ... 4
Executive Summary/Table of contents ... 5
Table of Tables ... 7 Table of Figures ... 8 Table of Appendixes ... 9 1. Introduction ... 10 1.1 Background ... 10 1.2 Problem Statement ... 10 2. Literature Review ... 12 2.1 Entrepreneurship ... 12
2.1.1 The Entrepreneur’s Psychological Profile ... 12
2.1.2 Risk Aversion and Entrepreneurship ... 14
2.2 Incubation models ... 17
2.2.1 Business Incubators ... 17
2.2.2 Accelerators ... 17
2.2.3 Venture Capital Firms ... 18
2.2.4 Start-up Studios ... 19
3. Methodology and Data Collection ... 21
3.1 Research Approach ... 21 3.2 Data Collection ... 21 3.3 Research Design ... 22 3.4 Measurement ... 22 3.5 Data Analysis ... 24 4. Results’ Analysis ... 25 4.1 Sample Analysis ... 25
4.2 Results from the Hypothesis Tests ... 27
4.2.1 Hypothesis 1: Multiple regression analysis- An individual’s risk aversion influences his perception of what is a fair equity payment to an incubation mechanism ... 27
4.2.2 Hypothesis 2: Chi-square test – There is a significant difference between the choices of incubator of risk averse individuals when compared to that of risk averse individuals ... 30
4.2.3 Hypothesis 3: Chi-square test – Individuals who have a higher risk aversion are more likely to have participated in an incubation program ... 31
5. Conclusions and limitations ... 32
6
5.2 Managerial/Academic implications... 33
5.3 Limitations and further research ... 34
References ... 35
Appendices ... 41
7
Table of Tables
Table 1: Measurement Variables ... 24
Table 2: Descriptive values of risk aversion variables ... 27
Table 3: Multiple regression independent variable results - Accelerator ... 28
Table 4: Multiple regression independent variable results - Incubator ... 29
Table 5: Multiple regression independent variable results - VC ... 29
8
Table of Figures
Figure 1: Sample composition – Started vs is considering starting his/her won business ... 25 Figure 2: Sample composition - Type of business ... 26 Figure 3: Sample composition - Technology Driven vs Non-Technology Driven ... 26
9
Table of Appendixes
10
1. Introduction
1.1 Background
Entrepreneurship is gaining an increasing level of importance as a mechanism for the development of small economies (Devece, Peris-Ortiz, & Rueda-Armengot, 2016). There is evidence of a positive connection between new businesses and job creation, which in turn increases factors such as competitiveness and social equality (European Commision, 2003; Haltiwanger, Jarmin, & Miranda, 2013). In order to have a successful entrepreneurial ecosystem, support from the government and interaction between the different participants is essential (Spigel, 2017). More importantly it is crucial that experienced entrepreneurs invest their time and resources in this ecosystem (Colin Mason & Brown, 2014).
We must therefore improve the research on how the different players in these ecosystems interact with each other, and how we can make the processes and systems that improve these relationships more efficient. If we are to avoid the stagnation of the
economies, it is crucial that societies keep innovating and dedicate themselves to improve their entrepreneurial ecosystems (Gauthier, Penzel, & Marmer, 2017). Incubation models can play an important role in this process.
Along with other factors, risk is a crucial part of entrepreneurship. These incubation mechanisms aim at helping to reduce the risk of death of start-ups. These organizations help start-ups navigate the complex and uncertain landscape of new venture creation.
Understanding how risk and incubation mechanisms are perceived by entrepreneurs might help them to better adapt their services to their target tenant and in this way provide them a better service. This is not true only for traditional models such as the accelerator, business incubator and venture capital firm, but it might help more recent models as well. New models, such as the Start-up Studio model, are emerging across multiple ecosystems (Szigeti, 2016) and the development of research could help these new mechanisms to adapt faster to the environment and spur innovation in this area.
1.2 Problem Statement
It is the purpose of this thesis to explore whether there is a connection between the relationship an individual has with risk, and its implications with his/her interactions with incubation mechanisms. The problem statement was thus defined as:
“The Influence of Risk Aversion on the Entrepreneur’s Incubation Preferences: A quantitative study”
11 - RQ1: Is there a relationship between risk aversion and the perceived value of
incubator mechanisms?
- RQ2: Does risk aversion influence the entrepreneur’s choice of incubation mechanism?
- RQ3: Does risk aversion affect the decision to participate in an entrepreneurship support program?
In the next section you will be able to first better understand the concepts associated with risk from a psychological perspective, which will be followed by an overview of some types of incubators and their characteristics.
12
2. Literature Review
2.1 Entrepreneurship
2.1.1 The Entrepreneur’s Psychological Profile
Entrepreneurship plays an important role in modern economy and society (Zhao, Seibert, & Lumpkin, 2010). This growing importance has led to a multitude of studies to understand the drivers behind it in order to foster innovation and economic growth (Zhao, Seibert, & Lumpkin, 2010). In this thesis we will be looking at the entrepreneur as the central figure in entrepreneurship and more specifically to its personality traits.
For the sake of this thesis we will define the entrepreneur as the founder, owner and manager of a small business (Rauch & Frese, 2007; Stewart & Roth, 2001).
Studies have shown that the Entrepreneur’s personality is different in some aspects compared to that of managers (Zhao, Seibert, & Lumpkin, 2010). These differences in personality partly have an influence on both the individual’s likelihood of becoming an entrepreneur and its subsequent performance (Zhao, Seibert, & Lumpkin, 2010; Lachman, 1980; Stewart, Watson, Carland, & Carland, 1998). The individual’s psychological characteristics are therefore vital to a comprehensive theory of entrepreneurship (Stewart, Watson, Carland, & Carland, 1998), and should be an integral part of its research (Carland, Hoy, Boulton, & Carland, 1984; Goldsmith & Kerr, 1991; Johnson, 1990).
One of the most commonly used theoretical frameworks to analyse an individual’s personality is the Big Five model (Zhao, Seibert, & Lumpkin, 2010). This model includes five different traits that together make up the basic structure of an individual’s personality (Zhao, Seibert, & Lumpkin, 2010). The personality traits are remarkably stable over time (Stewart, Watson, Carland, & Carland, 1998) and have a significant effect on the individual’s reactions and behaviours in different situations (Bem & Funder, 1978). Such traits also play a role on influencing individuals into choosing different situations, such as being employed versus starting your own company (Snyder & Ickes, 1985). The entrepreneurial traits are: Conscientiousness, Openness to experience, Agreeableness, Extraversion and Emotional Stability (Zhao, Seibert, & Lumpkin, 2010).
This model allows us to have some structure through which we can present some of the research regarding what makes an entrepreneur’s personality unique. We will be comparing each of the traits against two specific outcomes that seem to be the most relevant to this context. The first is the intention to become an entrepreneur. It can be defined as the individual’s expressed behavioural intention – the most immediate antecedent of a given behaviour (Fishbein & Ajzen, 1975) - to become an entrepreneur (Bird, 1988). The second outcome which will be analysed will be firm performance which is defined in terms of venture survival, growth and profitability (Baron, 2007). Studies show that the two most important constructs for both these outcomes are Openness to Experience and Conscientiousness (Zhao, Seibert, & Lumpkin, 2010).
Openness to Experience, “is the personality trait that describes someone who is intellectually curious, imaginative, and creative, someone who seeks out new ideas and alternative values and aesthetic standards” (Zhao, Seibert, & Lumpkin, 2010). This is not the same as to say that it is related to mental ability even though there are some aspects of intelligence that are related to creativity, such as divergent thinking (McCrae, 1987). Given this description, some
13 assumptions can be made as to why it is such an important factor for entrepreneurship. First, entrepreneurship is associated with creativity and the tendency to innovate (Zhao, Seibert, & Lumpkin, 2010). Being able to identify opportunities is probably associated with imagination, creativity and openness to new ideas (Ciavarella, Buchholtz, Riordan, Gatewood, & Stokes, 2004; Morrison, 1997) making this trait particularly important. Also, entrepreneurship is an unconventional choice making it more likely to attract individuals who are more open-minded and keener to test a different lifestyle (Zhao, Seibert, & Lumpkin, 2010). Additionally, even though Openness to Experience isn’t related with better performance in all areas, it does seem to be so in areas related to learning as is the case in schools and workplace training (Barrick & Mount, The Big Five personality dimensions and job performance: A meta-analysis, 1991). The ability to enhance performance explains why this construct is so important for entrepreneurship, given that entrepreneurs are required to make various decisions with little precedent which they can use as a guide (Zhao, Seibert, & Lumpkin, 2010). As a note, Openness to Experience seems to be the main construct differentiating high performing managers from high performing entrepreneurs giving additional support to the previous statement (Zhao, Seibert, & Lumpkin, 2010; Barrick, Mount, & Judge, 2001; Hurtz & Donovan, 2000).
The other central personality construct to entrepreneurship is conscientiousness. This trait is described as “an individual’s level of achievement, work motivation, organization and planning, self-control and acceptance of traditional norms, and virtue and responsibility towards others” (Zhao, Seibert, & Lumpkin, 2010; Costa, McCrae, & Holland, Personality and vocational interest in an adult sample, 1984; Roberts, Chernyshenko, Stark, & Goldberg, 2005). Individuals with a high need for achievement are more likely to search for work situations in which they have personal control over the outcomes, are exposed to moderate to high risk of failure, and have access to direct and timely feedback on their performance (McClelland, 1961). McClelland (1961) therefore inferred that individuals who have a high need for achievement would be keener to self-employment since it provides them with more of these conditions than working for an established company. This seems to be true as entrepreneurs appear have been found to be significantly higher in achievement motivation (Collins, Hanges, & Locke, 2004; Stewart & Roth, 2007). Another hypothesis could be that work goal orientation and perseverance – both constructs are part of Conscientiousness - are probably related to entrepreneurship (Zhao, Seibert, & Lumpkin, 2010).
Although to a lesser degree Emotional Stability also seems to be important in the likelihood of becoming an entrepreneur and firm performance (Zhao, Seibert, & Lumpkin, 2010). Emotional Stability describes individuals who are “calm, even-tempered, and hardy” (Zhao, Seibert, & Lumpkin, 2010). Entrepreneurs have a great responsibility regarding the success or failure of the start-up (Zhao, Seibert, & Lumpkin, 2010). This personal responsibility is accompanied by pressures related to a heavy personal workload, critical decision making with little precedent as a guide and frequently personal financial consequences at risk (Zhao, Seibert, & Lumpkin, 2010). Individuals who have a high score in this trait are more likely to remain calm and confident and focus better thus having a better performance (Zhao, Seibert, & Lumpkin, 2010). They are also more prone to deal with high stress and problems through positive thinking and direct action (Costa & McCrae, 1992). Emotional stability is therefore associated with better job performance across occupations (Barrick, Mount, & Judge, 2001) and with leadership and effectiveness (Judge, Bono, Ilies, & Gerhardt, 2002).
Extraversion in the surface might not appear to display as much relevance as the previous traits on both tendency to be an entrepreneur and firm survival (Zhao, Seibert, & Lumpkin, 2010). Nonetheless, it is positively related to both outcomes (Zhao, Seibert, & Lumpkin, 2010). It describes individuals who are “gregarious, outgoing, warm, and friendly” (Zhao, Seibert, & Lumpkin, 2010). They are also “energetic, active, assertive, and dominant in social situations” (Zhao, Seibert, & Lumpkin, 2010). Lastly these individuals “experience more positive emotions
14 and are optimistic, seeking excitement and stimulation” (Zhao, Seibert, & Lumpkin, 2010). This positive relation might be associated with the fact that many tasks in a new venture involve social interaction, such as the communication of the new venture’s vision and enthusiasm, creating a network with venture capitalists and other financing partners along with other entrepreneurs, managing the relationship with the employees, and negotiation, making extroverts better suited to handle these situations (Markman & Baron, 2003). Also, Judge et al. (2002) found extraversion to be the best predictor of leadership, which could also have an effect on the entrepreneur’s performance (Zhao, Seibert, & Lumpkin, 2010).
The last dimension, Agreeableness, was found to have no relation with either entrepreneurial outcome (Zhao, Seibert, & Lumpkin, 2010). This dimension is associated with an individual’s relationship with others (Zhao, Seibert, & Lumpkin, 2010). It describes individuals who are “trusting, altruistic, cooperative, and modest” (Zhao, Seibert, & Lumpkin, 2010). These individuals tend to “show sympathy and concern for the needs of others and to defer in the face of conflict” (Zhao, Seibert, & Lumpkin, 2010). On the other hand, someone low on Agreeableness might be described as “manipulative, self-centred, suspicious, and ruthless” (Zhao, Seibert, & Lumpkin, 2010).
2.1.2 Risk Aversion and Entrepreneurship
Stewart and colleagues (1998) developed a theoretical framework based on the three streams of research that are most common in the descriptions of the entrepreneur (Carland, Hoy, Boulton, & Carland, 1984; Bellu, 1987; Long, 1983): achievement motivation, risk-taking propensity and preference for innovation. The relationship of these psychological constructs with the entrepreneur has generally been supported by research (Stewart, Watson, Carland, & Carland, 1998).
The role of risk propensity is critical. According to Stewart and colleagues (1998) the relationship of the entrepreneur with risk is one of the most relevant and researched themes on the entrepreneur’s description and also because empirically it appears to be the most relevant and interesting construct to study considering the Start-up Studio’s unique characteristics when compared to other traditional incubation models.
Scholars disagree on how to relate the Big Five Model and risk propensity given that there isn’t a trait contained in it that addresses an individual’s relationship with risk (Zhao, Seibert, & Lumpkin, 2010). Rather, a part of the research suggests that this construct is more of a combination of all the other five (Nicholson, Fenton-O'Creevy, Soane, & Willman, 2005) – high extraversion, high openness, high emotional stability, low agreeableness and low conscientiousness (Zhao, Seibert, & Lumpkin, 2010). Others defend that risk propensity isn’t connected with the Big Five Model and represents in fact a separate sixth dimension of the Big Five Model (Jackson D. N., 1994; Paunonen & Jackson, 1996). Given the lack of a clear answer from the literature we will be addressing risk propensity as a separate dimension from the Big Five Model.
Risk propensity is the inclination to make choices and actions of which there is no knowledge regarding the success or failure of the outcomes (Jackson D. N., 1994). In an economic context, this means to be involved in situations that are related with a higher variance of results ( (Harrison & Rutström, 2008). It is worth noting that just as it happens with the personality traits on the Big Five Model, studies show that risk-taking propensity has a predisposition component as well and is not simply a situational variable (Jackson, Hourany, & Vidmar, 1972; Plax &
15 Rosenfeld, 1976; Sitkin & Weingart, 1995) – even though situational elements play a relevant part (March & Shapira, 1987).
Risk propensity seems to be a significant factor on entrepreneurial activity and success. First, entrepreneurial individuals appear not to be able to diversify the risk of their business (Moskowitz & Vissing-Jørgensen, 2002; Bitler, Moskowitz, & Vissing-Jørgensen, 2005) therefore their relation to risk seems to have some relevance (Hvide & Panos, 2014). Also, since entrepreneurs work on a less structured and less predictable environment and have the most responsibility over most decisions (Gasse, 1982; Kilby, 1971; Knight, 1921). Entrepreneurs are usually believed to take more risks than corporate managers (Bearse, 1982). In fact, when comparing the risk propensity of entrepreneurs and corporate managers, entrepreneurs have the highest risk propensity (Stewart & Roth, 2001; Stewart, Watson, Carland, & Carland, 1998; Stewart & Roth, 2004). This seems to be in line with theoretical models in which individuals that have a higher risk aversion choose careers where they are employed, and less risk averse individuals tend to start their own businesses (Kanbur, 1979; Kihlstrom & Laffont, 1979).
On its own one might assume that individuals who have a high risk propensity are more suited for entrepreneurship than individuals with a low score on this trait, however this appears to not be the case (Hvide & Panos, 2014). Even though risk averse individuals are less likely to choose self-employment over a career on an already established firm (Knight, 1921; Hvide & Panos, 2014), when they do start their own business they tend to perform better in terms of profitability, growth and survival (Hvide & Panos, 2014; Stewart, Watson, Carland, & Carland, 1998). The reason why is still not clear even though Hvide and Panos (2014) theoretical analysis suggests that this happens due to the fact that less risk averse individuals are willing to accept lower returns on their business performance for a given level of risk. By requiring a different level of returns for the same amount of risk, a risk averse individual might value incubators – which can be seen as mechanisms that reduce risk in new ventures – differently than a risk propense individual does both an absolute level and relatively to other incubators. This leads us to our first two Hypotheses:
H1: An individual’s risk aversion influences his perception of what is a fair equity
payment to an incubation mechanism.
H2: There is a significant difference between the choices of incubator of risk averse
individuals when compared to that of risk averse individuals.
Risk propensity does seem to have its value during the early stages of entrepreneurship: since individuals who have a low aversion to risk are more likely to be interested in entrepreneurship (Zhao, Seibert, & Lumpkin, 2010; Stewart, Watson, Carland, & Carland, 1998). The importance of this first outcome might be related to the degree to which individuals look for new venture opportunities, develop their networks, get funding, and ready themselves for the creation of a new firm (Bird, 1988; Krueger, Reilly, & Carsud, 2000). Incubation and financing mechanisms have been created with the aim of reducing risk and accelerating growth (Scheuplein & Kahl, 2017).. This leads us to our third and final hypothesis:
H3: Individuals who have a higher risk aversion are more likely to have participated in
16 The next section will analyse some of them.
17
2.2 Incubation models
2.2.1 Business Incubators
Business Incubators are seen by policy makers as an agent that increases employment and boosts the economy (European Commission, 2002; Bergek & Norrman, 2008; Smilor & Gill, 1986; Lalkaka, 2003; Reitan, 1997). In fact, evidence on their actual efficacy on increasing firm survival rates, growth potential (Massey, Quintas, & Wield, 1992; Phan, Siegel, & Wright, 2005) and as a consequence return on investment (Bergek & Norrman, 2008) is still to be found.
Despite the growth observed in the incubation market for many years now (Pauwels, Clarysse, Wright, & Van Hove, 2016), the definition of incubators is still not consensual and we still don’t have a clear unified theory on these mechanisms (Bruneel, Ratinho, Clarysse, & Groen, 2012; Mian, Lamine, & Fayolle, 2016; European Commission, 2002; Hackett & Dilts, 2004; Bøllingtoft, 2012). Nonetheless, academics broadly define it as “the way in which an Incubation entity provides support to start-ups with the purposes of increasing their survival chances and accelerating their growth and development” (Pauwels, Clarysse, Wright, & Van Hove, 2016). This definition includes Business Incubators, Technology Parks, Co-Working Spaces and Accelerators.
These are all different organizations with different operating methods and different targets but for the sake of this thesis and given that in many cases the relative similarities of the models (Mian, Lamine, & Fayolle, 2016; Scheuplein & Kahl, 2017) we will be focusing on Business Incubators -a type of mechanism within the incubator category - and Accelerators.
Bruneel and colleagues (2012) defined Business Incubators as “property-based initiatives (Phan, Siegel, & Wright, 2005) providing their tenants with a mix of services encompassing infrastructure, business support services and networking (Bergek & Norrman, 2008; Hansen, Chesbrough, Nohria, & Sull, 2000; Lalkaka & Bishop, 1996; Peters, Rice, & Sundararajan, 2004)”. The extent to which their support is provided might in part be explained by the date of its foundation (Bruneel, Ratinho, Clarysse, & Groen, 2012). Bruneel and colleagues (2012) argue that the development of the incubation market can be separated in three distinct generations and that each new generation brought a new characteristic to the offer of the Business Incubators.
The first generation, starting in the 1980’s provided mainly office space (Bruneel, Ratinho, Clarysse, & Groen, 2012). The second one, starting in the 1990’s provided not only office space but In-House Business Support as well (Bruneel, Ratinho, Clarysse, & Groen, 2012). Lastly, the third generation, that started in the 2000’s, provided all past features but added access to networks (Bruneel, Ratinho, Clarysse, & Groen, 2012). Their findings also seem to point to the possibility that even though Incubators created in previous generations often offer the same services and support as more recent generations, they do so without changing their target tenants resulting in them having firms with some relative maturity, that are not only able to pay rent but also to which many of these added features do not add significant value. Business Incubators are often publicly funded, and charge rent to their tenants and in many cases are not self-sustainable (Bruneel, Ratinho, Clarysse, & Groen, 2012).
18 In the mid-2000’s, a new incubation model has emerged: the accelerator (Pauwels, Clarysse, Wright, & Van Hove, 2016). After the third incubation evolution mentioned above, it is the result of a focus on intangible, knowledge-intensive, support services in recent years (Pauwels, Clarysse, Wright, & Van Hove, 2016). An accelerator is a mechanism that aims to accelerate the creation of new ventures through the provision of education and mentoring services, over a defined and usually relatively short time frame through an intense program (Cohen & Hochberg, 2014; Miller & Bound, 2011; Pauwels, Clarysse, Wright, & Van Hove, 2016). There has been a rapid growth in the number of accelerators across different regions over the years (Pauwels, Clarysse, Wright, & Van Hove, 2016). In 2013, Seed-DB registered over 213 accelerators worldwide.
Although being similar to Business Incubators in the nature of their services and support, there are still several distinguishing characteristics that differentiate this incubation model (Isabelle, 2013). First, accelerators are not designed to provide physical resources and office support services over a long period of time (Pauwels, Clarysse, Wright, & Van Hove, 2016). The second differentiating factor is that they usually offer pre-seed investment to the start-ups that participate on their programs in exchange for equity (Pauwels, Clarysse, Wright, & Van Hove, 2016). This can be beneficial given the fact that there have been some accusations stating that incubators merely act as life support to their tenants to secure rent and keep their incubation spaces filled (Pauwels, Clarysse, Wright, & Van Hove, 2016). By having equity on their start-ups, accelerators have an incentive to make sure that they succeed and develop to their potential (Pauwels, Clarysse, Wright, & Van Hove, 2016). Thirdly, in terms of preferred financing for their graduates, accelerators seem to be more closely connected with Business Angels and small-scale investors than with Venture Capital firms. This might be explained by accelerators focus on early-stage tech start-ups whose costs of experimentation have significantly decreased over the years, versus more technology intensive projects such as university research spin-offs which might require a higher investment (Pauwels, Clarysse, Wright, & Van Hove, 2016). Fourthly, Accelerators place a higher significance on business development and aim at making their start-ups investment ready through mentoring, network and peer-to-peer support (Christiansen, 2009). Kim and Wagman (2014) even suggest that accelerators provide start-ups with legitimacy in the eyes of outside investors - facilitating in this way the obtainment on financing after graduation - through the provision of information and services such as screening processes and mentoring. Lastly, their programs are more intense than regular incubators, with an average duration of 3-6 months, and intend to shorten the start-up journey resulting in either a quicker growth or a quicker failure (Pauwels, Clarysse, Wright, & Van Hove, 2016).
2.2.3 Venture Capital Firms
The Venture Capital Firm support structure is a little different from the incubation models mentioned above. It concerns a segment of the Private Equity Industry relating equity investment in the early stages of the ventures (Zider, 1998). Traditionally, Venture Capital Firms are seen as providers of capital for companies that more traditional channels, such as banks, are not willing to, given the lack of assets new ventures have for securing debt (Meglio, Mocciaro Li Destri, & Capasso, 2017). The funds provided allow the ventures to relax their financial constraints and, in this way, focus on growing the business (Meglio, Mocciaro Li Destri, & Capasso, 2017).
It’s difficult to make generalisations on a VC firm model given that the VC market is heterogenous depending on factors such as legal form, size and stage of their investments, motives and criteria for investing, timing and exit methods (De Clercq, Fried, Lehtonen, & Sapienza, 2006). As a consequence, we can find different labels for a multitude of different types of VC’s
19 (Meglio, Mocciaro Li Destri, & Capasso, 2017). Even considering that, the VC’s offering usually goes beyond the financial support alone. VC’s have been found to play an increasingly important role on the process of professionalizing a venture’s management (Zider, 1998). This is achieved through a combination of key factors (Meglio, Mocciaro Li Destri, & Capasso, 2017). VC’s often have a personal investment in their funds and a part of their compensation is usually dependant on the funds’ performance (Gifford, 1997). Not only that, but VC’s are paid by the investors to monitor the VC’s fund’s investment (Sahlman, 1990). It is then logical that one of the major focuses of VC’s concerns monitoring the venture’s performance (Meglio, Mocciaro Li Destri, & Capasso, 2017). As a result, on one hand they help the venture’s management establish achievable goals (Sapienza & Gupta, 1994), and on the other they make sure that these goals are accomplished (Meglio, Mocciaro Li Destri, & Capasso, 2017).
VC firms are also usually involved in several value adding activities (Busenitz, Fiet, & Moesel, 2004; Sapienza, 1992). First of all, they provide feedback and mentor the ventures in which they invest (Meglio, Mocciaro Li Destri, & Capasso, 2017). This translates in them providing strategic advice on subjects on which they have developed know-how including the development of management procedures (Meglio, Mocciaro Li Destri, & Capasso, 2017), obtainment of further financing (Lerner, 1995) and establishment of plans for an acquisition/IPO (Megginson & Weiss, 1991). On top of that another key activity provided by VC’s is the networking (Meglio, Mocciaro Li Destri, & Capasso, 2017). VC’s establish contact with key elements that are able to help start-ups with hurdles they might run into and/or provide them with effective solutions (Hochberg, Ljungqvist, & Lu, 2007). Venture Capital Firms also provide a reputational role (Meglio, Mocciaro Li Destri, & Capasso, 2017). By having a VC stamp of approval many instances where the entrepreneur might be looking into involving external stakeholders might be made easier and give the venture more credibility (Meglio, Mocciaro Li Destri, & Capasso, 2017). Lastly, and related to the monitoring activities, the VC also performs a crucial disciplinary role by making sure that the entrepreneur achieves the agreed goals and by replacing the CEO when needed (Meglio, Mocciaro Li Destri, & Capasso, 2017). Although unpleasant, the last one is a key source of VC’s added value (Fried, Bruton, & Hisrich, 1998).
This recipe seems to have effect since companies that are backed by VC have been shown to out-perform non-backed ventures (Bertoni, Colombo, & Grili, 2011).
2.2.4 Start-up Studios
All of the previous organizations and models have been available for a reasonable time period and are now some of the most commonly available options on the entrepreneurial ecosystem for founders looking for help on creating and growing their business (Scheuplein & Kahl, 2017). There is a newer mechanism that we want to analyse, not only for the traction it is getting (Szigeti, 2016) but also because it represents an innovation in the incubation market.
Start-up Studios are yet to become a readily available solution in all entrepreneurial ecosystems but, as already mentioned, are gaining traction on specific regions – the estimated funding by Company Builders in Germany amounts to approximately double the investments made by private VC investors in 2015 - and might do just that in the future (Scheuplein & Kahl, 2017). It has many designations: Venture Builder, Start-up Studio and Company Builder (Szigeti, 2016), and we adopt the term Start-up Studio to encompass all the definitions.
Start-up Studios present themselves as combination of an early stage Venture Capital firm and a Business Incubator. The level of involvement and support of these firms is beyond any of
20 the other organizations mentioned in the section above, and as a result so is their equity take and the control that they ask in general of their start-ups (Scheuplein & Kahl, 2017).
To my knowledge, the quality research on these mechanisms is still scarce if not inexistent. There are also some data restrictions regarding Start-up Studios given the fact that, since the financing and growth of the ventures takes place under an overarching company, in many instances the financial records will concern the parent organization and the start-ups financial data will be aggregated with it (Scheuplein & Kahl, 2017). The most consistent study found on these organization was done by Attila Szigeti, which looked into 51 Start-up Studios and 212 portfolio companies in 2015 and more than 120 Start-up Studios and 400 portfolio companies in 2017.
The academic literature is yet to define exactly what is a Start-up Studios. Szigeti (2016) described them as organizations that build several companies in succession. Start-up Studios gather large amounts of resources available that they then distribute to various start-ups simultaneously (Rao, 2013). Starting off with the financial resources, Start-up Studios not only have an equity investment on the start-ups that they take in but generally also pay a salary to the founders of the start-up as well (Szigeti, 2016). Similarly, to Business Incubators, Start-up Studios usually provide their tenants with office space and shared resources (Szigeti, 2016). A unique offer from these organizations lies in the existence of a Start-up Studio core team that can be deployed to various projects/start-ups as needed (Szigeti, 2016). This team is usually composed of individual with different backgrounds and competencies – e.g. development, marketing, sales and legal – according to the Start-up Studio’s target market needs (Szigeti, 2016).
Research shows that VC firms learn from repeated experiences to refine their abilities to scout and coach ventures (Petty & Gruber, 2011). Scheuplein, and Kahl (2017) suggest that the same might happen with Start-up Studios, where the employed entrepreneurs gather experience on launching start-ups and allow the founders to evolve more quickly along the learning curve making the business creation process more effective. These synergies occur not only between the Start-up Studio team and the entrepreneurs, but also among the different portfolio firms (Scheuplein & Kahl, 2017). Scheuplein and Kahl (2017) hypothesise that this might mean that these mechanisms might be best suited for ecosystems where financial and entrepreneurial resources are not readily available to founders and where technological change is high – such as Berlin, Germany. As mentioned in the beginning of this section given the size of the investment being made, the resources deployed – financial and otherwise – and the level of involvement the large majority of the risk associated with the new venture will then lay with the Start-up. It is then understandable that Start-up Studios ask for greater start-up control than other types of investors (Scheuplein & Kahl, 2017) – somewhere between 30-80% with an average of 50% (Szigeti, 2016).
21
3. Methodology and Data Collection
This section describes the methodology used to analyse the hypothesis stated in the previous sections, as well as the collection of the data used.
3.1 Research Approach
It is the main purpose of this thesis to understand the effects of the entrepreneur’s risk aversion with different aspects of his/her relationship with the incubation ecosystem.
In terms of the research conducted it is mostly exploratory. We collected quantitative primary data using an online survey, which was then used to test our
hypothesis. Our survey was designed using Qualtrics Software and distributed by email and private messages on LinkedIn.
Collecting data through an online survey has both benefits and disadvantages. Starting with the benefits, this method is faster, has low to no costs, allows for more flexibility, to collect a higher sample, is more time efficient and convenient (Duffy, Smith, Terhanian, & Bremer, 2005; Evans & Mathur, 2005). In terms of disadvantages, collecting data through a survey is related with a sampling problems, bias and error in the selection of the respondents (Duffy, Smith, Terhanian, & Bremer, 2005) and privacy and security issue (Evans & Mathur, 2005).
3.2 Data Collection
The survey was distributed using two different channels: email and social media (i.e LinkedIn). Emails were sent to different incubation organizations in Portugal, namely:
• Beta-i
• Build-Up Labs
• Center for Technological Innovation and Entrepreneurship • Faber Ventures
• Fábrica de Start-Ups • Nova Venture SBE Lab • Startup Lisboa
Given the criteria of the target respondent we were looking for we chose LinkedIn as the 2nd distribution method of the survey. We used the search function and filters to look
for individuals who were Founders of Start-ups in Lisbon and sent them an InMail containing the link of the survey.
The answers were collected from the 19th of May 2019 to the 19th of August 2019
and a total of 71 responses were collected, 68 of which where valid.
Given the nature of our hypothesis it is important that the respondents had some contact with the entrepreneurial ecosystem and were familiarized with the terms and
22 processes around venture creation. This aims to reduce the number of answers where the respondent doesn’t have a clear perception on the consequences of these types of decisions and so that the answers aren’t given solely on a theoretical or abstract perspective. Taking this into consideration, the target respondents of this survey were entrepreneurs and employees of start-ups/incubation organizations who are considering starting their own business.
3.3 Research Design
The survey includes 26 questions and can be divided in four sections. The first section contains two questions that measure the risk aversion of the respondent.
The second section contains 8 questions that aim to categorize the type of
respondents – e.g if they had already started a business and if so in what area and the type of incubation and investment programs they had been a part of.
The next section started with a small description of each of the incubation
mechanisms studied on this thesis – Accelerator, Incubator, Venture Capital Firm and Start-up Studios. This question was followed by 6 questions that looked into choices and
perceptions on these mechanisms.
The fourth and last section contained 8 questions assessing demographic aspects of the respondents such as age and education Level.
3.4 Measurement
Using the same section division described in the previous section, the first section included the measurement of a key variable to this survey: Risk Aversion. We had two questions that assessed this.
The first question of our survey was adapted from the previously used question by Harthog, Ferrer-I-Carbonell and Jonker (2002): “In a lottery, 1 in 10 people will win 1000€. What is the most that you would be willing to pay for a ticket in this lottery?”. This question allows us to calculate the Arrow-Pratt measure of absolute risk aversion. Having the prize value - Ζ -, the probability of wining the prize – α – and the maximum price the respondent is willing to pay for the ticket, the reservation prize, - λ – we can then calculate the Arrow-Pratt measure of absolute risk aversion – ρ (Harthog, Ferrer-I-Carbonell, & Jonker, 2002; Cramer, Hartog, Jonker, & Praag, 2002):
𝜌 = 𝛼Ζ − λ
𝜆² 2 +
𝛼Ζ² 2 𝛼𝜆Ζ
In the specific context of our question, this means that for a λ=0 – maximum risk aversion – we will have a ρ = 0.002; for a λ = 100 – risk neutrality – we will have a ρ = 0;
23 and for λ = 1000 – the greatest degree of risk propensity – we get a ρ = -0.002. This is therefore a continuous variable contained within -0.002 and 0.002.
The second question aimed to assess risk aversion as well. It asked the respondent to evaluate their risk aversion on a scale from 0 to 10 (0 = highest level of risk propensity, 10 = highest level of risk aversion). Mata (2018) suggests that Self-Reported measures are the most accurate measures of risk aversion. When compared with, for example, behavioural measures, self-reported measures are much more stable across time (Mata, Frey, Richter, Schupp, & Hertwig, 2018). Additionally, and although risk preference on an individual may vary between different domains (i.e financial, health, recreational, and social), self-reported measures evaluate a general factor of risk preference (Mata, Frey, Richter, Schupp, & Hertwig, 2018), which is what we are trying to assess in this research.
Moving to the second section of the survey, it included 8 questions. These questions aimed at understanding the profile of the respondent. This section starts by asking the respondent if they had ever started a business (“Yes, I have/have had a business”; “Yes, I have thought about it” and “No”) and if the answer was positive they would be asked to indicate how many through a multiple choice question ranging from 0 to 10+. They were
then asked what type of business they had (“Family Business”, “Social” and “Innovation Driven”), and if the respondent chose the last option, another question containing two options was asked in order to understand if the business was technology driven
(“Technology Oriented” and “Non-Technology Oriented”). The last four questions of this section aimed at understanding if the respondent had: participated in any Start-Up
competition or Incubation Program (“Yes” and “No”), and if so which type(s)
(“Accelerator”, “Incubator”, “Venture Capital Firm”, “Start-Up Studio”, “Start-up Ideation Competition” and “European/Government Program”); or if the respondent had ever
received any investment for their project/business (“Yes” and “No”), and if so which source(s) (“Friends/Family”, “Business Angel”, “Venture Capital Firm”, “Incubator”, “Accelerator”, “Bank” and “European Funds”).
The third section started with a description of the different Incubation Mechanisms chosen to study in this thesis: accelerator, incubator, venture capital firm and startup studio. The first questions asked which incubation mechanism the respondent would be more inclined to choose if he/she had recently created a new start-up (“Accelerator”, “Incubator”, “VC” and “Start-up Studio”). Depending on the answer the respondent was then asked which of the features included in the description they valued the most. Lastly, the
respondent was asked to use a slider in order to evaluate what they considered to be a fair equity percentage for each of the incubation mechanisms to receive as payment taking into account the level of support given. The values were registered as an integer percentage from 1-100%.
The last section of the survey included 8 control questions about demographics. These were: age, education level, occupation, type of employment, Gender, Marital Status, if the respondent had any children and if so, how many.
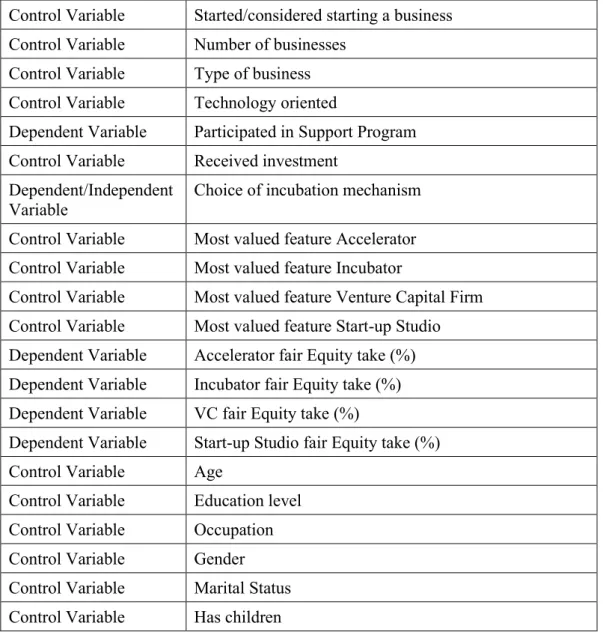
Type of Variable Description
Independent Variable Arrow-Pratt measure Independent Variable Self-reported risk aversion
24 Control Variable Started/considered starting a business
Control Variable Number of businesses Control Variable Type of business Control Variable Technology oriented
Dependent Variable Participated in Support Program Control Variable Received investment
Dependent/Independent Variable
Choice of incubation mechanism Control Variable Most valued feature Accelerator Control Variable Most valued feature Incubator
Control Variable Most valued feature Venture Capital Firm Control Variable Most valued feature Start-up Studio Dependent Variable Accelerator fair Equity take (%) Dependent Variable Incubator fair Equity take (%) Dependent Variable VC fair Equity take (%)
Dependent Variable Start-up Studio fair Equity take (%) Control Variable Age
Control Variable Education level Control Variable Occupation Control Variable Gender Control Variable Marital Status Control Variable Has children
Table 1: Measurement Variables
3.5 Data Analysis
Based on the answers obtained through the survey, the results will have to be statistically analysed in order to be able to draw conclusions regarding the Hypothesis we considered. We chose SPSS (version 25) as the software program to use in this analysis.
We start by describing the sample using the control variables included gathered from section 2 of our questionnaire.
We then test each of the hypothesis using different statistical methods. Due to the nature of the variables, our first two hypotheses will be tested using a non-parametric test: the Chi-Square test. To test whether an individual’s risk aversion influences his perception of what is a fair equity payment to an incubation mechanism, we used a multiple regression model for each of the incubation models.
25
4. Results’ Analysis
This chapter details the analysis of the data obtained through the survey described in the previous chapter and present the results of the tests of the hypothesis described in the second chapter.
4.1 Sample Analysis
Our sample contains a total of 71 respondents. Of these we removed 3 who hadn’t started a business and were not considering it which left us with 68 valid responses.
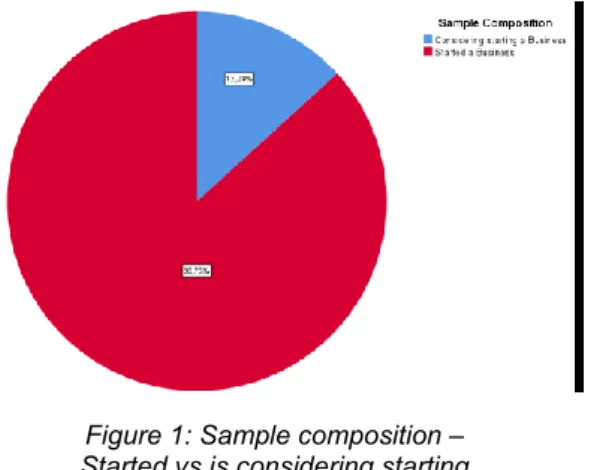
The majority of our sample has started at least one business (86.76%) while 13.24% are considering it (Fig.1).
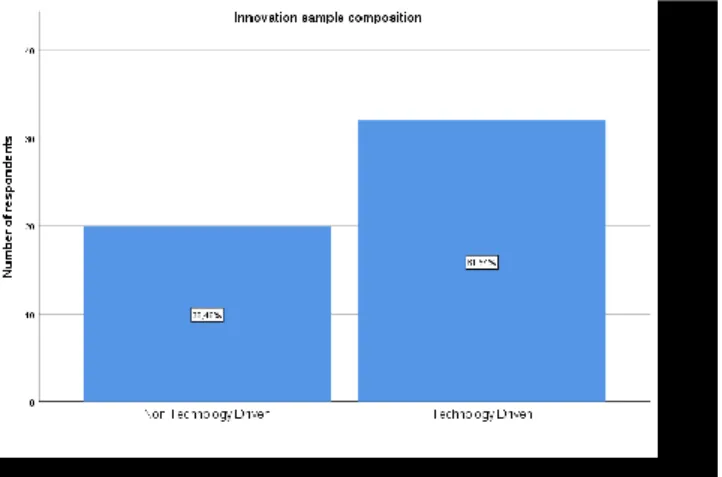
In terms of types of business, the respondents own or are considering creating, most of the respondents find themselves in the “Innovation Driven” category (76.47%), followed by the “Social” category (16.18%) and lastly, by the “Family Business” category (7.35%) (Fig.2). Looking specifically into the “Innovation Driven” category, it can be subdivided in Technology Driven Businesse, which corresponds to 61.54% of this subset, and Non-Technology Driven Businesses, representing 38.46% of this subgroup.
Figure 1: Sample composition – Started vs is considering starting
26
Figure 2: Sample composition - Type of business
Figure 3: Sample composition - Technology Driven vs Non-Technology Driven
In terms of risk aversion, and as mentioned in the previous section, there were two questions which measured this characteristic: the lottery question, which allowed to calculate the Arrow-Pratt Measure; and the Self-Report question.
In terms of the Arrow-Pratt measure the results are highly negatively skewed (Asymmetry score = -1,551), which means that almost practically all our sample is
considered risk averse according to the results of this calculation. The values for the Mean, Median and Standard-Deviation of this variable can be found on Table 2.
The second measure of risk aversion seems to have a more promising and realistic distribution. This variable is negatively skewed as well, but to a much lesser degree (-0,475 asymmetry score). When looking at the descriptive statistics – shown in Table 2 – we can see that the both the mean and the median are much closer to 5 – middle of the scale – which corresponds to risk neutrality.
Given the difference in the results and the characteristics of both distributions, the second variable, i.e self-reported risk aversion, was chosen to test our hypotheses.
Mean Median
Standard-Deviation Arrow-Pratt
Measure
27 Self-reported risk
aversion
6,66 7,00 1,62
Table 2: Descriptive values of risk aversion variables
Using this variable and dividing the sample into 2 groups (Risk Averse = Risk Aversion >5; Risk Propense = Risk Aversion ≤ 5), we get that 77.94% of the sample is Risk Averse while the remaining 22.06% are Risk Propense.
4.2 Results from the Hypothesis Tests
4.2.1 Hypothesis 1: Multiple regression analysis- An individual’s risk aversion
influences his perception of what is a fair equity payment to an incubation mechanism
To test this hypothesis, we will have to subdivide it by incubation mechanism. Because of this we will end up having 4 distinct sub-hypotheses. Nonetheless, the method used to test these hypotheses was the same for all of them.
These hypotheses aim to understand the effect of an individual’s relationship with risk on his/her valuation of a fair price for the services and support given by the incubation mechanism. This means that our 2 main variables will be Risk Aversion - our independent variable - and the incubation mechanism’s Fair Equity Take (%) – the dependent variable. This second variable will actually be 4 separate variables, one for each of the incubation mechanism’s. Both variables are composed of integer values along a scale. This allows us to use these variables to create a linear/multiple regression.
Aside from the variables mentioned above, we will also include the Choice of Incubation Mechanism in the model. This is a categorical variable which was transformed into three dummy variables where the value 0 on all of them signifies the choice of the Accelerator model by the respondent. These variables will be included as independent variables and will intend to explain the Fair Equity Take (%).
Our model was then defined as follows:
𝑦 = 𝛽0+ 𝛽1× 𝑅𝑖𝑠𝑘𝐴𝑣𝑒𝑟𝑠𝑖𝑜𝑛 + 𝛽2× 𝐶ℎ𝑜𝑠𝑒𝐼𝑛𝑐𝑢𝑏𝑎𝑡𝑜𝑟 + 𝛽3× 𝐶ℎ𝑜𝑠𝑒𝑉𝐶 + 𝛽4× 𝐶ℎ𝑜𝑠𝑒𝑆𝑈𝑆
Before proceeding with the test, it is worth noticing that some inconsistent
responses concerning the Fair Equity Take (%) of the different incubation mechanisms were removed. Upon looking at the data, there were responses that didn’t seem to be considerated at all, e.g there was an answer where the fair equity take for each of the incubation
mechanism was 0%. This could mean that those individuals were not familiarized with the incubation and entrepreneurial ecosystem and therefore we removed those outliers. We used the score method in order to identify the outliers and removed all the cases where the
z-28 score was either smaller than -3 or larger than 3. 2 cases were removed and our sample for these tests was 66 responses.
4.2.1 a) – An individual’s risk aversion influences his perception of what is a fair equity payment to an accelerator
Starting with the accelerator incubation mechanism, the results are significant. Our regression as a whole had a significance score of 0,14%. Since this score<5% we can reach the conclusion that this regression is accurate at predicting what an individual will consider as a fair equity take payment to the accelerator, based on their self-reported risk aversion and the type of incubation mechanism they would choose to receive support in the creation of a new venture. Our regression had an Adjusted R-square of 0.1994, meaning it allows us to predict 19.94% of what an entrepreneur considers to be a fair equity payment to an accelerator.
Looking at the main independent variable in analysis, Risk Aversion, the results were significant as well with a p-value of 0,01134. The coefficient associated with this variable was -0,8170, meaning that for each additional unit of risk aversion, the fair equity payment to the accelerator decreases by 0.817%. We will therefore accept our Hypothesis.
Regarding the other independent variables, only one of them was found to be significant – ChoseSUS -, while another was found to be partially significant – ChoseVC – and the other not significant – ChoseIncubator. You can find more information on these results below on Table 3.
𝑦 = 11,83 − 0,82 × 𝑅𝑖𝑠𝑘𝐴𝑣𝑒𝑟𝑠𝑖𝑜𝑛 − 1,95 × 𝐶ℎ𝑜𝑠𝑒𝐼𝑛𝑐𝑢𝑏𝑎𝑡𝑜𝑟 − 2,17 × 𝐶ℎ𝑜𝑠𝑒𝑉𝐶 + 3,69 × 𝐶ℎ𝑜𝑠𝑒𝑆𝑈𝑆
Variable Sign. Level Coefficient
RiskAversion 0,011339852 -0,81703
ChoseIncubator 0,168900121 -1,95202
ChoseVC 0,07782109 -2,17031
ChoseSUS 0,039023487 3,686832
Table 3: Multiple regression independent variable results - Accelerator
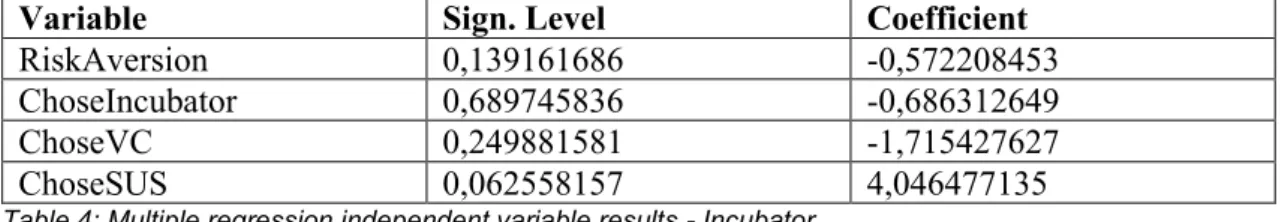
4.2.1 b) – An individual’s risk aversion influences his perception of what is a fair equity payment to an incubator
In what concerns the incubator our regression was partially significant. With a p-value of 0,0612 this regression is above the 5% confidence interval. However, it is still below the 10% confidence interval and can therefore moderately predict the values of the
29 dependent variable. Our regression had an Adjusted R-square value of 0,0784. This means our regression was moderately able to predict 7.84% of the value of our dependent variable.
Looking at the main independent variable in analysis, Risk Aversion, the results were not significant with a p-value of 0,1392. Because of this we shall reject our hypothesis.
Regarding the other independent variables, only one of them was found to be
partially significant – ChoseSUS -, while the other two were not (see Table 4). You can find more information on these results below on Table 3.
𝑦 = 10,00 − 0,57 × 𝑅𝑖𝑠𝑘𝐴𝑣𝑒𝑟𝑠𝑖𝑜𝑛 − 0,69 × 𝐶ℎ𝑜𝑠𝑒𝐼𝑛𝑐𝑢𝑏𝑎𝑡𝑜𝑟 − 1,72 × 𝐶ℎ𝑜𝑠𝑒𝑉𝐶 + 4,05 × 𝐶ℎ𝑜𝑠𝑒𝑆𝑈𝑆
Variable Sign. Level Coefficient
RiskAversion 0,139161686 -0,572208453
ChoseIncubator 0,689745836 -0,686312649
ChoseVC 0,249881581 -1,715427627
ChoseSUS 0,062558157 4,046477135
Table 4: Multiple regression independent variable results - Incubator
4.2.1 c) – An individual’s risk aversion influences his perception of what is a fair equity payment to a venture capital firm.
The Venture Capital regression was partially significant. With a p-value of 0,0556 this regression is slightly above the 5% confidence interval. Our regression had an Adjusted R-square value of 0,0784. This means our regression was moderately able to predict 7.84% of the value of our dependent variable.
The main independent variable being analysed, Risk Aversion, was not significant for this model with a p-value of 0,5607. We shall therefore reject this hypothesis.
Regarding the other independent variables, only one of them was found to be
partially significant – ChoseSUS -, while the other two were not (see Table 4). You can find more information on these results below on Table 3.
𝑦 = 23,58 − 0,41 × 𝑅𝑖𝑠𝑘𝐴𝑣𝑒𝑟𝑠𝑖𝑜𝑛 − 3,77 × 𝐶ℎ𝑜𝑠𝑒𝐼𝑛𝑐𝑢𝑏𝑎𝑡𝑜𝑟 + 1,47 × 𝐶ℎ𝑜𝑠𝑒𝑉𝐶 + 9,13 × 𝐶ℎ𝑜𝑠𝑒𝑆𝑈𝑆
Variable Sign. Level Coefficient
RiskAversion 0,560714 -0,41285
ChoseIncubator 0,238038 -3,7683
ChoseVC 0,593356 1,465023
ChoseSUS 0,023916 9,13169
30
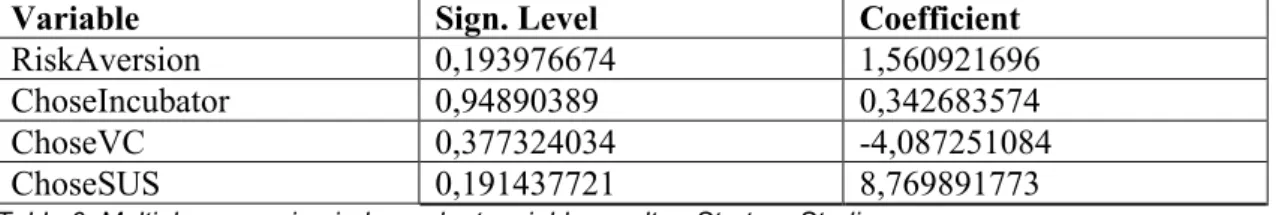
4.2.1 d) – An individual’s risk aversion influences his perception of what is a fair equity payment to a start-up studio.
We now move on to our last hypothesis which concerns the Start-Up Studios. The regression for this incubation mechanism was not significant. With a p-value of 0,2560 this regression is above the 10% confidence interval, meaning that it is not able to accurately predict the fair equity payment % to Start-up Studios.
Because of this we must reject our last hypothesis.
You can find more information relating to the other variables in Table 6.
Variable Sign. Level Coefficient
RiskAversion 0,193976674 1,560921696
ChoseIncubator 0,94890389 0,342683574
ChoseVC 0,377324034 -4,087251084
ChoseSUS 0,191437721 8,769891773
Table 6: Multiple regression independent variable results - Start-up Studio
4.2.2 Hypothesis 2: Chi-square test – There is a significant difference between the
choices of incubator of risk averse individuals when compared to that of risk averse
individuals
This hypothesis tries to establish a connection between two variables obtained through our survey: Risk Aversion and Choice of Incubator. We want to analyse the effect of Risk Aversion on Choice of Incubator, which means that the first is our independent variable and the latter our dependent variable. When looking at our dependent variable it is a categorical variable. For this reason, we chose to use the Chi-Square test to test this hypothesis. This is a non-parametric test which does not require equality of variances among the groups or homoscedasticity of the data. More importantly, it allows for the analysis of dummy variables.
Our independent variable, Risk Aversion, is a continuous variable. However, in order to perform the Chi-Square test, it was transformed into a categorical one: Risk
Aversion_Group. The scale of the original variable goes from 0 to 10, where 0 is the lowest level of Risk Aversion, 5 corresponds to Risk Neutrality and 10 to the highest level of Risk Aversion. We divided the respondents in two groups: Risk Propense if they reported a score equal or lower to 5, and Risk Averse if they reported a value higher than 5. The value 5, corresponding to Risk Neutrality was included in the risk propense group given the skewness of the distribution. One of the assumptions of the test is that no combination of those to variables has a frequency inferior to 5.
Similarly, to our Risk Aversion group, we also created a new variable for the Choice of Incubator variable. This variable original contained 4 possible choices (Accelerator, Incubator, VC and Start-up Studio) but one of assumptions of the Chi-Squared test was not
31 met given that some values of the Risk Propense Group’s choices did not reach the 5
answers. We divided the variable into 2 groups based on the level of support given to companies – Low or High – which was based upon the level of equity these mechanisms ask start-ups. As a consequence, Accelerators and Incubators were aggregated into the “Low” group and VCs and Start-up Studios into the “High” group.
Our analysis revealed that the differences in the number of choices of low and high support incubators by risk averse and risk propense individuals was not significant. In fact, the Chi-square statistic with one degree of freedom is 70,97%, which equals the probability of these results being due to randomness.
We must therefore reject this hypothesis.
4.2.3 Hypothesis 3: Chi-square test – Individuals who have a higher risk aversion are
more likely to have participated in an incubation program
In this analysis we will use two variables: Risk Aversion and Participated in Support Program – a dummy variable which indicates if an individual has participated in a start-up competition or an incubation program.
We should firstly assess if whether or not the sample should be filtered. Given the nature of one of the variables, Participated in Support Program, it is relevant to understand whether or not individuals who are considering starting a business but have not done it yet should be removed from the sample. We have chosen not to do it given that it is seems plausible that individuals who are considering starting a business but have not done it yet want to participate in ideation or other type of support programs. Our data support this assumption: approximately 56% of the individuals who are considering starting a business have participated in a Support Program of some type.
In this hypothesis we are looking to study whether or not there is an effect of risk aversion on the participation in support programs. For this reason, our independent variable will be the Risk Aversion while our Participated in Support Program will be our dependent variable. Given that our dependent variable is once again categorical we will test this hypothesis using the Chi-square test. In order to this we will use the same transformation of the variable Risk Aversion as we did in the last hypothesis, which means that our
independent variable will be Risk Aversion_Group.
Looking at the data we can see that one of the conditions to perform a Chi-Square test which is that none of the values has a frequency lower than five, is confirmed. Similarly, to the previous hypothesis the results of this test were not significant having a Chi-square statistic score of 0,6657 with one degree of freedom. This means that there is a 66.57% probability that the difference of values between the participation Support programs by risk averse and risk propense individuals is due to randomness.
32
5. Conclusions and limitations
This final chapter will present the main conclusions gather from our research, what are its implications and suggestions for future research.
5.1 Main findings & conclusions
Different incubation mechanisms offer different levels and types of support and involvement. Because of this having access to that support has different costs. When balancing these two, it was our assumption that the entrepreneur’s relationship with risk would be a significant factor in choosing certain incubation mechanisms versus others.
Based on our research of other papers and studies, we elaborated 3 research questions which would allows to evaluate this to some degree:
RQ1: Is there a relationship between risk aversion and the perceived value of
incubator mechanisms?
RQ2: Does risk aversion influence the entrepreneur’s choice of incubation
mechanism?
RQ3: Does risk aversion affect the decision to participate in an entrepreneurship
support program?
Primary data was then collected through an online survey that allowed us to get access to the variables with which we tested those research questions. These variables included a measure of risk aversion, a variable relating to the participation in different types of incubation and ideation programs, a hypothetical choice of one type of incubator and a estimation of the fair value of the support given by the different incubation mechanisms to the start-ups.
RQ1: Is there a relationship between risk aversion and the perceived value of incubator
mechanisms?
The answer to this question depends on the scope used.
If we are looking to understand this relationship on an individual mechanism, then it might be possible. As we saw on our research, risk aversion was able to significantly predict a part of the entrepreneur’s perception on what is a fair equity take by an Accelerator
mechanism. With this mechanism, we verified that the increase in 1 unit of risk aversion will result in a decrease of 0,81% on the value of the equity take, which explains
33 Nonetheless, our results don’t allow us to conclude that a relationship between risk aversion and the entrepreneur’s perception on the fair value of equity an incubation
mechanism should receive can be established for the variables on a general context.
RQ2: Does risk aversion influence the entrepreneur’s choice of incubation mechanism? Being risk averse does not seem to have an impact on what incubation mechanism an entrepreneur is more likely to choose.
The results of our Chi-square test were not significant in determining that the difference of the choices of low and high support incubators by risk propense and risk averse individuals was not significant.
RQ3: Does risk aversion affect the decision to participate in an entrepreneurship support
program?
Once again, our results on this question were not significant. We found no evidence supporting the effect of risk aversion in the Participation on Support Programs.
Taking into consideration the results obtained through this research it is clear that little to no evidence was found that supports the effect of risk aversion on the perception of the value and support of incubators.
5.2 Managerial/Academic implications
This dissertation aimed at exploring a relationship that according to our findings of previous research is still very scarcely studied. Having a clearer perspective on this topic could allow the leaders of incubation mechanisms to have a clearer notion of their target respondents and what they are looking for, which in turn could help them provide their tenants with a better service. It is important to develop the entrepreneurial ecosystem in order to foster economic development (Gauthier, Penzel, & Marmer, 2017) and research on this topic could potentially help to improve the entrepreneurial ecosystem.
In terms of Managerial Implications, by comparing Startup Studios with other incubation mechanisms we found that less people were inclined to choose their support. These mechanisms were chosen by 7 people which corresponds to exactly half of the choices of incubators the second least chosen incubation model. To some degree this is understandable given that this it is still a fairly recent incubation mechanism (Rao, 2013). However, some effort could be done in order to better promote this incubation model along a target audience that could place a greater value on the unique features of this model. A potential example could be adult individuals who are currently employed and who cannot afford to not receive payment for a period of time in order to develop their start-up. These individuals could see the more managerial role that they are able to have on a Start-up studio while still receiving a remuneration as a attractive opportunity. More research would have to be done in order to understand who this optimal target would be.