Tell Me What You Study, And I’ll Tell You
What Your Risk Profile Is
Evidence on Financial, Career and Educational Risk Domains
Madalena Costa Ferreira Lavrador Jacinto
Supervisor: Prof. Pedro Raposo
Dissertation submitted in partial fulfilment of requirements for the degree of MSc in Economics, at the Universidade Católica Portuguesa, March 2014.
i
ABSTRACT
The aim of this dissertation is to study the association between studying in business schools and students’ risk profiles, especially in the financial, career and educational risk domains. Based on Ding, Hartog and Sun’s (2010) survey to measure risk attitudes and using a sample divided into (i) people that study or have studied business or economics in the university (treated group) and (ii) those who have not studied business or economics, but that had considered taking a business or economics university degree (control group), I present results regarding financial literacy and its role in determining financial risk among business students. In addition to that, I also present results regarding career and educational risk and argue these are influenced by a business school organizational culture and competitiveness.
I show that people who attend or have attended a business school are more likely to be more risk averse and more risk loving, i.e. less likely to be risk neutral, than non business students in the career domain, at a significance level of 1% and 10%, respectively. Moreover, I show that business and economics students are less likely to be risk averse in the financial domain at a 10% significance level. Finally, when introducing financial literacy as a moderator in the analysis, I demonstrate that a person that has both studied in a business school and has a high literacy level is more likely to be both risk averse or risk loving than a person that has not studied in a business school and/or has low literacy level, at a significance level of 1%. These results have several policy implications with regards to the functioning of financ ial markets, as well as to entrepreneurship and its importance to economic growth.
ii
ACKNOWLEDGMENTS
First of all, I would like to show my gratitude to Professor Pedro Raposo and Cláudia Niza , for their excellence guidance, patience, motivation and inspiration throughout the last months, which were determinant for the success of my research project. A special thanks to Professor Teresa Lloyd-Braga for always being available to help me gain the extra strength I needed in order to succeed in my dissertation and in my MSc in general, and to Professor Catarina Reis, for introducing me to the topic of risk, and who taught me about risk theories, which were my motivation to start working on this subject.
Finally, I would like to thank my parents, my brother and my friends for their unconditional love, friendship and support during the last months. A special thanks goes to Mafalda Trincão, my “thesis buddy”, and to the long hours we have spent together writing our dissertations, which made these last months so much easier.
iii
TABLE OF CONTENTS
ABSTRACT... i ACKNOWLEDGMENTS ... ii 1. INTRODUCTION ... 1 2. LITERATURE REVIEW ... 3Risk Research - What Determines One’s Risk Profile? ... 3
Education Research - Effects of Studying Business or Economics ... 4
Financial Literacy ... 5
3. METHODOLOGY AND DATA COLLECTION ... 7
Measure Attitudes Towards Risk ... 7
Measure Financial Literacy... 9
Education Choices and Demographics ... 10
4. RESULTS - MAIN EFFECTS ... 12
Sample Characteristics ... 12
Age and Gender Analysis ... 12
Risk Analysis Across the Financial, Career and Educational Doma ins ... 13
5. RESULTS - FINANCIAL LITERACY ... 19
Do Business Students Really Have a Higher Degree of Financial Literacy? ... 19
Financial Literacy as a Moderator ... 20
6. SENSITIVITY ANALYSIS ... 22
What if the Sample Was Not Restricted? ... 22
Cognitive Ability - Are People in Both Groups Really the Same Before Their Studies? ... 24
7. DISCUSSION ... 27
Financial Literacy and Financial Risk... 27
Career Risk ... 28
8. CONCLUSION ... 29
BIBLIOGRAPHY... 31
APPENDICES... 33
Appendix A: Results - Sample Characteristics ... 33
Appendix B: Results - Risk Across Different Domains ... 34
1
1.
INTRODUCTION
The effects of education in individuals’ characteristics have been and continue to be broadly studied, namely the effect of having an education in business or economics. Not only the years of education have several implications in terms of behaviour, but also the area of education seems to have a role in influencing behaviours as well (Christiansen, Joensen and Rangvid, 2008; Kirchgässner, 2005; Ding, Hartog and Sun; 2010; Dohmen et al., 2005; Halek and Eisenhauer, 2001).1
Business schools have several characteristics that distinguish themselves from other schools. While attending an economics or business university program, students take courses in which they learn specific methodologies, such as mathematical, statistical, financial and economic models and functions. In other words, students are more exposed to financial education, which is expected to increase their financial literacy, making students more aware of the functioning of financial markets and of its movements, as well as more self conscious about the risk of participation in financial markets. This deeper understanding of financial theories and markets is likely to influence students’ characteristics, namely their attitude towards risk in the financial domain.
Another very specific characteristic from business schools is its organisational culture. Driven by the competiveness among business schools, business schools tend to offer more services related to career help and students therefore tend to be better prepared for networking and tend to enrol in different career prospect activities. In addition to that, due to the competitiveness among business schools, each school wants to be ranked higher each year and increase the level of job placement of their students, involving students in this competitiveness. Finally, the increasing importance of entrepreneurship in business schools is also likely to get students interested and involved in the topic. This specific culture is likely to affect the students’ characteristics and behaviours, namely behaviours towards risk in the career and educational domains.
The current literature that studies the impact of education in risk attitudes focuses on years of education rather than on the area of education. This dissertation aims to study the link between the area of education and risk attitudes, focusing on business schools and on its role in impacting financial, career and educational risk attitudes. The leading hypothesis in this dissertation is that studying in a business school is related to higher financial literacy and, thus, influences the students’ behaviours in terms of financial risk. Secondly, another hypothesis is that a business school organizational culture and the competitiveness
1
2 that exists among business schools and their students is likely to influence people’s risk attitudes in the career and educational domains.
After collecting data on risk attitudes, educational choices and demographics of 179 people, I examined the association between studying in a business school and risk attitudes, based on Ding, Hartog and Sun’s survey (2010). Chapter 4 and 5 present the main results obtained through several statistical and regression analyses made. Moreover, after undertaking a sensitivity analysis (Chapter 6) using educational choices and cognitive ability as variables, I then discuss the main results (Chapter 7) and present my conclusions (Chapter 8). I have found that business and economics students that have a high degree of financial literacy are likely to be more extreme in what concerns their attitude towards financial risk. In addition to this, I have also concluded that business students are likely to be more extreme in the career risk domain. Data shows no evidence of a relationship between attending a business school and attitudes towards educational risk. However, and despite the fact that the main findings in the literature regarding risk research are confirmed 1, the limited number of observations may lead to the fact that the results obtained may not be generalized.
1
3
2.
LITERATURE REVIEW
In order to draw conclusions regarding the impact of studying business or economics in an individual’s risk profile, it is important to conduct literature research in three areas of study: risk, education and financial literacy.
Risk Research - What Determines One’s Risk Profile?
Risk aversion can be defined as the utility of the expected value of a risky lottery being larger than the expected value of the utility of the risky lottery, i.e. a risk averse individual will always prefer to receive the expected value of a risky lottery for sure than to participate in that same risky lottery (Mas-Colell, Whinston and Green, 1995). Furthermore, risk aversion can also be defined as the certainty equivalent1 being greater than the expected value of a lottery or as the probability premium2 being positive. Several authors have studied the impact of demographic characteristics in the risk profile of the individuals. The main determinants of different attitudes towards risk found in the literature are regarding gender, age education and income.
Regarding gender, the literature is overall consensual: women are significantly more risk averse than men (Ding, Hartog and Sun; 2010; Dohmen et al., 2005; Halek and Eisenhauer, 2001; Jianakoplos and Bernasek, 1998).
On the contrary, one can find some discrepancies in the literature regarding results on the impact of age in the risk profile. According to Dohmen et al. (2005), risk aversion increases with age. However, Halek and Eisenhauer (2001) conclude that being 65 or older significantly increases one’s risk aversion, while until that age risk aversion decreases as people get older, i.e. they observe an U-shaped risk profile.
Furthermore, some conclusions regarding the impact of education in the risk profile have been taken, however these conclusions are more commonly related to the years of education rather than with the field of education. Ding, Hartog and Sun (2010) observe that students from humanities are less risk averse than students from technical areas. However, in their analysis they don’t explore what the reason for this difference is likely to be. Halek and Eisenhauer (2001) conclude that risk aversion increases with the years of education, although this result is not very significant. Dohmen et al. (2005) relate risk attitudes with parental education, concluding that risk aversion decreases with parental education.
1
The certainty equivalent can be defined as “the amount of money for which the indiv idual is indifferent between the gamble F(.) and the certain a mount c(F,u); that is: ” (Mas-Colell, Whinston and Green, 1995, page 186).
2
The probability pre miu m is, according to Mas -Colell, Whinston and Green (1995, page 186), “the e xcess in winning probability over fa ir odds that ma kes the individual indifferent between the certain outcome and a ga mble between two outcomes.
4 Concerning the relationship between income and risk profile, there are also several results in the literature. While Ding, Hartog and Sun (2010) conclude that risk aversion declines as family income increases, Halek and Eisenhauer (2001) observe that risk aversion increases with wealth, however, “at sufficiently high levels of assets, [i.e. wealth], the percentage change in risk aversion becomes negative”.
There are also some studies regarding the relationship between entrepreneuship and risk profiles. Most of studies agree that having a risk loving behavior increases the likelihood of successful entrepreneuship (Cramer et al., 2002; Van Praag and Cramer, 2001; Hartog and Ferrer-i-Carbonell, 2002).
Another widely studied area in what concerns risk behaviours is the effect of cognitive ability in each individual’s risk profile. In the literature, the majority of the authors agree that the higher the cognitive ability, the higher the risk propensity (Dohmen, Falk et al., 2007). More specifically, some authors relate cognitive ability to the likelihood of holding stocks, concluding that the higher the cognit ive ability, the higher the propensity to invest in financial markets and, thus, the lower the risk aversion (Van Rooij, Lusardi and Alessie, 2007; Christelis, Jappelli and Padula, 2008). Another study conducted by Oechssler, Roider and Schmitz (2009) conc ludes that individuals with higher cognitivy ability are more likely to show risk neutrality.
Despite these relationships, Halek and Eisenhauer (2001) alert to the fact that some of the results may not mean that there is a causality relationship between the demographic measures and the risk profile. They give as an example the relationship between being married and attitude towards risk: “it may be argued that marriage increases one’s risk aversion, but it may also be argued that more risk-averse individuals choose to marry” (Halek and Eisenhauer, 2001, page 10). Taking this into consideration, they conclude that the results they show in their study about the non-emigrants, the self employed and the married people (as well as other non-significant variables) should not be interpreted as a cause-effect relationship between personal and risk characteristics.
Education Research - Effects of Studying Business or Economics
Many authors have conducted research concerning the role that the area of education has in several personal characteristics, and more specifically about the impact that study ing business or economics may have in several behaviours.
Economists tend to be influenced by the economic models they learn, and their perception of market mechanisms changes accordingly (Kirchgässner, 2005; Carter and Irons, 1991). In fact, given that “economists are more exposed to economics curricula during their study” (Christiansen, Joensen and Rangvid, 2008, page 12), their choices and preferences tend to be affected by the economics models they
5 learn. An example of an area that is influenced by the study of economics is the financial area, more specifically the decision of holding stocks or not. According to Christiansen, Joensen and Rangvid (2008), economists tend hold more stocks than non-economists, due to the informational advantage derived from studying finance in more depth than other degrees. The effect of the deeper study of finance will be further developed later on.
Moreover, another difference between economists and non-economists was studied by Frank, Gilovich and Regan (1993), who have developed several experiments in order to understand whether economists are more self interested than others. After conducting the bargaining ultimatum game and testing the prisoner dilemma, among other experiments, they concluded that economists are, in fact, more self interested than others. The same conclusion was drawn by Carter and Irons (1991), who state that free riding was higher among economics students than among students from other areas.
An issue that divides economists in what concerns the role of the education area in the aforementioned topics is whether if it is the study itself that changes the behaviour of the individuals or if economists have different characteristics even before their studies in the university that influence their choices, preferences and/or perceptions. According to Carter and Irons (1991) and based on the results gotten by applying the bargaining ultimatum game to economics students, they conclude that economists are already different a
priori before they start their studies, and they find no evidence that this difference widens with economic
training. On the other hand, both Christiansen, Joensen and Rangvid (2008) and Frank, Gilovich and Regan (1993) conclude that the likelihood of holding stocks and the self interested characteristics respectively increase with the years of education in economics.
Financial Literacy
Overall, authors that conduct research in the financial literacy area agree that there is a low degree of financial literacy and sophistication among the population (Lusardi and Mitchell, 2007; Mandell and Klein, 2009; Van Rooij, Lusardi and Alessie, 2007) 1. Among the less financial literate are women (Chen and Volpe, 1998; Mandell and Klein, 2009; Lusardi and Mitchell, 2011), people with a lower degree of education, African-American and Hispanics (Mandell and Klein, 2009; Lusardi and Mitchell, 2011), people in non-business majors, students in lower class ranks, people aged under 30 years old and people with little work experience (Chen and Volpe, 1998).
Financial literacy has an impact in people’s behaviours in what concerns investment and savings decisions, namely regarding retirement planning and stock market participation. Several studies conclude
1
6 that high financially literate people are more likely to be have a higher and more responsible retirement planning than people who have a lower financial knowledge (Lusardi and Mitchell, 2007; Lusardi and Mitchell, 2010; Lusardi, 2008; Lusardi and Mitchell, 2011; Cole and Shastry 2009). Other authors have shown that financial literacy is not only likely to increase stock market participation (Van Rooij, Lusardi and Alessie, 2007; Cole and Shastry, 2009), but also that more financially literate people are more likely to diversify their portfolios more efficiently, choose financial products that yield better returns (Cole and Shastry, 2009) and make overall better investment decisions (Chen and Volpe, 1998).
Retirement planning and stock market participation have great implications in the financial system. It helps asset acumulation and consumption smoothing, it influences the volatility and yields of financial markets and has an impact in financial regulation as well (Cole and Shastry, 2 009). Thus, it is important to understand if education is likely to have a significant impact in increasing financial literacy. According to the literature, financial literacy programs offered during high school are not likely to have a significant impact in the students’ financial literacy level (Mandell and Klein, 2009; Cole and Shastry, 2009). However, financial programs offered by companies to their employees with the purpose of increasing financial literacy tend to be efficient (Lusardi, 2008). Finally, while high school programs do not seem to be effective, financial education offered in the universities is associated with a significant increase in financial literacy (Cole and Shastry, 2009).
7
3.
METHODOLOGY AND DATA COLLECTION
The main goal of this research is to understand and analyze the role that attending a business school may have in terms of affecting the students’ risk attitudes in the financial, career and educational domains. In order to do so, it is important to gather data taking into consideration three different objectives:
(1) Measure attitudes towards risk (2) Measure financial literacy
(3) Education choices and demographics
So that one can accurately measure the influence of business schools in the attitude towards risk of people attending them, one needs to compare data of two different groups: the treated group, i.e. people that attend/attended business schools, and the control group, i.e., people that do not/did not attend business schools, but that had considered taking a business or economics degree while still studying at high school. It is important that the control group only includes people with these characteristics, because, in order for the groups to be comparable and accurate conclusions to be drawn, both groups need to have similar characteristics before they attend the university. More about the importance of these characteristics will be further developed later on.
Taking this restriction into consideration, a survey was conducted in order to collect information regarding the three aforementioned objectives. The survey was available on social networks for two months, from June 2013 to August 2013, and got 179 respondents. The collected sample was thus a convenient and non probabilistic sample. Details about each of the survey sections are presented below, including explanations about why each part is important for the development of the research.
Measure Attitudes Towards Risk
The first part of the survey, aimed to measure individuals’ attitudes towards risk, is based on a survey already used by other authors, with the same purpose (Ding, Hartog and Sun, 2010). It consists of two different games. In each game, participants are required to make decisions regarding hypothetical lotteries, which are supposed to reveal their preferences regarding risk. Moreover, participants are asked to self-evaluate themselves regarding their willingness to take risks in several domains. Details regarding each of the questions are explained in the next paragraphs.
8
Question 1 (Q1)
Suppose in a lottery game, the possibility to win 100€ is 10%, then how much would you pay at most to buy a lottery ticket?
The question is adapted from Ding, Hartog and Sun (2010), where the values are given in Yuan. In order to use the question in this research, a conversion to Euro is done, taking into consideration the exchange rate Yuan-Euro in June 2008 (date of data collection of their survey). The exchange rate on this date was 1 Euro = 0.1 Yuan.
The value answered by each participant is called Reservation Price (RPrice). Given that the expected value of the purposed lottery is 10€, the following conclusions can be drawn:
- If RPrice<10€, then the participant is risk averse. - If RPrice=10€, then the participant is risk neutral. - If RPrice>10€, then the participant is risk loving.
Furthermore, the lower the value the participant is willing to pay, the more risk averse he or she is.
Question 2 (Q2)
Now the conditions of the choice change. Suppose you are offered 10€ in cash. Instead, however, you may choose a lottery ticket. The lottery has a price of 200€, but the probability to win has not yet been determined. I want you to think about different probabilities to win the prize of 200€. How high should this probability be at least for you to take the lottery ticket rather than the 10€ in cash?
This question is adapted from the same study as the previous one and, again, the exchange rate Yuan-Euro of June 2008 is used for the conversion.
The probability answered by each participant is called Reservation Probability (RProb). Given that the probability that equals the expected value of the lottery to the 10€ is 5%, the following conclusions can be taken:
- If RProb>5%, then the participant is risk averse. - If RProb=5%, then the participant is risk neutral. - If RProb<5%, then the participant is risk loving.
9
Question 3 (Q3)
How do you see yourself?: Are you in general a person who takes risk s or do you try to evade them? Please self-grade your choice in the following domains, answering in a scale from 1 to 7, in which 1 means “I don’t like to take risks at all” and 7 means ”I really like to take risks”:
Q3.A: Finance Q3.B: Leisure Q3.C: Career Q3.D: Health Q3.E: Education
Again, the question is taken from the survey conducted by Ding, Hartog and Sun (2010). It is considered to be important to take into account these different domains, given that people tend to show different risk attitudes depending on the area they are deciding on. Despite having collected data for the five domains, only the results for the financial, career and educational domains will be taken into consideration in the analyses presented in the following chapters. This has to do with the hypotheses that are in Chapter 1, that state that attending a business school might have an impact in the financial, career and/or educational domains.
The levels of risk attitudes obtained in the survey are then used as dependent variables in the regressions that are presented in the next chapters. It makes sense to use the results obtained in each of the questions individually, because, as it was concluded by Ding, Hartog and Sun (2010) , risk attitudes differ according to framing and situation, and, thus, it would not be accurate to calculate an overall measure of risk for each person.
Measure Financial Literacy
One possible explanation for differences between business schools’ students and other students might be their financial literacy level. The second section of the survey includes four questions and is dedicated to test the participants’ knowledge of statistics, calculus and finance. The questions are taken from the Berlin Numeracy Test (Cokely, Galesic et al., 2012) and from the questionnaire done for the Health and Retirement Study, from University of Michigan, and have different levels of difficulty:
10
1. If you deposit 1,000€ in a bank account and five years later have 1,500€, what was the interest rate applied to this deposit?
Given that it is not specified what kind of interest rate it was being applied to the deposit, three different answers are considered to be correct: 10% (simple interest rate), 8,45% (compound interest rate) and 50% (cumulative interest rate).
2. If you deposit 1,000€ in a bank account with an interest rate of 5% p.a., how much will you have after three years?
Again, since it is not clear which kind of deposit this is, there may be two right answers to this question: 1,150€ (simple interest rate) and 1,157.6€ (compound interest rate).
3. A pill cures 15% of people who have a disease. If 1,000 people have the disease and they all take the pill, how many people will be cured?
Right answer: 150 people .
4. Imagine you are throwing a five-sided die 50 times. On average, out of these 50 throws how many times would this five-sided die show an odd number (1, 3 or 5)?
Right answer: 30 times.
Education Choices and Demographics
The third part of the survey has two very important aims: to separate people in two different groups (treated vs. control group) and to collect demographic data, namely regarding age and gender of the participants, in order to compare the results with literature that studies the determinants of risk attitude. In order to determine which people belong to each group, the following questions are needed:
1. During high school, in what degree did you consider studying in the following areas in the university? Please answer in a scale from 1 to 7, in which 1 means “didn’t consider it at all” and 7 means ”I really considered it”.
a) Law b) Economics c) Engineering
d) Business Administration
Only participants that answer at least 5 in economics or business administration in this question will be considered in the data analyses, given that it guarantees that all the participants were at least similar before the university.
11
2. What do you study?/what have you studied? a) Arts
b) Political Sciences/International Relations c) Social Communication d) Law e) Economics f) Business Administration g) Psychology h) Health Sciences i) Sociology j) Other. What?
The answer to this question determines which group each of the people will belong to. If the person answers either economics or business administration, he or she will belong to the treated group. If, on the other hand, the participant answers any of the other options, he or she will belong to the control group. As for the demographic questions, they consist in asking the gender and age to participants. This information will be used to confirm the results obtained in the survey, i.e. to see if results obtained in this survey regarding gender and age are consistent with the results obtained in the research analyzed in the literature review. If the results don’t match, then it is probable that the results obtained in the survey are not consistent, which may lead to wrong results.
12
4.
RESULTS - MAIN EFFECTS
Having in mind the hypotheses stated in Chapter 1, I conducted several analyses in order to understand if there is a relation between studying business and economics and the attitudes towards risk in the financial, career and educational, which are developed in Chapters 4 and 5. These analyses include frequency distribution analysis, descriptive statistic analysis and regression analyses.
Sample Characteristics
Overall 179 people answered the survey, however 28 of them were excluded from the analyses, because they are not attending/have not attended the university. From the remaining 151 respondents, only 93 have considered studying business and/or economics during high school and, therefore, only these will be considered in the first part of the analysis. The 93 respondents have been divided into two groups: treated
group - people who have studied/are studying business or economics, i.e. have attended or are attending a
business school, and control group - people who have studied or are studying in other areas. Table 1 below summarizes the sample distribution.
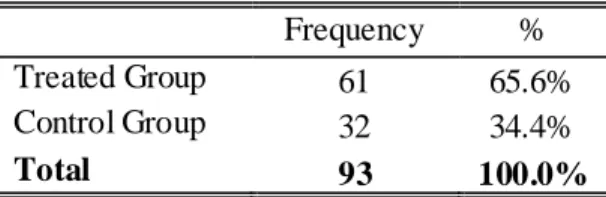
Table 1 - Group Distribution
Frequency %
Treated Group 61 65.6%
Control Group 32 34.4%
Total 93 100.0%
As for age distribution, there is a skew in the sample for people aged 30 or less, as c. 82.0% of the respondents (c. 86.9% in the treated group and c. 68.8% in the control group) are less than 30 years old (see Figure A.1 in Appendix A). In what concerns gender, the sample is equally distributed between female and male respondents (see Figure A.2 in Appendix A). Most people in the control group study/have studied engineering (c. 25.0%), psychology (c. 15.6%), law (c. 12.5%) and mathematics (c. 12.5%), while in the treated group the sample is equally distributed between the two study areas (business administration and economics) (see Tables A.3 and A.4 in Appendix A).
Age and Gender Analysis
One of the ways to understand if the results obtained in the survey are reliable is to compare them with popular results in the literature in what concerns risk profiles related to each person’s age and gender. This was done through a logistic multinomial model using as independent variables age and gender (see Equation 1).
13 , [1
]
Tables 2 below summarizes the conclusions that can be drawn through the regression in Equation 1. Table 2 - Age and Gender Logistic M ultinomial Regression Results
Reservation Price Reservation Probability Finance Domain Career Domain Education Domain (1) (2) (1) (2) (1) (2) (1) (2) (1) (2) Age 0.01 (0.03) 0.02 (0.04) -0.02 (0.03) 0.02 (0.78) -0.01 (0.03) -0.02 (0.04) 0.02 (0.04) 0.04 (0.03) 0.23*** (0.09) 0.23*** (0.09) Gender 0.40 (0.47) 1.13 (0.79) -0.18 (0.65) 0.92 (1.31) 0.23 (0.61) -16.78*** (0.64) -0.24 (0.61) -0.97* (0.56) -0.48 (0.58) -0.15 (0.81)
Number of observations: 93. (1) refers to the risk averse outcome; (2) refers to the risk loving outcome; base outcome: risk neutral.
*** p<0.01, ** p<0.05, *p<0.10. Robust standard errors in parenthesis.
Regarding age, the only variable that shows a statistically sign ificance is the educational domain. By looking at Table 2, one can conclude that the higher the participant’s age is, the higher the likelihood of he/she being more risk averse or risk loving regarding educational risk. In other words, the older a person is, the higher is the likelihood of having a more extreme behaviour towards educational risk, i.e. the higher the likelihood of either being willing to take a lot of risks or not being willing to take any risks at all. Since there is a large skew in the sample for people aged less than 30 years, it is important to include the variable age as a control variable in all regression analyses presented in this dissertation.
Regarding gender, one can find statistically significant conclusions for the finance domain and as well as for the career domain, which are consistent with the literature: men are more likely to be risk loving than women1. The fact that there is a statistically significant difference in some of the domains leads to the conclusion that gender should also be used as a control variables in all models used to draw conclusions throughout this dissertation.
Risk Analysis Across the Financial, Career and Educational Domains
Domain specificity in risk attitudes leads to different interpretations and results across measures, which is why it is important to analyze each domain separately2.
1
Ding, Ha rtog and Sun (2010), Dohmen et a l. (2005), Ha le k and Eisenhauer (2001), Jianakoplos and Be rnasek (1998).
2
14 In the following subsections, three analyses will be done: frequency distribution analysis, descriptive statistics analysis and regression analysis.
Frequency distribution analysis
The frequency distribution analysis, whose details can be found in Appendix B, shows that there is heterogeneity in all risk measures for both treated and control groups, as the mode in each distribution is less than 40% (less than 30% for most measures).
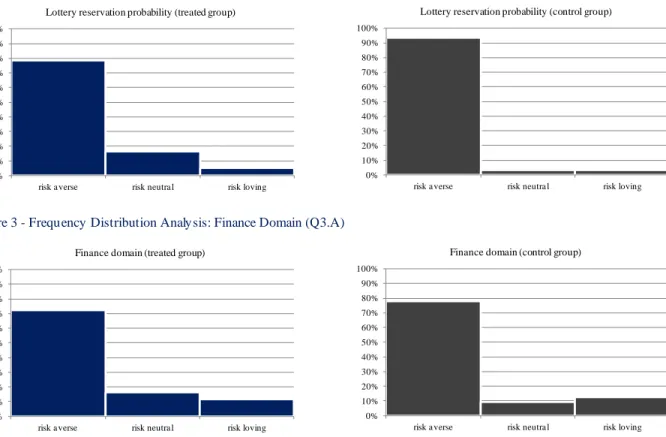
The first three questions of the survey (Q1, Q2 and Q3.A) are aimed to measure financial risk. For the first finance measure, the Reservation Price, as measured in Q1, the lower the value answered by each respondent, the higher their degree of risk aversion. The same interpretation applies to the third question (Q3.A), the self evaluation finance measure. As for the second measure, the Reservation Probability, as measured in Q2, the higher the value answered, the higher the degree of risk aversion. Through the frequency distribution analysis of the variables aimed to measure financial risk, one can conclude that the majority of the respondents of both groups shows risk aversion. However, by analyzing Figures 1, 2 and 3 below, one can conclude that, despite the fact that the distribution is quite similar among the two groups for the first and third measures (Q1 and Q3.A), for the second measure (Q2) the proportion of risk averse people in the control group is higher than in the treated group (93.8% vs. 78.7% in the control and in the treated group, respectively). The regression analyses presented later on will allow to understand if this difference in proportions between treated and control groups is statistically significant.
Figure 1 - Frequency Distribution Analysis: Lottery Reservation Price (Q1)
0% 10% 20% 30% 40% 50% 60% 70% 80% 90% 100%
risk a verse risk neutra l risk loving Lottery reservation price (treated group)
0% 10% 20% 30% 40% 50% 60% 70% 80% 90% 100%
risk a verse risk neutra l risk loving Lottery reservation price (control group)
15 Figure 2 - Frequency Distribution Analysis: Lottery Reservation Probability (Q2)
Figure 3 - Frequency Distribution Analysis: Finance Domain (Q3.A)
As for the self evaluation career question (Q3.C), the majority of sample is risk loving in what concerns its career decisions. However, as it can been seen in Figure 4 below, despite the fact that the proportion of risk lovers seems to be similar between both groups (49.2% vs. 50.0% in the treated and control groups, respectively), the treated group seems to have a higher percentage of risk averse people, while the control group seems to have a higher percentage of risk neutral people. The statistical significance of this difference will be analyzed later on in this chapter through the regression analysis.
Figure 4 - Frequency Distribution Analysis: Career Domain (Q3.C)
Finally, in what concerns education (Q3.E), the sample shows overall risk aversion in both groups. However, one can see through the frequency distribution that the treated group seems to be more risk
0% 10% 20% 30% 40% 50% 60% 70% 80% 90% 100%
risk a verse risk neutra l risk loving Lottery reservation probability (treated group)
0% 10% 20% 30% 40% 50% 60% 70% 80% 90% 100%
risk a verse risk neutra l risk loving Lottery reservation probability (control group)
0% 10% 20% 30% 40% 50% 60% 70% 80% 90% 100%
risk a verse risk neutra l risk loving Finance domain (treated group)
0% 10% 20% 30% 40% 50% 60% 70% 80% 90% 100%
risk a verse risk neutra l risk loving Finance domain (control group)
0% 10% 20% 30% 40% 50% 60% 70% 80% 90% 100%
risk a verse risk neutra l risk loving Career domain (treated group)
0% 10% 20% 30% 40% 50% 60% 70% 80% 90% 100%
risk a verse risk neutra l risk loving Career domain (control group)
16 averse than the control group, since more 15% of people in the treated group answered less than 4 in comparison to the control group. Again, in the regression analysis one will be able to understand whether this difference is statistically s ignificant or not.
Figure 5 - Frequency Distribution Analysis: Education Domain (Q3.E)
Descriptive statistics analysis
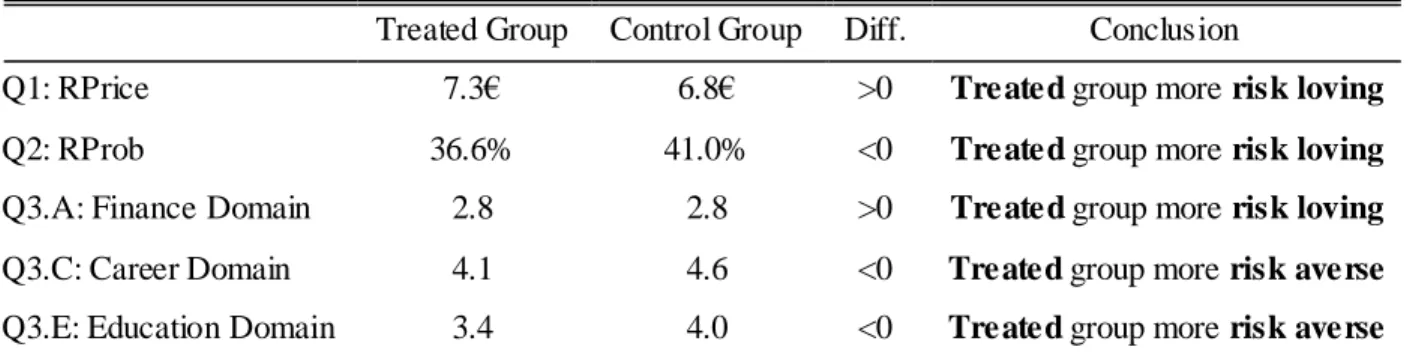
Table 3 below summarizes the average response in each question by group: Table 3 - Average Response by Group
Treated Group Control Group Diff. Conclusion
Q1: RPrice 7.3€ 6.8€ >0 Treated group more risk loving
Q2: RProb 36.6% 41.0% <0 Treated group more risk loving
Q3.A: Finance Domain 2.8 2.8 >0 Treated group more risk loving
Q3.C: Career Domain 4.1 4.6 <0 Treated group more risk averse
Q3.E: Education Domain 3.4 4.0 <0 Treated group more risk averse
Number of observations: 93.
Regarding Q1, a difference higher than zero means that a representative person of the treated group is willing to pay more to participate in the proposed lottery than the average person of the control group. As for the second question (Q2), the probability of winning a lottery would have to be smaller for a treated person than for a control person, so that he or she would be willing to participate in the lottery. The financial self evaluation question (Q3.A) shows that the people from the treated group rate themselves as more willing to take risks in the financial domain than the average of the people in the control group. All these three questions, aimed to measure financial risk, lead to the same conclusion: people who have attended/attend a business school have a greater financial risk propensity than the people who have not attended it. 0% 10% 20% 30% 40% 50% 60% 70% 80% 90% 100%
risk a verse risk neutra l risk loving Education domain (treated group)
0% 10% 20% 30% 40% 50% 60% 70% 80% 90% 100%
risk a verse risk neutra l risk loving Education domain (control group)
17 The descriptive statistics analysis of the career and education self evaluation questions reveals the same conclusions as the frequency distribution analysis: overall, people who have attended/attend a business school are more risk averse in the career and education domains.
Regression analysis
Equation 2 represents the first regression I use for all variables. After dividing the results obtained in each measure by risk averse, risk neutral and risk loving, I apply the logistic multinomial model, using robust standard errors and risk neutral as the base variable. Age and gender are used as control variables, and financial literacy is not included in the analysis yet1.
, [2
]
Table 4 below shows the regression results for the relevant risk measures, i.e. the three financial measures and the career and educational measures.
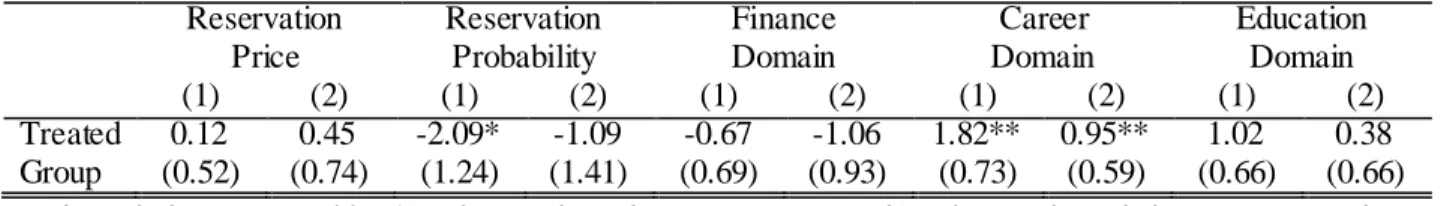
Table 4 - Logistic M ultinomial Regression Results (controlling for age and gender) Reservation Price Reservation Probability Finance Domain Career Domain Education Domain (1) (2) (1) (2) (1) (2) (1) (2) (1) (2) Treated Group 0.12 (0.52) 0.45 (0.74) -2.09* (1.24) -1.09 (1.41) -0.67 (0.69) -1.06 (0.93) 1.82** (0.73) 0.95** (0.59) 1.02 (0.66) 0.38 (0.66)
Number of observations: 93. (1) refers to the risk averse outcome; (2) refers to the risk loving outcome; base outcome: risk neutral.
*** p<0.01, ** p<0.05, *p<0.10. Robust standard errors in parenthesis.
The coefficients obtained through this regression analysis allow to compute the odds ratio, i.e. it allows to understand how many times more likely is it for a person in the treated group to be more risk averse (1) or more risk loving (2) than a person from the control group.
Example for Reservation probability, outcome (1): Odds ratio:
In the case of the variable Reservation Price, for example, one can conclude that it is 1.122 times more likely for a person that attended a business school to be more risk averse than a person that did not attend a business school.
1
18 By looking at the p-values, it is then possible to analyze the statistical significance of each of the odds ratios. At a significance level of 5%, one can find statistical significance in the career domain, for both outcomes. This means that a business student is significantly more likely to be both risk averse1 and risk loving2 than a non-business student. Allowing for a 10% significance level, one can also see a significant difference in the Reservation Probability variable, in this case meaning that a business student is significantly less likely to be risk averse3 than a non-business student.
These results indicate that people that have studied in a business school are more extreme in what concerns career risk, i.e. they are more likely to either don’t want to risk at all or to be willing to risk a lot in what concerns their career decisions. On the contrary, the results regarding the Reservation Probability variable, which is one of the measures of financial risk profile, reveal that business students have a higher propensity for risk neutrality when compared to the risk averse outcome, i.e. they show a less extreme risk profile in comparison to the non-business students. Regarding the educational doma in, there is no evidence of a significant relationship between attending a business school and the likelihood of having a different behavior towards educational risk.
1 times more likely to be risk averse. 2 times more likely to be risk loving. 3 times less likely to be risk averse.
19
5.
RESULTS - FINANCIAL LITERACY
As mentioned in Chapter 1, the leading hypothesis of this dissertation is that, due to the financial and statistical courses that students from business schools attend during their study programs, they tend to have a higher financial literacy when compared to students from other areas, and that this higher financial literacy leads to the fact that business students are likely to have a different financial risk profile than students from other areas. In the previous chapter, the effect of financial literacy is not taken into account when analyzing the financial risk profile of the participants. The aim of this chapter is to include this variable in the analysis and, thus, try to understand if financial literacy is a determinant of financial risk profile.
Do Business Students Really Have a Higher Degree of Financial Literacy?
With the purpose of understanding if the students’ financial risk profile is, in fact, related to their degree of financial literacy, the survey includes some questions that are aimed to test the statistical, financial and calculus knowledge of the participants. Given this, it is possible to understand if business and economics students have a significant higher knowledge in these topics than non-business and economics students. Equation 3 below represents the regression that was used to get results regarding these questions.
, [3]
The degree of financial literacy is measured based on the answers given by the survey participants to the four financial and statistical questions included in the survey. Given that the mean of number of right questions answered by the participants is approximately 3, the variable degree of financial literacy will be equal to 1 if the number of right answers is at least 3, and 0 otherwise.
By applying a logistic multinomial model, using robust standard errors, one can conclude that, at a significance level of 10%, business and economics students are 2.215 times more likely to have a higher financial literacy than non-business students1.
20 This result is not surprising and is consistent with the literature1, since the knowledge that business and economics students gain by taking these courses is expected to increase the likelihood of answering financial and statistical questions correctly, and therefore to increase their degree of financial literacy.
Financial Literacy as a Moderator
In order to understand which role financial literacy plays as a determinant of financial risk profile, I apply the same model as in Chapter 4, now including not only the degree of financial literacy as a variable in the model, but also using financial literacy as a moderator in the analysis2. Equation 4 represents the model used in the analysis:
, [4
]
This analysis is only done for the three variables that were aimed to measure financial risk, rather than using the career and educational risk variables as well. The rationale for this has to do with the hypothesis made in Chapter 1, which is that financial literacy would have an impact in the business students’ financial risk profile (and not in the career and educational risk profile). Table 5 summarizes the regression results:
Table 5 - Logistic M ultinomial Regression Results, With Financial Literacy (controlling for age and gender) Reservation Price Reservation Probability Finance Domain (1) (2) (1) (2) (1) (2) Treated Group -0.66 (1.01) -1.28 (1.43) -16.09*** (1.18) -32.53*** (1.43) 0.75 (1.30) 0.98 (1.79) Financial Literacy -1.00 (0.92) -1.84 (1.35) -15.71*** (1.10) -31.94*** (1.24) 1.25 (1.29) 1.23 (1.68) Moderator Effect 1.07 (1.13) 2.66 (1.87) 14.25*** (1.77) 47.81*** (2.04) -2.22 (1.72) -2.96 (2.19)
Number of observations: 93. (1) refers to the risk averse outcome; (2) refers to the risk loving outcome; base outcome: risk neutral.
*** p<0.01, ** p<0.05, *p<0.10. Robust standard errors in parenthesis.
1
Co le and Shastry, 2009
2
This analysis also includes robust standard errors, age and gender as control variables and risk neutral as the base outcome.
21 The interpretation of the coefficients is the same as in the previous chapter, and their sign determines whether it is more (+) or less (-) likely for a group to be risk averse or risk loving. For example, for the variable Reservation Price, it is 0.519 times less likely1 that a business student is more averse than a non-business student.
There are three main conclusions that can be drawn from Table 5: Firstly, business students per se, i.e. independently of having a high degree of financial literacy or not, are significantly less likely to be both risk averse and risk loving than non-business students. This result is apparently different from the result drawn in the previous chapter regarding the financial domain. However, one must keep in mind that, in the analysis from the previous chapter, the effects of financial literacy and its interactio n with being a business student or not are not taken into account. This means that, only when isolating the financial literacy and introducing a moderator effect in the regression, one is really able to understand what the isolated effect of studying business or economics is. Secondly, people with a high degree of financial literacy, independently of being business students or not, are also significantly less likely to be both risk averse and risk loving than people with a low degree of financial literacy. Finally, when letting attending a business school interact with the fact of having a high degree of financial literacy, one can conclude that a business student with a high degree of financial literacy is significantly more likely to be risk averse and risk loving than a person that has not studied in a business school and/or has a low literacy level. Despite the fact that the last conclusion is statistically s ignificant for both risk aversion and risk loving behaviours the result is stronger for the risk loving outcome, as one can conclude by looking the coefficient figures (14.25 for risk aversion vs. 47.81 for risk loving).
When looking at these results, it seems that just being a business student or just having a high literacy per
se makes it less likely for a person to have an extreme behaviour in what concerns taking financial risks.
On the contrary, a business student with a high financial literacy degree is more likely to be either very willing to take financial risks or not willing to take financial risks at all, i.e. he or she is less likely to have a neutral attitude towards financial risk.
22
6.
SENSITIVITY ANALYSIS
Despite the statistically significance of some of the results presented in the previous chapter, it is important to discuss whether the conclusions drawn concerning the relationship between risk profiles and area of studies are, in fact, reliable. Through the sensitivity analysis, one can try to understand what some changes in the assumptions and in the models would imply in terms of results.
What if the Sample Was Not Restricted?
In Chapters 4 and 5, it is decided not to include in the analyses participants that had not considered studying business and economics in high school, with the justification that people are different even before their studies. The purpose is for the sample to be as random as possible, so it is important only to use people in the analyses that are as similar from each other as possible, in order to isolate the effect of the study area in the risk profile of participants. However, is this really important to the analysis? Would the results be the same if the sample was not restricted?
The aim of this section is to replicate the regression analyses of Chapters 4 and 5 with no restriction in the sample, i.e. also including the observations of those who had not considered studying business and/or economics during high school. Thus, the sample consists now of 151 people, with 64 people (42.4%) belonging to the treated group and 87 people (57.6%) belonging to the control group.
Main effects
Table 6 below replicates the results shown in Table 4 (Chapter 4), now including also those people that had not considered studying business or economics during high school.
Table 6 - Logistic M ultinomial Regression Results (controlling for age and gender) Reservation Price Reservation Probability Finance Domain Career Domain Education Domain (1) (2) (1) (2) (1) (2) (1) (2) (1) (2) Treated Group -0.25 (0.46) 0.44 (0.62) -1.23* (0.65) 0.27 (0.76) -0.34 (0.50) -0.08 (0.92) 0.92** (0.52) 0.72 (0.48) 0.89* (0.48) 0.07 (0.50)
Number of observations: 151. (1) refers to the risk averse outcome; (2) refers to the risk loving outcome; base outcome: risk neutral.
*** p<0.01, ** p<0.05, *p<0.10. Robust standard errors in parenthesis.
As it can been seen by comparing the results shown above with Table 4 in Chapter 4, the results for the financial, career and educational domains are the same as the ones with the restriction in the sample. However, the variables Reservation Price and Reservation Probability provide opposite results from the ones shown in Chapter 4.
23 In conclusion, the restriction in the sample provides different results in what concerns risk profiles. Despite the fact that the non-restriction of the sample would provide more observations, given that the results are very different in some questions, it continues to be better to restrict the sample and guarantee that the participants are as similar as possible before their studies.
Financial literacy
Table 7 shows the results gotten by applying the same model as in Chapter 5, now without restricting the sample, i.e. including not only those who had considered studying business or economics during high school.
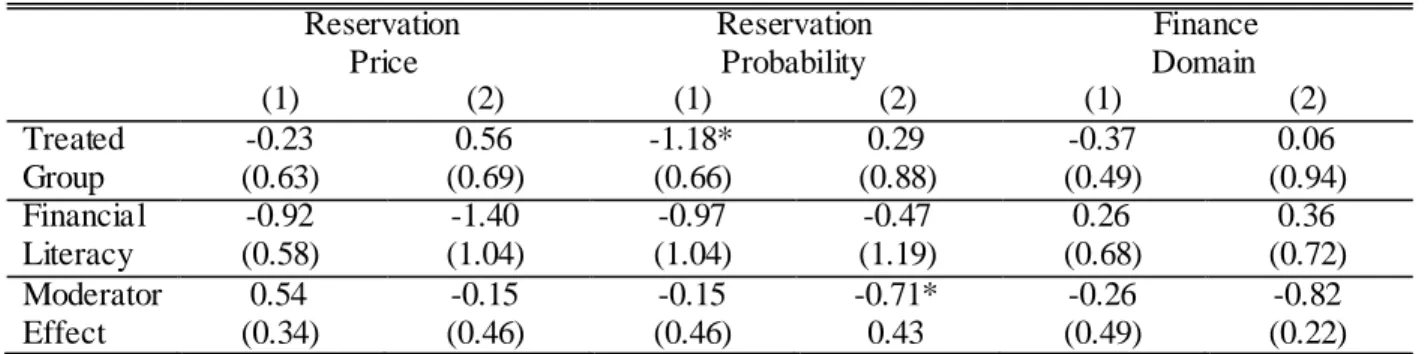
Table 7 - Logistic M ultinomial Regression Results, With Financial Literacy (controlling for age and gender) Reservation Price Reservation Probability Finance Domain (1) (2) (1) (2) (1) (2) Treated Group -0.23 (0.63) 0.56 (0.69) -1.18* (0.66) 0.29 (0.88) -0.37 (0.49) 0.06 (0.94) Financial Literacy -0.92 (0.58) -1.40 (1.04) -0.97 (1.04) -0.47 (1.19) 0.26 (0.68) 0.36 (0.72) Moderator Effect 0.54 (0.34) -0.15 (0.46) -0.15 (0.46) -0.71* 0.43 -0.26 (0.49) -0.82 (0.22)
Number of observations: 151. (1) refers to the risk averse outcome; (2) refers to the risk loving outcome; base outcome: risk neutral.
*** p<0.01, ** p<0.05, *p<0.10. Robust standard errors in parenthesis.
By comparing the results in the table above with the ones in Table 5 (Chapter 5), one can conclude that the results for the financial literacy regressor are the same for all dependent variables, however the results for the treated group and the moderator effect for some of the variables are different from the ones in Chapter 5. Thus, due to the difference in results between when restricting the sample to people that had considered studying business or economics during high school and when not restricting, it is still better to exclude from the financial literacy analysis those people that had not considered studying economics or business during high school.
In conclusion, both the results for the main effects and financial literacy presented in this section are different from the results presented in Chapters 4 and 5. In both cases, I conclude that it is better to exclude from the analysis those who had not considered studying business or economics during high school, since there could be a problem of sample selection if those people were considered in the analysis. The main idea behind this assumption, as already explained in Chapter 3, is that people may have already been different just for the fact of wanting or considering to study business or economics during high school. If the goal is to study the association between studying in business schools and students’ risk
24 profile, then it is important to consider just the effect of the study in economics or business itself, rather than to take into account the differences before the study.
Cognitive Ability - Are People in Both Groups Really the Same Before Their
Studies?
According to Carter and Irons (1991), economists may be already intrinsically different even before they start their studies, i.e. some of the different characteristics that can be found between economists and people that have studied in other areas (e.g.: economists show more free riding behaviour) are already different before entering the university, implying that education may not have impact in these characteristics. Thus, in order to avoid a selection effect in the results, it is crucial to make sure that the sample was as equal as possible before the study took place. This is already taken into consideration in the design of the survey and in the result’s analysis, since all the people in the sample had considered studying business or economics during high school. This restriction is made considering that just the fact that people had thought about studying in these areas was enough to make them intrinsically different in what concerns their risk profile.
However, this may not be enough to guarantee that the people were similar before their studies. There may be other characteristics that are different between people who study business and economics and those who do not study in these areas, even before they start their studies in the ir respective areas, namely the
cognitive ability. According to several authors1, an individual’s risk profile is influenced by his or hers
cognitive ability, and, therefore, assuming that the people in both treated and control groups have similar cognitive abilities may lead to incorrect and bias results. It is, thus, important to understand if people who study business or economics have, on average, a intrinsically different cognitive ability than people who do not study in these areas.
One measure of cognitive ability is the Grade Point Average (GPA), which is defined by the average grade obtained by dividing the sum of all the grades earned in each course during a degree by the sum of the credits of each course taken. According to Laidra, Pullmann and Allik (2007), Rohde and Thompson (2007) and Koenig, Frey and Detterman (2008), there is a high correlation between cognitive ability and GPA. Thus, with the purpose of measuring the sample’s hypothetical cognitive ability, I calculate the average GPA in both treated and control group, in order to see if the difference of GPA is significant between the two groups. As a matter of simplicity, I choose for each course a few universities in Lisbon and use the grade of the student with the lowest grade to enter into a specific course to calculate the average GPA for each course. I only use data regarding public universities since data for private
1
Doh men, Fa lk et al. (2007), Van Rooij, Lusardi and Alessie (2007), Christelis, Jappelli and Padula (2008) and Oechssler, Ro ider and Sch mitz (2009). Their theories have already been developed in Chapter 2 of this Dissertation.
25 universities is not publicly available. Then, the proportion of people in the sample who have studied or are studying a specific course is used to calculate the weighted average GPA in each group (treated and control). Tables 8 and 9 below show a summary of the GPAs in each course. More details about this calculation method, as well as which universitites are used to calculate the GPA, can be found in Appendix C.
Table 8 - Average GPA in Each Area of Studies (Treated Group)
Area of Studies % in sample Average GPA Business Administration 52.5% 15.5 Economics 47.5% 15.3 Total 100.0% 15.4
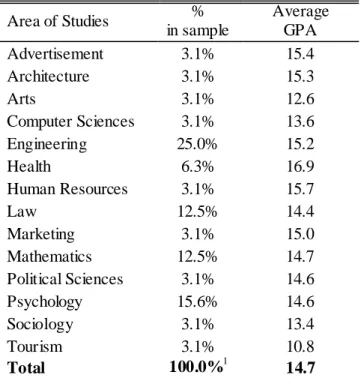
Table 9 - Average GPA in Each Area of Studies (Control Group)
Area of Studies % in sample Average GPA Advertisement 3.1% 15.4 Architecture 3.1% 15.3 Arts 3.1% 12.6 Computer Sciences 3.1% 13.6 Engineering 25.0% 15.2 Health 6.3% 16.9 Human Resources 3.1% 15.7 Law 12.5% 14.4 Marketing 3.1% 15.0 Mathematics 12.5% 14.7 Political Sciences 3.1% 14.6 Psychology 15.6% 14.6 Sociology 3.1% 13.4 Tourism 3.1% 10.8 Total 100.0%1 14.7
As it can be seen by analysing the tables above, the average GPA in the treated group (15.4 out of 20.0 points) is higher than the average GPA in the control group (14.7 out of 20.0 points). This means that there might be a bias problem in the sample used to draw the conclusions in Chapters 4 and 5. In order to solve this issue, a solution would be to add a few questions testing the cognitive ability of the respondents and then use the answers to those questions as control variables in the regression analyses.
1
26 It is important to emphasize that this analysis is totally hypothetical. Without collecting information about the GPA of each participant, it is not possible to conclude that the results shown in the tables above are also applicable to the sample used in the analyses. Furthermore, not only is GPA a imperfect measure of cognitive ability, but also the fact of using the GPA of the people with the lowest grade to enter in a specific university tends to create a huge bias in the results. However, the only purpose of doing a sensitivity analysis using cognitive ability is to try to understand if a measure of cognitive ability would be important in order to draw more correct and significant conclusions in what concerns the relationship between studying in a business school and the students’ financial, career and educational risk profile.
27
7.
DISCUSSION
In the previous chapters, through the several analyses made with the sample, several results were found and the main goal of this section is to interpret the meaning of these findings.
Financial Literacy and Financial Risk
One of the main topics in every business or economics course is finance. Students gain basic knowledge of accounting, corporate finance and financial markets. In more advanced studies of business or economics, students became specialists in these topics (Kirchgässner, 2005; Carter and Irons, 1991; Christiansen, Joensen and Rangvid, 2008) , and, on average, students of the economics or business areas are the ones with greater financial literacy, when compared to students from other areas (Chen and Volpe, 1998; Cole and Shastry, 2009). It is expectable that this greater financial literacy has an impact in the students’ risk profiles in what concerns their financial choices. According to the results presented in Chapter 5, being a business student with a high degree of financial literacy increases the likelihood of being both more risk averse and risk loving in what concerns financial risk, which means that a person who has both studied in a business school and has a high degree of financial literacy is more likely to have a more extreme behaviour in terms of financial risk.
On the one hand, understanding about finance and studying in an environment where financial topics have a high importance might make people more self conscious about their financial decisions, meaning that they would be less willing to take risks whenever money is involved. Thus, this would le ad to students in these areas and with great financial literacy being more risk averse in what concerns the financial domain. On the other hand, by having the financial knowledge, business students may feel more confident, for example, to hold stocks or to invest in more complex and risky financial products. They may get more curious about the movement of markets and more aware of what makes them go up or down, leading to a more active and risky financial behavior. Furthermore, the fact that they have a high degree of financial literacy, it gives them the understanding they need in order to be confident enough to get involved in some risky financial decisions. Finally, in business schools, students are incentivized to participate in several financial challenges in which they have to choose financial products to invest a certain amount of virtual money and try to get the highest amount of profit possible. The more financially literate students tend to get better results in these challenges and, thus, get a higher incentive to participate in more of these challenges and to have a more participative and risky role in the financial markets. All these stimuli and incentives would lead to a higher likelihood of business students with a high degree of financial literacy to be risk loving in the finance domain, which is the conclusion obtained in Chapter 5.
28
Career Risk
The business world is becoming more competitive every day, mainly due to the increasing number of schools offering business and economics courses to their students, and thus, the increasing number of students taking these courses. One indicator of business schools’ success is the job placement of their students, i.e., the best and more competitive business schools will be the ones that assure their students good career perspectives. Therefore, most business schools feel the need to have people only focusing on establishing contacts with the best companies, in order to find the best job opportunities for their students. In addition to that, students also get a lot of preparation in what concerns job interviews, how to write a good CV and an outstanding motivation letter used for applying for job offerings, etc. Finally, the best companies visit the best business schools, in order to catch their students’ attention and to get the best ones to work for them. Thus, students get involved in all this competitiveness and become very much aware that the best companies are where they want to work in. These are all stimuli for business and economics students to more likely be risk averse than their non-business colleagues, i.e. these are incentives for some of the business students not want to work in those smaller companies, in which that could perhaps gain more responsibility, but where their job placement would be in risk if the company would not survive in a competitive business world.
On the other hand, there is a “hot topic” across business schools which might motivate students to have the opposite behaviour concerning their career decisions: entrepreneurship. Over the last years, one can observe the increasing importance of entrepreneurship in business schools, which translates into more courses offered in which students learn about how to write a business plan and in which they are motivated to come up with ideas for creating their own businesses. Additionally, there are a lot of entrepreneurship contests, which are promoted within business schools (and sometimes even organized by business schools themselves). In these contests participants are challenged to present their business ideas and the best ideas are given a monetary prize which is aimed to help entrepreneurs to start their companies. This environment of motivation towards entrepreneurship that exists in business schools is likely to make their students more willing to risk more in what concerns their career decisions, by starting their own companies and becoming entrepreneurs, and not to choose the safest way and work for an already successful and established company.
In conclusion, on the one hand, business schools’ competitive environment is likely to be making their students more risk averse in what concerns their career decisions. However, on the other hand, an incentive in the opposite direction is probably leading for the increasing willingness of students to become entrepreneurs, and, thus, more risk loving in what concerns their career decisions.