A Work Project, presented as part of the requirements for the Award of a Master Degree in Finance from the NOVA – School of Business and Economics.
Rating Corporate Groups
A modelling Experience
Carolina Filipa Leite Lourenço 861
A Project carried out on Master in Finance Program, under the supervision of: Professor João Pedro Pereira
Dr. Francisco Matos
2
Rating Corporate Groups
A modelling Experience
Abstract
This paper aims to provide a model that allows BPI to measure the credit risk, through its rating scale, of the subsidiaries included in the corporate groups who are their clients. This model should be simple enough to be applied in practice, accurate, and must give consistent results in comparison to what have been the ratings given by the bank. The model proposed includes operational, strategic, and financial factors and ends up giving one of three results: no support, partial support, or full support from the holding to the subsidiary, and each of them translates in adjustments in each subsidiary’s credit rating. As it would be expectable, most of the subsidiaries should have the same credit rating of its parent company.
Keywords: Credit profile; Risk; Rating; Holdings and subsidiaries.
Acknowledgments
I am really grateful to all the rating department of BPI that provided me the information I needed to carry out this project, with a special acknowledgment to my official advisor, Dr. Francisco Matos, and to Dra. Marília Ferreira who were always there to help me.
I want to dedicate this project to all the people that was part of my life and helped me, personally and academically, during my masters.
3 I. Introduction
BPI – Banco Português de Investimento - is a major portuguese private financial group, listed in the Euronext Lisbon’s PSI-20 stock index, and focused on banking businesses, providing financial services and products for corporate, institutional and individual customers. Its assets stand about 46 billion euros and it has more than 1.4 million customers in Portugal, Spain, Angola, and Mozambique.
In order to get a good customer selection and to control processes, the bank needs models that allows it to make risk-informed decisions. These models, based on each customer credit profile, end up giving an objective value – credit rating - that, ultimately, corresponds to a probability of default. The internal ratings go from E1 to E10, with the first corresponding to the best case – lower probability of default, and so lower credit risk. In the current paper, a ‘notch below’ is actually one value above in the rating scale, i.e., one position worse: for example one notch below E5 is E6. The opposite reasoning applies to ‘notch above’.
According to Basel II, an Internal Rating Based (IRB) approach must incorporate both historical and empirical evidence. However when we get to Low Default Portfolios (LDP), the analysis seem complicated – the historical number of defaults is insufficient for the traditional back-testing analysis and for any econometric estimative. Hand in hand with this, BPI is still in need to improve the way it rates the subsidiaries regarding the intragroup relationships when the whole group presents consolidated financial statements, and that is the main focus of this paper. In fact, does it make sense to have different credit ratings inside a group if in case of financial distress they will support each other? What if they have completely different credit risk on a stand-alone basis? Is a subsidiary always guaranteed by the group’s performance? All these questions are discussed in the following chapters. Note that the terms parent company and holding are considered interchangeable throughout this paper.
4
The present report starts with a summarized and brief analysis of what is done in this matter by the leading rating companies in the world - DBRS, Fitch, Standard & Poor’s, and Moody’s. Given the impact of these rating agencies on the institutions and the countries themselves all over the world, the way they link the holdings and the subsidiaries’ ratings is an important starting point to any model we want to create. As such, we then get into the design of a new model proposal for BPI on how to assess subsidiaries’ ratings based on their relationship with the parent company. This relationship will be analysed at different levels – financially, operationally, and strategically. After designing it, it comes a chapter where we apply that new model to groups already rated by BPI in order to test the results and compare them with what is being done. This model analysis is particularly important to ensure rating consistency, which is a decisive characteristic of risk analysis. Finally, we make some conclusions about the accuracy and practicability of the proposed model, based on the model analysis chapter, as well as possible inherent limitations found along the work.
II. Literature Review
The relationship between the ratings of a holding company and their subsidiaries is an unavoidable topic of all institutions that provide credit to other companies because it allows to understand how likely to default a company is taking into account the group where it belongs. Throughout this chapter we will attempt to explore the different ways to analyse it, carried out by the four biggest rating agencies in the world – DBRS, Fitch, Standard & Poor’s, and Moody’s.
DBRS
DBRS criteria for rating holding companies and their subsidiaries released in September 2012 considers that, as long as there are consolidated financial statements and unless there are
5
ring-fencing constrains, both the parent and the subsidiaries must have the same credit rating, based on the group’s predominant sector of activity and the DBRS’s methodology. In case of ring-fencing, the stand-alone credit profile is considered.
Fitch
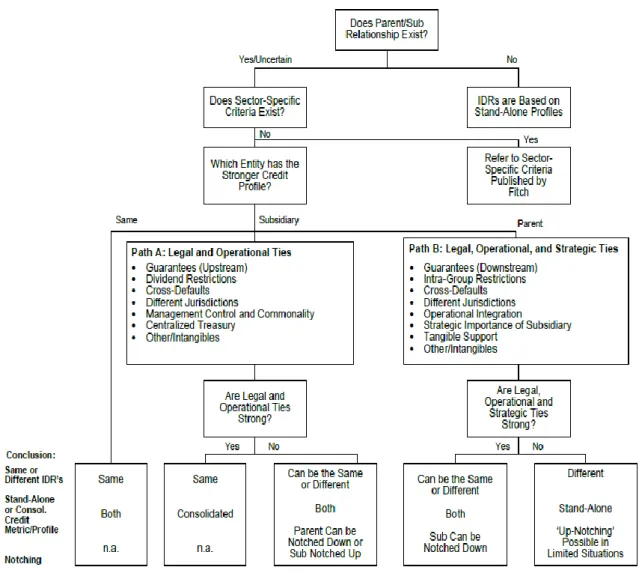
In order to assess parent and subsidiary rating linkage, Fitch evaluates whether there are strong legal, operational, and strategic ‘ties’. The following scheme (Figure I) summarizes the whole process.
Figure I – Linkage Considerations Framework Outline1
1 “Corporate Rating Methodology Including Short-Term Ratings and Parent and Subsidiary Linkage”. 2014. Fitch Ratings.
6
Standard & Poor’s
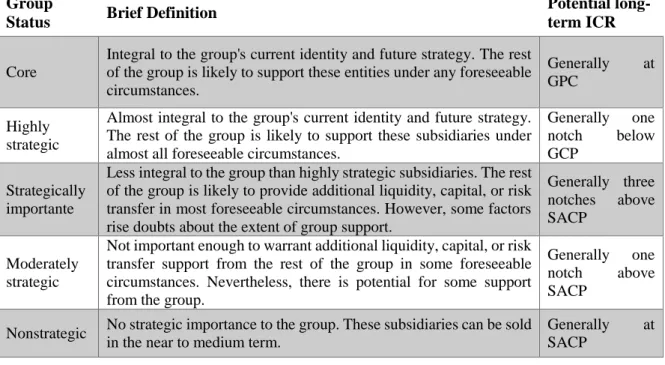
S&P includes the impact of a parent’s rating on the subsidiaries’ rating by evaluating the incentive that the first has to support each of the subsidiaries when they are in financial distress. This willingness to help is based on whether the subsidiary is strategically important for the parent. As such, S&P characterizes the subsidiaries as core, highly strategic, strategically important, moderately strategic, or nonstrategic. To assess the group status of each group member, the rating agency takes into account different factors, such as percentage of ownership, ability to give financial support, sharing the same name and/or brand (and so reputational risks), track record of subsidiary’s performance, operational and strategic integration, whether there are agreements or any source of obligation for the parent to provide financial support, among others. Table I summarizes the impact that each classification has on parent’s and subsidiaries’ ratings.
Table I – Summary of Associating an Entity’s Group Status With a Potential Long-Term ICR2
Group
Status Brief Definition
Potential long-term ICR
Core
Integral to the group's current identity and future strategy. The rest of the group is likely to support these entities under any foreseeable circumstances.
Generally at GPC
Highly strategic
Almost integral to the group's current identity and future strategy. The rest of the group is likely to support these subsidiaries under almost all foreseeable circumstances.
Generally one
notch below
GCP Strategically
importante
Less integral to the group than highly strategic subsidiaries. The rest of the group is likely to provide additional liquidity, capital, or risk transfer in most foreseeable circumstances. However, some factors rise doubts about the extent of group support.
Generally three notches above SACP
Moderately strategic
Not important enough to warrant additional liquidity, capital, or risk transfer support from the rest of the group in some foreseeable circumstances. Nevertheless, there is potential for some support from the group.
Generally one
notch above
SACP Nonstrategic No strategic importance to the group. These subsidiaries can be sold
in the near to medium term.
Generally at SACP
2 Standard & Poor’s Financial Services LLC. 2014. “General Criteria: Group Rating Methodology”. McGraw-Hill Financial.
7
Moody’s
Moody’s incorporates the parent-subsidiaries relationship by evaluating the ability and the willingness of the parent to support the subsidiary. On the first side, the holding company may (or may not) suffer financial problems at the same time, due to high (or low) correlation of business risks. On the other side, if there are reputation/brand risks, strategic fit/event risk, operational integration, and/or historic evidence of the parent providing support, the parent will be more willing to support the subsidiaries when they are in financial distress, in order to protect itself from contagion. After evaluating this, Moody’s adjusts the stand-alone profile ratings of the subsidiaries: if they are financially weak or risky businesses, they keep the stand-alone profile rating; if they are well established and essential to the parent, their stand-alone profile rating might go up for one or two notches; if they are financially, strategically, and operationally important to a really strong holding company, their ratings might even go up for even more than two notches, having the parent’s rating as a ceiling.
Summing up, for most of the big rating agencies, a stand-alone profile analysis is done first and then they adjust the rating of the subsidiaries based on the linkage with the parent. This link is evaluated mainly by strategic factors, but also by operational, financial, and legal factors. The intent of this paper is to apply it in BPI, establishing, a priori, two extreme points where the subsidiary has the same rating of the holding or, in contrast, a rating based on its stand-alone profile without any adjustments, and analysing the relationship between them to adjust the rating of the subsidiary when it lies in between of these two points.
8 III. Model Design
This paper’s objective is to assess subsidiaries’ credit rating through their relationship with the parent company when they present consolidated financial statements. After analysing what is done by the leading rating agencies, we will now try to design a model for BPI.
First of all, let us consider the extreme cases where there are total ring-fencing constrains or legal obligations. In the first case, since there are restricted access to cash-flows between the holding company and its subsidiaries, the credit risk analysis should be done separately, i.e., parent’s and subsidiaries’ ratings should be based on their stand-alone profiles. These constrains can appear directly in the form of project finance or regulations that forbid the parent company to influence the business and financial risk profile of the subsidiary, or it can come indirectly from the ownership of listed companies (thus, the parent will not want to let the subsidiary default given the big consequences for the group that could arise) or any type of agreement that makes the subsidiary independent from the parent which allows the parent to easily (no major consequences for the group) sell it in case of financial problems. In the second case, when the parent has legal obligations to provide financial support to its subsidiaries (such as debt guarantees), we consider that the subsidiaries should have the same rating of the holding company. In fact, if there are legal ties between them, they are ‘protected’ from each other’s performance, and so, there are no reasons to have different ratings. Moreover, BPI considers that as long as the holding owns 90% (or more) of a company, it has social responsibility to help it during financial problems. Conversely, if the holding has a participation smaller than 50% on a subsidiary, it is not responsible for this last company, and so, the risk analysis should be done separately.
Thus, the problem with this analysis arises when the linkage between the holding company and its subsidiaries lies somewhere in between of the afore-mentioned two extreme points, and the subsidiaries are detained at less than 90%. As such, the focus of this paper is to find a
9
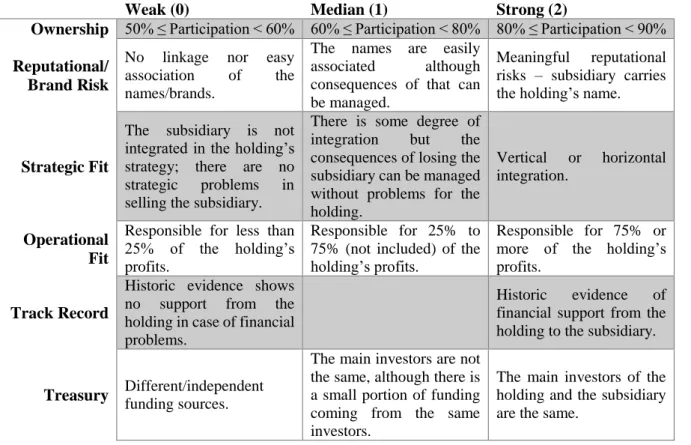
solution to these intermediate cases. The model we propose to solve this covers several factors: ownership, reputation/brand risk, strategic fit, operational relevance, track record of support, and centralized treasury. First of all, we have the most quantifiable factor which is the participation of the holding company – if the parent company owns just a part of a subsidiary it will be less willing to give financial support than if it owns 100% of the subsidiary’s shares. Second, and starting with the more subjective factors, there might be reputational or brand risk for the holding company if the subsidiary fails, due to sharing the same name or immediate association of the names in the consumers’ mind. In this case, the parent will be more willing to give financial support to the subsidiary in order to avoid these problems. Third, if there is a strategic fit, through vertical integration for instance, the incentive to support the subsidiary in case of financial distress is higher than if they operate in different sectors. Fourth, if a subsidiary is responsible for a big part of the parent’s profits, there is a huge probability that the parent will provide help. Otherwise (for no strategic or no operational relevance), the parent company can decide to sell it instead of solving its problems, and so, the link between both companies is not significant. Fifth, we can consider that if the parent has given support to the subsidiary in the past, the probability of giving it again is higher. Finally, in case both companies usually get money from the same investors/bank or through intracompany relationships, the parent will be more willing to provide support because, if it allows the subsidiary to fail its payments to the debtholders that know who is the owner of that company, they might refuse to provide credit to the parent company afterwards.
The next step is to measure the afore-mentioned factors and put them together, just so we can have a model to extract the credit rating of each subsidiary from the credit rating of the holding company or adjust its stand-alone rating given the relationship with the parent. The model we propose gives a weight to each of the factors, which will then be multiplied by zero, one or two, depending on whether the factor shows, respectively, a weak, median, or strong
10
relationship between each subsidiary and the holding company. Table II summarizes the criteria for this classification.
Table II – Relationship between holding and subsidiary
Weak (0) Median (1) Strong (2)
Ownership 50% ≤ Participation < 60% 60% ≤ Participation < 80% 80% ≤ Participation < 90% Reputational/
Brand Risk
No linkage nor easy
association of the
names/brands.
The names are easily
associated although
consequences of that can be managed.
Meaningful reputational risks – subsidiary carries the holding’s name.
Strategic Fit
The subsidiary is not integrated in the holding’s strategy; there are no strategic problems in selling the subsidiary.
There is some degree of integration but the consequences of losing the subsidiary can be managed without problems for the holding.
Vertical or horizontal integration.
Operational Fit
Responsible for less than 25% of the holding’s profits.
Responsible for 25% to 75% (not included) of the holding’s profits.
Responsible for 75% or more of the holding’s profits.
Track Record
Historic evidence shows no support from the holding in case of financial problems.
Historic evidence of financial support from the holding to the subsidiary.
Treasury Different/independent funding sources.
The main investors are not the same, although there is a small portion of funding coming from the same investors.
The main investors of the holding and the subsidiary are the same.
Each of the factors is weighted considering its relative importance on the model. To find the weights, the starting point was what Moody’s considers in its rating models3 and some
adjustments were made to avoid big discrepancies between the result of this model and the ratings that the bank gave to their clients. Summing all the factors already weighted, the model will give a score between zero and two, where the extreme points are not included since it would correspond to one of the extreme cases mentioned in the beginning (no support or full support). Afterwards, we divide the results in three intervals – 0 to 0.5, 0.5 to 1.2, and higher than 1.2. Since most of the subsidiaries should claim full support because otherwise it would not make sense to be inside the same group, the biggest interval is the one that respects to strong
3 Clark, J. Bruce. 2012. “The Rating Relationship Between Industrial Companies And Their Captive Finance Subsidiaries”. Moody’s Investors Service.
11
relationships. Keeping the same reasoning in mind, the smallest interval should be the one that corresponds to a weak relationship.
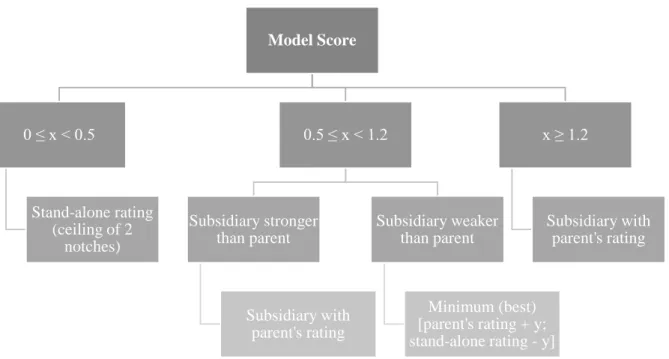
Let y be the average between parent’s rating and the subsidiary’s stand-alone rating, the following scheme, figure II, shows the process to go from the model score to the final rating of the subsidiary.
Figure II – From Model Score to the effective rating of the subsidiary
The first result, if it is between 0 and 0.5, represents a weak relationship between them, and so, the rating of the subsidiary should be based on its stand-alone credit profile, although with a ceiling of two notches above the credit rating of the holding since there is still some risk of contagion in case of financial problems within the group (also the score is slightly above 0). Note that this ceiling is based on what the reference rating companies around the world are doing (see literature review). The second alternative, where the score lies between 0.5 and 1.2, is divided in two cases: if the subsidiary has a credit profile stronger than the parent, it should have the same rating of the parent; if the parent has a stronger credit profile than the subsidiary, the last’s credit rating should be the best between the holding’s rating plus the average of the
Model Score 0 ≤ x < 0.5 Stand-alone rating (ceiling of 2 notches) 0.5 ≤ x < 1.2 Subsidiary stronger than parent Subsidiary with parent's rating Subsidiary weaker than parent Minimum (best) [parent's rating + y; stand-alone rating - y] x ≥ 1.2 Subsidiary with parent's rating
12
difference between their ratings and the subsidiary’s credit rating minus that same average. Note that when we add something to a rating we are worsen it (for example, E1 plus 1 is E2 that has a higher probability of default), and when subtract we are improving it (for example, E8 minus 2 is E6 that has a lower probability of default). Note that, since the rating is an integer, the average is rounded up. Moreover, it is considered the difference and not a pre-defined number to avoid cases when the difference is lower than that pre-defined number which would result in a subsidiary with higher rating than the parent, even when its stand-alone profile is worse. We also consider average and not the difference itself to prevent high discrepancies - for instance if the parent is an E4 and the subsidiary an E8, and we consider the total difference, the rating would be the best between E4 and E8, this is, an E4 for a company that is on its own an E8. As such, using the average makes that company an E6 which sounds more reasonable. Finally, if it is above 1.2 we consider that there is a strong relationship between the holding and the subsidiary, and therefore they should have the same rating.
IV. Model Analysis
In order to test the model, we apply it, in this section, to eight real cases and compare the results with the ratings that BPI gave to those companies based on its actual model. To improve the accuracy of the model, we chose groups across different sectors and with different organizational charts. The necessary information to perform this analysis was taken from the group’s consolidated management reports and accounts. Moreover, the stand-alone ratings for the companies in the grey area were calculated by BPI with an internal algorithm. Note also that the real names of all the companies were hidden (substituted by letters in case of the holdings and numbers for the subsidiaries) due to confidentiality obligations. The tables with the characteristics and the results for each group are presented in appendix.
13
The first group (Holding A) belongs to the oil and gas sector and has thirteen subsidiaries where the percentage of capital detained by the holding lies between 50% and 90%. Except for one of them, they share the same characteristics in most of the factors: meaningful reputational risks, strategic integration, responsible for less than 25% of the holding’s EBITDA, past financial support received from the holding, and the same main investors. As such, the differentiating factor is the ownership, which is also the most important. The model score for most of the subsidiaries is above 1.2, meaning that they should have the same rating as the holding. The exceptions are subsidiary 3 which does not even share the characteristics afore-mentioned – there is no strategic relationship nor reputational risks – and subsidiaries 4 and 8 that, due to lower participation, have a model score lying also on the partial support. In case of subsidiary 3, BPI does not rate this company, and so, there is no possible comparison between the model and what is done. In case of subsidiary 4, it has a stand-alone rating of E2, and so, the model results in a final rating of E3. Finally, subsidiary 8 has a stand-alone credit rating of E6 which, in this model, will give a final rating of E4. BPI ratings are quite similar to the ones we got: most of them have the same rating as the holding, except for subsidiaries 1, 4, 8 and 9, with a rating one notch below the parent.
The second group’s (Holding B) main activities are management, development and investment of shopping centres business, and includes twenty-two subsidiaries that need to be analysed. Most of them have a participation lower than 50%, meaningful reputational risks, strategic integration, responsibility for less than 25% of the holding’s EBITDA, have been supported by the holding, and share the same main investors. As such, except for one of them that is detained at a higher percentage and results in full support, all of the others lie in the partial support area. However, BPI does not have ratings for almost half of these companies – some of them do not have individual reports for the last years, some have zero turnover, and others are not clients of this bank. For those that we can compare, just three of them have
14
different results – subsidiaries 19 and 22 have a stand-alone rating two notches below the parent, and subsidiary 12 three notches below, thus, they should have a consolidated rating one notch below the parent. Even though, BPI rates them with the parent’s rating.
The third group (Holding C) operates mainly in the farming and industry, but has recently started to operate in the distribution sector. In the consolidated accounts, there are four companies with percentage of ownership between 50% and 90% - the holding owns 50/51% of two of those and 80% of the other two subsidiaries. Furthermore, the companies are not immediately associated to the group, thus, the consequences of one brand’s deterioration can be managed in order to not spread across the group. Moreover, except for the one in the distribution sector, that is still not fully integrated, the other three companies are strategically important for the parent. Finally, they are all responsible for less than 25% of the holding’s EBITDA, have been supported by the holding, and share the same main investors – the parent company has been financing the growth of the subsidiaries. Consequently, three of them lie in the partial support area, and one in the full support. Following our model, the last should have the rating of the parent. In the other cases, there is: subsidiary 1 with a stand-alone profile equal to the parent, thus, resulting in the same credit rating; subsidiary 2 that would be rated three notches below the parent if based on its stand-alone profile, and so, one notch below following our model; and subsidiary 4 with a stand-alone initial rating four notches above the parent, which here translates in the same rating as the holding. BPI rates all these companies (holding and subsidiaries) in the same way. As such, in this third case there is just one rating not consistent between our model and what is being done.
The fourth group (Holding D) belongs to the agri-food industry and most of its subsidiaries are detained at more than 90%, having just five below that value. From these, four have a participation just slightly above 50% and one slightly above 60%. In respect to brand risk, four of them are associated to the group’s name, although the consequences of troubles in one can
15
be managed to not influence the others, and one is not so linked due to operating in a different sector. Those four companies are also strategically in-line with the group. Finally, all of them are responsible for less than 25% of the group’s EBITDA, have been financial supported by the parent, and share the same main investors. Thus, three of the subsidiaries’ model scores (1, 4 and 5) are in the intermediate area, one below 0.5 (subsidiary 2) which translates in a stand-alone based rating, and one equal to 1.2 (subsidiary 3) which means that it should have the parent’s rating. Subsidiaries 1 to 3 have a stand-alone credit rating equal to the holding (E3), and so, that is the final rating as well. Subsidiaries 4 and 5 have an individual credit profile stronger than the holding, and so, the final rating of our model is also the E3 for both of them. BPI ratings for this group are consistent with our results.
The fifth group (Holding E) operates mainly in the four sectors: energy, transportation, tourism, and distribution of food products. Eight of the subsidiaries of this group do not belong to the extreme cases referred above and need to be analysed in our model. Holding E owns between 80 and 89% of five of those, between 60 and 80% of two, and 50.50% of the other one. Additionally, except for one that has a close name, the subsidiaries’ names are not directly associated to the group and to each other, and consequently, if one defaults the risk of reputational contagion can be managed. Considering the strategic fit, all of them are integrated in the group’s vision and strategy, and at the operating level, most of them are responsible for less than 25% of the holding’s EBITDA. Finally, the subsidiaries have been historically financial supported by the parent and, although some of them share the same investors, the subsidiaries got most of their credit from different banks. This results in five companies in the full support area – getting the same rating of the holding – and three in the partial support. Since BPI does not rate the companies that lie in the partial support area, there was no way we could get the stand-alone credit rating, nor compare our results with actual BPI’s results.
16
The sixth group (Holding F) is divided into five sub-holdings: global (most of the businesses in telecommunications), industry, tourism, real estate, and other participations. Except for the global, owned at 85%, all of the others are owned at 100%, and so, should have the same rating of the holding F. Besides that, the sub-holding that has a participation of 85%, following our model, has all of the characteristics to be considered in the full support, thus, sharing the same rating of holding F. Then, we analysed the critical companies that belong to each of these sub-holdings. The results are evenly divided in full and partial support. Most of the last cases are due to low participation and reduced strategic and brand linkage in the case of the participations’ sub-holding. However, BPI does not rate most of these critical companies, and so, we cannot make a comparison. The only three that lie in the partial support area and that are rated by the bank, show the same rating of the holding, either using our model or what BPI is doing.
The seventh group analysed (Holding G) is present in five areas of activity: construction, concessions, rental property, services, and industrial. These five sub-holdings are all owned at more than 90%, and so, they should have the same rating as the holding G. As such, the analysis concerned the subsequent subsidiaries. All of these companies are detained at more than 60%, do not share the name of the sub-holding, although having some degree of linkage, are strategically integrated in the respective sub-holding business, are responsible for less than 25% of the group’s EBITDA, have been financially supported by the holding or the sub-holding, and share the main investors. This results in having all the companies in the full support zone, and consequently, getting the same rating as the holding. BPI also reached this conclusion with its actual method, giving the same E6 rating for the holding and all the subsidiaries.
The last group (Holding H), and also the most complex one due to its structure, is divided by geographical area (consolidated accounts for each one), and subsequently, by sector: engineering and construction, and environment and services. For the purpose of this paper we
17
analysed the sub-holdings and subsidiaries of this group in Africa and Europe. Note that there are a lot of degrees in this group’s chart, and a lot of companies that are owned at less than 90% by the sub-holdings that are also detained at less than 90% by the Holding H. As such, we analysed the relationship of each company not with the Holding H but with the company that is immediately above in the group’s structure, and the final rating is compared to that one above and not to the whole group’s rating. From the reports analysed, we got that all the companies are strategically integrated in the group and subgroups’ businesses, they all are responsible for less than 25% of the EBITDA, and have been financially supported inside the group. Besides that, some of them share the name of the company they belong to, and others are related but not so directly. Finally, the participation percentage varies from 50 to 90%: in Africa, the considered companies are all owned at 50-60%; in Europe most of them are owned at 60-80%. From our model, the companies that needed to be tested in the African branch lie all in the partial support area, and the ones in the European side are mainly in the full support area, with three exceptions in twenty-two analysed. BPI does not give ratings for most of the companies considered. From the seven possible to compare, the ratings we got are almost the same as the ones BPI actually gives. The only exception is subsidiary 13 that belongs to the European sub-holding, which is an E7, and lies in the full support area, and so, should be rated in the same way. However, its stand-alone rating is an E3 and BPI rates it as an E4, as well as most of its subsidiaries (that are not included because they are detained at more than 90%). Note that even if the subsidiary was in the partial support area, our model would give it an E7 since its stand-alone profile is stronger than the holding’s profile.
In most of the cases analysed, the conclusions that we got from our model are the same that BPI has been getting internally, although with some nuances.
18 V. Conclusions
The goal of this paper is to provide a practical solution for BPI’s worry about how to give ratings to different companies inside the same group. This involves identifying the determinants of a holding-subsidiary financial relationship, as well as model them in a way we can extract the subsidiaries’ rating from the holding’s rating and that relationship or, at least, make the necessary adjustments to the subsidiaries’ stand-alone rating.
For this purpose, we started by analysing what is being done by the major rating companies in the world. In this first chapter we concluded that most of them focus on the strategic relationship between the companies, although some also give importance to the operational factors. Moreover, Moody’s has a model for industrials where it presents specific weights for each of the factors considered. From this starting point we got into a model design where we decided to include six factors, here sorted from the most to the least important and weighted: ownership, strategic fit, operational fit, reputational/brand risk, treasury (financing sources), and track record. Note that since we considered less factors than Moody’s, the weights were adapted and decided in a trial and error basis through the model analysis in order to get rating consistency. Besides that, the model just applies to groups of companies that present consolidated financial statements, where there is not total ring-fencing, and where the holding owns between 50 and 90% of the subsidiary in analysis. Finally, the model is supposed to give results between zero and two which translates in weak, intermediate, and strong relationships, and respectively to no support, partial support, and full support upon financial distress periods. The first result originates a alone based rating, the second some adjustments on the stand-alone rating of the subsidiary, and the last the same rating for both the holding and the subsidiary. The scale to apply each of these results comes from the fact that, in practice, if the companies belong to the same group, most of them should lie in the full support area, and as it goes to the opposite extreme, the less companies we should have.
19
Afterwards, we tested the model by applying it to eight groups of companies whose holding is a BPI’s client, across different industries and with different organizational structures, and compared the ratings with the ones given by the bank.
It is important to start by stating that we found some limitations of this model. First of all, the model might look simplistic since it includes just six factors and there are a lot of details in a parent-subsidiary relationship. Nevertheless, the more complex, the less practical applicability a model has. Secondly, the brand/reputational risk might look too subjective since I can easily associate two brands that another person does not know that belong to the same group. Still, this analysis must be done by specialized people who really know the corporate group, just like all the subjective factors’ analysis of the internal rating models of any financial institution. Thirdly, since it is a model to be applied to each subsidiary it seems to be too time-consuming. Yet, if considering just the subsidiaries detained at less than 90%, it seems reasonable and worth it. Fourthly, in the cases analysed in this report, there are three factors that almost do not vary: operational fit, track record, and financing sources. Theoretically we still think that they are important just how we explained in the model design section. However, we analysed huge groups of companies, and so, it is understandable that most of them are responsible just for a small portion of the group’s EBITDA. Besides that, if the subsidiaries belong to the group, the probability of having been supported by the holding is big, and otherwise they would already have been sold and not included in the consolidated financial statements anymore. Finally, Portugal is a small country, where there are not a lot of big investors and where the companies are not used to go to the financial markets to get financed. Thus, most of the companies across the country (and consequently, the ones we analysed) get financed in the same places, sharing the same main investors.
Furthermore, note that this is a theoretical model, and it is still in need to go through the econometric analysis to find the optimal weights and cut-offs before it can be applied in reality.
20
However, this matter is not under this department’s responsibility, therefore, it did not take part on this paper, which is also a limitation of the model analysis presented above.
Then, throughout this analysis, a lot of companies lie in the partial support area and that is counterintuitive since they belong to the same group and so should have some important operational and/or strategical linkage with each other. Nonetheless, we have to keep in mind that most of the companies of each group are not even considered and used in this model since the parent owns more than 90%, and those have the same rating as the parent.
Finally, there were a lot of cases where the comparison between our model’s results and the bank’s effective rating was not possible due to the fact that the subsidiaries concerned are not clients of BPI.
Summing up, the model we propose is accurate to, ultimately and through the rating scale, measure the probabilities of default inside a corporate group. The stronger the holding-subsidiary relationship, the closer will their ratings be since they will provide financial support to each other in case of financial distress, as long as they are able to do it, and so prevent the default. As such, in limit, they will have the same probability of default, which is the case where the relationship is so in line that every time the parent can help, it will for sure, and so, the subsidiary will just default when the parent is also in default and has no ability to help. Our model measures this and gives results close to the ones BPI has been getting internally, which ensures the necessary rating consistency.
21 VI. References
Basel Committee on banking supervision. 2005. “Validation of low-default portfolios in the Basel II Framework”. Basel Committee Newsletter No. 6.
Bodard, Eric De, and Mark Waehrisch. 2007. “Analytical Considerations in Assessing Conglomerates”. Moody’s Investors Service.
Bodard, Eric De. 2007. “Global Investment Holding Companies”. Moody’s Investors Service. Clark, J. Bruce. 2012. “The Rating Relationship Between Industrial Companies And Their Captive Finance Subsidiaries”. Moody’s Investors Service.
“Corporate Rating Methodology Including Short-Term Ratings and Parent and Subsidiary Linkage”. 2014. Fitch Ratings.
“Covenants and Ring-Fencing for Wholly-Owned Subsidiaries”. 2007. Moody’s Investors Service
“Model Design and Verification Final Report - Prepared for Banco BPI S.A”. 2013. Moody’s Analytics.
“Rating Holding Companies and Their Subsidiaries”. 2012. DBRS.
Standard & Poor’s Financial Services LLC. 2014. “General Criteria: Group Rating Methodology”. McGraw-Hill Financial.
Wilshurst, Paul. 2012. “Dealing with implicit support in relation to intra-group debt”. Charles River Associates.
22 VII. Appendix
Model Analysis Results – Holding A
Model Analysis Results – Holding B
Initial
Rating (E) Ownership
Reputational/ Brand Risk Strategic Fit Operational Fit Track Record Treasury Model Score Final Rating (E) BPI rating (E) Holding A 3 Subsidiary 1 3 1 2 2 0 2 2 1.3 3 4 Subsidiary 2 3 1 2 2 0 2 2 1.3 3 Subsidiary 3 3 1 0 0 0 2 2 0.6 3 Subsidiary 4 2 0 2 2 0 2 2 1 3 4 Subsidiary 5 3 1 2 2 0 2 2 1.3 3 3 Subsidiary 6 3 1 2 2 0 2 2 1.3 3 3 Subsidiary 7 3 1 2 2 0 2 2 1.3 3 Subsidiary 8 6 0 2 2 0 2 2 1 4 4 Subsidiary 9 3 1 2 2 0 2 2 1.3 3 4 Subsidiary 10 3 1 2 2 0 2 2 1.3 3 Subsidiary 11 3 1 2 2 0 2 2 1.3 3 Subsidiary 12 3 2 2 2 0 2 2 1.6 3 Subsidiary 13 3 1 2 2 0 2 2 1.3 3 Initial
Rating (E) Ownership
Reputational/ Brand Risk Strategic Fit Operational Fit Track Record Treasury Model Score Final Rating (E) BPI rating (E) Holding B 5 Subsidiary 1 5 0 2 2 0 2 2 1 5 5 Subsidiary 2 3 0 2 2 0 2 2 1 5 5 Subsidiary 3 5 0 2 2 0 2 2 1 5 Subsidiary 4 6 0 2 2 0 2 2 1 5 5 Subsidiary 5 5 0 2 2 0 2 2 1 5 5 Subsidiary 6 5 0 2 2 0 2 2 1 5 5 Subsidiary 7 5 0 2 2 0 2 2 1 5 Subsidiary 8 5 0 2 2 0 2 2 1 5 Subsidiary 9 5 0 2 2 0 2 2 1 5 Subsidiary 10 4 0 2 2 0 2 2 1 5 5 Subsidiary 11 5 1 2 2 0 2 2 1.3 5 Subsidiary 12 8 0 2 2 0 2 2 1 6 5 Subsidiary 13 5 0 2 2 0 2 2 1 5 Subsidiary 14 4 0 2 2 0 2 2 1 5 5 Subsidiary 15 5 0 2 2 0 2 2 1 5 5 Subsidiary 16 5 0 2 2 0 2 2 1 5 Subsidiary 17 5 0 2 2 0 2 2 1 5 5 Subsidiary 18 5 0 2 2 0 2 2 1 5 Subsidiary 19 7 0 2 2 0 2 2 1 6 5 Subsidiary 20 5 0 2 2 0 2 2 1 5 5 Subsidiary 21 5 0 2 2 0 2 2 1 5 Subsidiary 22 7 0 2 1 0 2 2 0.75 6 5
23
Model Analysis Results – Holding C
Model Analysis Results – Holding D
Model Analysis Results – Holding E Initial
Rating (E)Ownership
Reputational/ Brand Risk Strategic Fit Operational Fit Track Record Treasur y Model Score Final Rating (E) BPI rating (E) Holding C 7 Subsidiary 1 7 0 1 2 0 2 2 0.9 7 7 Subsidiary 2 10 0 1 2 0 2 2 0.9 8 7 Subsidiary 3 7 2 1 2 0 2 2 1.5 7 7 Subsidiary 4 3 2 1 0 0 2 2 1 7 7 Initial
Rating (E)Ownership
Reputational/ Brand Risk Strategic Fit Operational Fit Track Record Treasury Model Score Final Rating (E) BPI rating (E) Holding D 3 Subsidiary 1 3 0 1 2 0 2 2 0.9 3 Subsidiary 2 3 0 0 0 0 2 2 0.3 3 3 Subsidiary 3 3 1 1 2 0 2 2 1.2 3 3 Subsidiary 4 1 0 1 2 0 2 2 0.9 3 3 Subsidiary 5 2 0 1 2 0 2 2 0.9 3 3 Initial
Rating (E) Ownership
Reputational/ Brand Risk Strategic Fit Operational Fit Track Record Treasury Model Score Final Rating (E) BPI Rating (E) Holding E 6 Subsidiary 1 6 2 2 2 1 2 1 1.7 6 6 Subsidiary 2 6 2 1 2 0 2 1 1.4 6 6 Subsidiary 3 6 2 1 2 0 2 1 1.4 6 6 Subsidiary 4 6 2 1 2 0 2 1 1.4 6 6 Subsidiary 5 6 2 1 2 1 2 1 1.6 6 6 Subsidiary 6 6 1 1 2 0 2 1 1.1 6 Subsidiary 7 6 1 1 2 0 2 1 1.1 6 Subsidiary 8 6 0 1 2 0 2 1 0.8 6
24
Model Analysis Results – Holding F
Initial
Rating (E)Ownership
Reputational/ Brand Risk Strategic Fit Operational Fit Track RecordTreasury Model Score Final Rating (E) BPI rating (E) Holding F 8 Sub-holding Global 8 Subsidiary 1 8 0 2 2 0 2 2 1 8 Subsidiary 2 8 2 1 2 0 2 2 1.5 8 Subsidiary 3 8 0 2 2 0 2 2 1 8 Subsidiary 4 5 1 1 2 0 2 2 1.2 8 Subsidiary 5 8 1 1 2 0 2 2 1.2 8 Subsidiary 6 8 1 1 2 0 2 2 1.2 8 Subsidiary 7 8 0 2 2 0 2 2 1 8 Subsidiary 8 8 0 2 2 0 2 2 1 8 Subsidiary 9 4 0 2 2 0 2 2 1 8 8 Subsidiary 10 8 1 2 2 0 2 2 1.3 8 8 Sub-holding Industry 8 Subsidiary 11 8 0 1 2 0 2 2 0.9 8 Subsidiary 12 8 0 1 2 0 2 2 0.9 8 Subsidiary 13 8 0 1 2 0 2 2 0.9 8 Subsidiary 14 8 1 1 2 0 2 2 1.2 8 Subsidiary 15 8 2 1 2 0 2 2 1.5 8 8 Subsidiary 16 8 2 1 2 0 2 2 1.5 8 8 Subsidiary 17 8 2 1 2 0 2 2 1.5 8 Subsidiary 18 8 1 1 2 0 2 2 1.2 8 Subsidiary 19 8 2 1 2 0 2 2 1.5 8 Subsidiary 20 8 2 2 2 0 2 2 1.6 8 8 Subsidiary 21 8 1 2 2 0 2 2 1.3 8 Subsidiary 22 8 2 2 2 0 2 2 1.6 8 Subsidiary 23 8 2 2 2 0 2 2 1.6 8 Subsidiary 24 8 2 2 2 0 2 2 1.6 8 8 Subsidiary 25 8 2 2 2 0 2 2 1.6 8 Subsidiary 26 8 2 2 2 0 2 2 1.6 8 Subsidiary 27 8 2 2 2 0 2 2 1.6 8 Subsidiary 28 8 2 2 2 0 2 2 1.6 8 Subsidiary 29 8 2 2 2 0 2 2 1.6 8 8 Subsidiary 30 8 2 2 2 0 2 2 1.6 8 8 Sub-holding participations 8 Subsidiary 31 8 0 0 1 0 2 2 0.6 8 Subsidiary 32 8 2 0 1 0 2 2 1.2 8 Subsidiary 33 8 0 0 1 0 2 2 0.6 8 Subsidiary 34 8 0 0 1 0 2 2 0.6 8 Subsidiary 35 8 0 0 1 0 2 2 0.6 8 Subsidiary 36 8 0 0 1 0 2 2 0.6 8 Subsidiary 37 8 0 0 1 0 2 2 0.6 8 Subsidiary 38 3 0 0 1 0 2 2 0.6 8 8 Subsidiary 39 2 0 0 1 0 2 2 0.6 8 8 Subsidiary 40 8 1 0 1 0 2 2 0.9 8 Sub-holding Tourism 8 Subsidiary 41 8 1 0 1 0 2 2 0.9 8 Subsidiary 42 8 2 0 1 0 2 2 1.2 8 Subsidiary 43 8 0 0 1 0 2 2 0.6 8
25
Model Analysis Results – Holding G
Model Analysis Results – Holding H Initial
Rating (E) Ownership
Reputational/ Brand Risk Strategic Fit Operational Fit Track Record Treasury Model Score Final Rating (E) BPI rating (E) Holding G 6 Subsidiary 1 6 2 1 2 0 2 2 1.5 6 Subsidiary 2 6 2 1 2 0 2 2 1.5 6 Subsidiary 3 6 1 1 2 0 2 2 1.2 6 Subsidiary 4 6 1 1 2 0 2 2 1.2 6 Subsidiary 5 6 2 1 2 0 2 2 1.5 6 Subsidiary 6 6 1 1 2 0 2 2 1.2 6 Initial
Rating (E) Ownership
Reputational/ Brand Risk Strategic Fit Operational Fit Track RecordTreasury Model Score Final Rating (E) BPI rating (E) Holding H 7 Sub-Holding Africa 7 Subsidiary 1 7 0 2 2 0 2 2 1 7 Subsidiary 2 7 0 1 2 0 2 2 0.9 7 Subsidiary 3 7 0 1 2 0 2 2 0.9 7 Subsidiary 4 7 0 1 2 0 2 2 0.9 7 Sub-holding Europe 7 Subsidiary 5 7 1 2 2 0 2 2 1.3 7 Subsidiary 6 7 1 2 2 0 2 2 1.3 7 Subsidiary 7 7 1 1 2 0 2 2 1.2 7 Subsidiary 8 7 2 1 2 0 2 2 1.5 7 Subsidiary 9 7 1 1 2 0 2 2 1.2 7 7 Subsidiary 10 7 1 1 2 0 2 2 1.2 7 Subsidiary 11 7 1 1 2 0 2 2 1.2 7 Subsidiary 12 7 0 1 2 0 2 2 0.9 7 Subsidiary 13 3 1 1 2 0 2 2 1.2 7 4 Subsidiary 14 7 0 1 2 0 2 2 0.9 7 7 Subsidiary 15 7 1 1 2 0 2 2 1.2 7 7 Subsidiary 16 1 0 1 2 0 2 2 0.9 7 7 Subsidiary 17 7 1 1 2 0 2 2 1.2 7 7 Subsidiary 18 7 2 1 2 0 2 2 1.5 7 Subsidiary 19 7 2 2 2 0 2 2 1.6 7 Subsidiary 20 7 2 2 2 0 2 2 1.6 7 Subsidiary 21 7 2 2 2 0 2 2 1.6 7 Subsidiary 22 7 2 2 2 0 2 2 1.6 7 Subsidiary 23 7 2 2 2 0 2 2 1.6 7 7 Subsidiary 24 7 2 2 2 0 2 2 1.6 7 Subsidiary 25 7 2 2 2 0 2 2 1.6 7 Subsidiary 26 7 2 2 2 0 2 2 1.6 7