Mergers and Acquisitions
An Oil & Gas Equipment Sector Case Study
Siemens’ acquisition of Dresser-Rand
Andreas Scharf – 152413040
June 2015
Advisor: António Borges de Assunção
Dissertation submitted in partial fulfillment of the requirements for the degree of Master in Finance, at the Universidade Católica Portuguesa, June 2015.
Abstract
In September 2014, the German engineering and manufacturing company Siemens announced the plan to acquire the American manufacturer of oil and gas equipment and service provider, Dresser-Rand for $83 a share.
In a standalone valuation, Siemens can be valued between € 87 and €104 and tends to be undervalued. Contrarily, Dresser-Rand appears to be overvalued, since the current market price of $68 is at the upper valuation range of $36 to $88.1
Additional revenues and reduced costs, ex transaction and implementation costs are worth $141 to $458 million and may add synergies of $1.8 to $6 a share to the standalone value of Dresser-Rand.
Despite the fact that Dresser-Rand fits into Siemens’ Power and Gas division from a strategic point of view and that the M&A sentiment is currently beneficial to tap into the M&A market, an acquisition price of $83 seems to be fairly high. Siemens should not realize the deal and offer a premium of 21% to the current market price. The thesis recommends an acquisition price range of $47 to $73.2
This case study shows that the world of M&A is fascinating, but also complex. Bid-prices and valuations often substantially diverge – depending on the strategic fit and potential synergies. The thesis mentions shareholder pressure, unsuccessful recent acquisition activities, legal & technological burden, high cash balances and personal interests as reasons for Siemens’ high premium.
1
Current market prices as of September 1, 2014
Acknowledgements
First and foremost, I would like to express my most sincere gratitude to my supervisor, Professor António Borges de Assunção. His continuous support, availability, share of knowledge and his patience has helped me a lot while working on this master thesis. I could not be more grateful to him.
Moreover, I would like to thank my family and friends for their unconditional support, patience and dedication they had for me.
Last but not least, I am grateful to the organization of Católica Lisbon School of Business and Economics, to all the professors and to my friends I met during the two years. The Master in Finance Program has helped me to find my passion for corporate finance and has helped me to be well prepared for a professional career in this sector.
Table of Contents
1. Introduction ... 1
-2. Literature Review ... 2
2.1 Introduction ... 2
2.2 Valuation Techniques ... 3
2.2.1 Intrinsic Value approach ... 3
2.2.2 External benchmark approach ... 6
2.2.3 Analogical approach ... 6
2.2.4 Patrimonial approach ... 7
2.3 Mergers & Acquisitions ... 7
2.3.1 Introduction ... 7 2.3.2 M&A characteristics ... 8 2.3.2.1 Transaction types ... 8 2.3.2.2 Mode of payment ... 8 2.3.2.3 Target size ... 8 2.3.3 Valuating M&A ... 8 2.3.4 CrossBorder M&A ... 11
2.3.5 Does M&A add or destroy value?... 13
2.3.6 M&A Market Trends ... 14
3. Company and industry background ... 15
3.1 Company Profile Siemens ... 15
3.2 Company Profile DresserRand ... 20
3.3 Oil & Gas Equipment and Services Industry ... 24
3.4 Deal Rationale ... 27
4. Valuation ... 29
4.1 Siemens ... 29
4.1.1 Financial Projections... 29
4.1.2 Discounted Cash Flow Valuation ... 31
4.1.2.1 Free Cash Flow estimation ... 31
4.1.2.2 Weighted Average Cost of Capital ... 33
4.1.2.3 DCF base case valuation ... 33
4.1.2.4 Sensitivity Analysis ... 34
4.1.3 Adjusted Present Value ... 35
4.1.4 Multiples ... 36
4.1.5 Valuation Summary ... 36
4.2 DresserRand ... 37
4.2.1 Financial Projections... 37
4.2.2 Discounted Cash Flow Valuation ... 39
4.2.2.1 Free Cash Flow estimation ... 39
4.2.2.2 Weighted Average Cost of Capital ... 41
4.2.2.3 DCF base case valuation ... 41
4.2.3 Adjusted Present Value ... 43 4.2.4 Multiples ... 44 4.2.5 Alternative Valuation ... 44 4.2.6 Valuation Summary ... 45 4.3 Synergy Valuation ... 46 4.3.1 Introduction ... 46 4.3.2 Operating Synergies ... 47 4.3.2.1 Revenue enhancements ... 47 4.3.2.2 Reduced Costs ... 48
4.3.2.2.1 Research & Development costs ... 48
4.3.2.2.2 Selling, General & Administrative costs ... 49
4.3.3 Other Synergies ... 49
4.3.4 Implementation & Transaction costs ... 50
4.3.5 Synergy Summary ... 51
5. Conclusion ... 52
5.1 Real offer versus theoretical price ... 52
5.2 Implementation Risks ... 53
5.3 Summary ... 56
6. Appendix ... 58
Appendix 1: Valuation approaches... 58
Appendix 2: M&A transaction drivers ... 59
Appendix 3: Crossborder M&A premium ... 60
Appendix 4: Managing Mergers ... 60
Appendix 5: Takeover defense strategies ... 64
Appendix 6: Siemens Business Segments – Revenue & Profitability (2014) ... 65
Appendix 7: Siemens Cost of Debt ... 66
Appendix 8: Oil & Gas Demand and Supply ... 67
Appendix 9: Industry Analysis Porter’s five forces ... 68
Appendix 10: Siemens Working Capital Forecasts (2014 – 2021) ... 69
Appendix 11: FCFF B/S/H/ ... 70
Appendix 12: Beta Estimations ... 71
Appendix 13: Siemens Interest Tax Shield Forecasts (2014 – 2021) ... 72
Appendix 14: Siemens PeerGroup ... 72
Appendix 15: Siemens Analyst Recommendations in Euro (February 2015) ... 73
Appendix 16: DresserRand Depreciation Forecasts (2014 – 2021) ... 74
Appendix 17: DresserRand Working Capital Forecasts (2014 – 2021) ... 74
Appendix 18: DresserRand Capital Structure ... 75
Appendix 20: DresserRand PeerGroup... 76
Appendix 21: DresserRand Transaction Multiples ... 76
Appendix 22: Siemens Financial Statements... 77
Appendix 23: DresserRand Balance Sheet & Income Statement (2009 – 2013) ... 80
-- 1 --
1. Introduction
On September 22, 2014 Siemens AG announced the acquisition of the American supplier of equipment solutions to the oil & gas industry, Dresser-Rand. After several bids, from $66 to $73, Siemens finally offered $83 a share, which amounts to a total transaction value of approximately $7.6 billion. 3
“As the premium brand in the global energy infrastructure markets, Dresser-Rand is a perfect fit for the Siemens portfolio. The combined activities will create a world-class provider for the growing oil & gas markets. With this, Dresser-Rand will become ‘The oil and gas’ company within Siemens and fit right into our Siemens Vision 2020” – Joe Kaeser, President and CEO of Siemens AG.4
When I started the case study, a friendly $83 takeover bid was already in the market and the transaction was expected to be closed in summer 2015. Besides a high acquisition premium of 21%5, slumping oil prices and depreciating Euro to US-Dollar had aroused sharp criticism for the transaction price both, from Siemens’ shareholders and financial press. The controversial debate and the medial presence have motivated me to work on this particular case. The thesis intends to answer the following core questions:
1. From a strategic point of view, does Dresser-Rand add value to the conglomerate business of Siemens? How does the transaction fit into the changing energy business culture from conventional to alternative energy solutions?
2. Is an acquisition price of $7.6 billion reasonable? Can strategic motives and potential synergies justify a premium of 21%?
3. What are potential drivers in the bidding process of this acquisition? Which role embodies the CEO and how can power be effectively managed and controlled in Mergers & Acquisitions (in the following M&A)?
3
Including an additional ticking fee of $0.55 per month from March 2015 onwards
4
Siemens’ official deal announcement, September 22, 2014
- 2 -
The thesis is structured into four main parts:
In the beginning, a Literature Review provides the reader with the necessary knowledge of valuation techniques and methodologies, as well as selected M&A characteristics. Thereafter, the relevant industries and companies are described, so that the reader is able to understand the strategic rationale behind the transaction and has comprehensive background information to understand the case.
The third part focuses on valuation. First, on the basis of different valuation techniques, target and acquirer are valued independently in a standalone scenario. Second, potential synergies are first identified and quantified and then added to the standalone valuation. Afterwards, a thorough comparison of the standalone valuation with the ex-acquisition valuation, including synergies is drawn.
Finally, the results are summarized and a potential acquisition of Dresser-Rand is evaluated from a strategic and more importantly financial point of view. The conclusion intends to answer the core questions and finishes with a transaction recommendation. The underlying data of this case study is predominantly as of the beginning of September 2014, when Siemens had not yet announced the deal.
2. Literature Review
2.1 Introduction
The Literature Review intends to provide readers with different backgrounds with the basic knowledge, which is crucial to understand the case. The section should not be considered as extensive and profound. For extending knowledge on valuation, further readings through contemporary valuation literature are advisable.
The Literature Review consists of two main parts:
Valuation Techniques: The first part focuses on basic theory methods of evaluating companies.
Merger & Acquisitions: The second part covers special characteristics of
evaluating M&A and different views and opinions from literature. The cardinal question, whether or not M&A adds value is also discussed. Besides that, this
- 3 -
part includes a current M&A activity section, which helps the reader to classify a potential Dresser-Rand acquisition into the current M&A market environment.
2.2 Valuation Techniques
One of the key performance drivers of companies is the evaluation of corporate actions. Whether a company allocates resources for merging with- or acquiring other firms, investing in projects, entering strategic partnerships or simply launching products, a thorough valuation is absolutely crucial. A mispricing based on an incorrect valuation may lead to dramatic negative consequences for the company and its competitiveness. Therefore, a proper valuation coins the success of a company.
Theory distinguishes between the following four fundamental valuation approaches: 1. Intrinsic Value approach – A company is worth what it will generate.
2. External benchmark approach – A company is worth what others buy/sell it for. 3. Analogical approach – A company is worth what other companies are worth. 4. Patrimonial approach – A company is worth what it owns.
In practice, a thorough valuation comprises of a mix of several methods. Eccles, Lanes & Wilson (1999) lay stress on the fact, that there is no single correct price. In general, valuation can be seen as a function of cash, timing and risk (Luehrmann 1997). The majority of literature considers the intrinsic method superior to other approaches because it values the company on the basis of future cash flows and looks at the economic value creation. In contrast to that, the other three approaches consider the present or past (Appendix 1).
2.2.1 Intrinsic Value approach
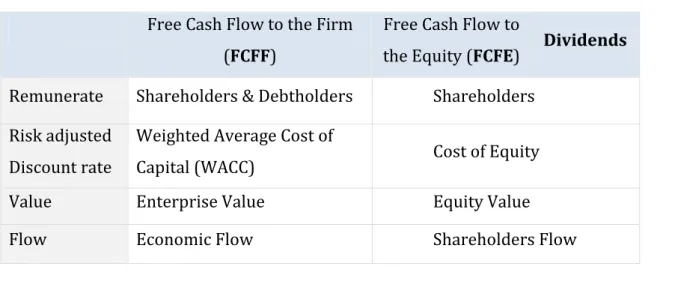
Evaluating a company by estimating the net present value of future generated cash flows has become the most popular approach for corporate assets during the 1970s (Luehrman 1997). Estimated future cash flows, which can be either Free Cash Flow to the Firm, Free Cash Flow to the Equity or Dividends, are discounted to the present at a risk-adjusted rate.
- 4 -
Table 1: Overview of cash flow types and corresponding discount rates
Free Cash Flow to the Firm (FCFF)
Free Cash Flow to
the Equity (FCFE) Dividends
Remunerate Shareholders & Debtholders Shareholders
Risk adjusted Discount rate
Weighted Average Cost of
Capital (WACC) Cost of Equity
Value Enterprise Value Equity Value
Flow Economic Flow Shareholders Flow
The FCFF includes funds which can be distributed to shareholders and debtholders. A simplified concept is:
Table 2: The concept of Free Cash Flow to the Firm (FCFF)
Operating Results
after Tax Non-cash items Growth financing
EBIT – Taxes on EBIT
+ Depreciation
+ Provisions considered as reserve
- Investments - Δ Working Capital
Deducting interest and principal payments from the FCFF isolates the cash flows solely to shareholders:
FCFE = FCFF – interest (after taxes) – principal payments
Applying the Gordon Growth Model, namely calculating the net present value of future dividend payments to evaluate a company’s price is less popular than the Discounted Free Cash Flow method. This concept should be used exclusively for companies with constant and reliable dividend payout policies.
The estimated future cash flows are discounted at a rate which incorporates the opportunity cost of capital for a similar investment in terms of risk and return. The most
- 5 -
widely used discount rates are the Cost of Equity and the Weighted Average Cost of Capital (WACC).
The Capital Asset Pricing Model (CAPM) is the most common methodology for estimating the cost of equity and is defined as:
Table 3: Capital Asset Pricing Model (CAPM)
Cost of Equity Risk Free Rate Levered Beta Equity Market Risk Premium ke = rf + β x (rf - rm)
The WACC is a discount rate which incorporates the costs of different sources of financing, weighted by the company’s capital structure.
WACC = D/V * kd * (1-T) + E/V * ke + P/V * kp
According to Koller, Goedhardt & Wessels (2010), the after-tax cost of debt can be estimated by the yield to maturity on long-term debt.
The WACC delivers reliable results when capital structures remain constant over time. However, in M&A, additional capital is often raised to finance a transaction and therefore capital structures may change frequently. In order to overcome this deficit, theory suggests to either calculate a WACC for each year of the explicit period or to use the Adjusted Present Value approach (APV).
The APV method is a popular alternative to the WACC: Among others, Koller, Goedhardt & Wessels (2010) recommend the APV approach for changing capital structure valuations. According to Luehrman (1997), the APV adds information in comparison to the WACC.
D/V = proportion of total value (V) claimed by debt (D) E/V = proportion of total value (V) claimed by equity (E)
P/V = proportion of total value (V) claimed by preferred stock (P) kd = required rate of return on debt capital
ke = required rate of return on equity capital kp = required rate of return on preferred stocks T = marginal corporate tax rate
- 6 -
The APV method separately valuates operating and financing effects. At a first step, the company is valued as if it was financed entirely with equity. After that, the financing effects such as interest tax shields, costs of financial distress, subsidies, hedges or issue costs are added. Thereby, the different sources of value creation can be evaluated separately.
2.2.2 External benchmark approach
Following the external benchmark valuation approach, the company is worth what other market participants are willing to pay for it. The approach requires a high level of transparency and market efficiency. In times of bubbles or crises, the external benchmark approach is strongly limited and delivers less accurate and fair valuations. However, the approach can be a useful tool to get a first insight, how markets assess a company.
2.2.3 Analogical approach
The analogical method or relative valuation method evaluates a company on the basis of other companies or transactions, similar in terms of their business and risk and return profile. The method implies that a company is worth what other companies or transactions are worth. The approach is a popular proxy method because the use is straight-forward and quickly applicable. With the use of multiples, either market multiples or transaction multiples, the value of a company can be derived from its peer group. There are numerous multiples such as revenue, earnings or cash flow multiples. Goedhardt, Koller & Wessels (2010) argue that in contrast to net income multiples, cash-flow multiples are not affected by the capital structure, non-cash charges or taxes. As a consequence cash flow multiples deliver more accurate results. Moreover, Sarin, Koeplin & Shapiro (2000) see multiples derived from EBIT as a good proxy for free cash flows and consequently the most reliable multiple. Kaplan & Ruback (1996) found that comparable-based estimates add explanatory power to the Discounted-Cash-Flow method.
The biggest deficit of the analogical method is that peer groups are often not suitable and representative. Furthermore, in the case of transaction multiples, it is often difficult
- 7 -
to find similar transactions, especially if the transaction is unique. Market multiples need to be coherent in terms of the underlying accounting standards and the definition of the multiple itself.
2.2.4 Patrimonial approach
The Patrimonial method takes into consideration what a company owns. The value is determined by the company’s assets and liabilities. The underlying financial statement is solely the balance sheet and herein positions are valued by restated net worth valuations. This method is a backward looking approach. Nevertheless, it delivers useful information in times of bubbles, in which market values may enormously exceed book values.
2.3 Mergers & Acquisitions 2.3.1 Introduction
According to Reed, Laloux & Nesvold (2007), the difference between a merger and an acquisition is that a merger occurs when “a corporation is combined with and disappears into another corporation”. An acquisition describes the transfer of ownership.
The reasons for acquiring or merging with other companies to form a new entity are numerous. The most important rationale is the creation of additional growth, both by additional revenues and by higher profitability (Gaughan 2005). M&As are accomplished to create and to implement economies of skill, scale and scope. Apart from that, M&A transactions can also be undertaken to improve the financial structure, mainly by tax benefits or by taking advantage of additional debt capacity. According to Roberts, Wallace & Moles (2010), M&A transactions are driven by inter alia globalization, stock markets, political reasons or industry and sector pressure (Appendix 2).
- 8 -
2.3.2 M&A characteristics 2.3.2.1 Transaction types
Damodaran (2002) divides M&A operations into four transaction types: 1. Merger: A target firm is integrated into the acquiring firm.
2. Consolidation: A new entity is created by combining the acquiring firm with the target firm.
3. Tender offer: The takeover offer is directly addressed to the shareholders of the target firm, bypassing the board of directors.
4. Acquisition of assets: Selected assets of the target firm are transferred into the acquiring firm.
2.3.2.2 Mode of payment
The mode of payment affects the transaction value. According to Sirower & Sahni (2006), stock payments may have negative signaling effects, as the acquirer aims to share the risk of materializing synergies with the target. In case the acquirer owns high amounts of cash and believes the own company is underpriced, the transaction is predominantly financed with cash. Rappaport & Sirower (1999) found out, that on average, cash transactions result in higher post transaction shareholder returns.
2.3.2.3 Target size
Not only the mode of payment, but also the target size influences the success of a transaction. In general, the integration and implementation of synergies is easier for smaller firms. Damodaran (2005) mentions the fact, that a merger of equals could be more difficult to be successful due to cultural clashes.
2.3.3 Valuating M&A
Gaughan (2005) classifies mergers into three categories: 1. Horizontal - Mergers between two competitors.
- 9 -
3. Conglomerate – Mergers which are neither horizontal nor vertical.
In order to evaluate a deal as successful and therefore as value adding, the value of the merged companies has to exceed or at least equal the sum of the standalone valuations of target and acquirer.
Control and synergies are two possible value sources in M&A. Martin & McConnel (1991) described operational synergies and the disciplining of managers of the target firm as the key wealth drivers in M&A. In addition to that, Shivdasani & Zak (2007) claim, that the ability to make business decisions is also a value generator.
Additional value requires the creation and implementation of synergies. Eccles, Lanes & Wilson (1999) divide the true value of an acquisition into intrinsic value, market value, purchase price and synergy value.
The concept of true value clearly reveals why it is insufficient to pay the market value for an acquisition. To compensate target shareholders, a premium to the market value is indispensable. Furthermore, the acquirer shareholders would not accept an acquisition if they did not benefit from value transfer to their own. Consequently, the internal valuation, including synergies has to exceed the purchase price.
Chart 1 – The true value of an acquisition (Eccles, Lanes & Wilson 1999)
Synergy Value
Intrinsic Value
Market Value
Value GAP Value to target shareholders
Value to acquirer shareholders Purchase Price
- 10 -
Nevertheless, the question why bidders pay abnormal synergy premiums emerges?6 Damodaran (2005) suggests three reasons:
First, the biased evaluation process creates conflict of interests and leading advisors fail in thoroughly evaluating the synergies. Second, the M&A business is a people business, so that managerial hubris, such as managerial pride or personal bidding competition, is a reason for misevaluating synergies. Third, companies do not have adequate plans for delivering the synergy and they overestimate the transaction potential before the transaction.
Eccles, Lanes & Wilson (1999) classify synergies into five types: cost savings, revenue enhancements, process improvements, financial engineering and tax benefits.
Cost savings is the most common type of synergy and tend to be high in horizontal mergers. There are two common problems which come along with synergies through cost savings: First, the definition and consequently the categorization of costs differ across companies. Second, acquirers tend to be too optimistic in terms of eliminating corporate or divisional administrative costs.
Revenue enhancements are generated from the combination of different strengths of acquirer and target and they appear when it is possible to achieve a higher level of sales growth. Like cost savings, synergies from revenue enhancements are difficult to be estimated because they are strongly affected by external factors, such as the combined customer base or competitors reaction to the acquisition.
Process Enhancements result both, in cost savings and revenue enhancements by transferring best practices and core competencies from one company to another.
Financial benefits through reducing the cost of capital, optimizing the funding access or improving capital and cash management can be another advantage of a merger and may result in remarkable synergies.
Synergies resulting from tax benefits are one of the most difficult synergies to assess and often a barrier to justify a deal. The overall goal is to keep the overall tax rate of the
- 11 -
combined company equal or below the blended tax rates of the target and acquirer before the deal.
The value of each synergy depends on the particular implementation skills of the acquirer. The ability to integrate the target´s assets remarkably coins the success of a deal. In conclusion, the valuation of synergies is often controversially discussed and for external parties, it is may be difficult to understand why high premiums are paid. Besides that, it may take years to observe the real outcome of an M&A transaction which makes an assessment at the completion date inappropriate. Damodaran (2005) comes to the conclusion that mergers are “often promised and seldom delivered”.
2.3.4 Cross-Border M&A
The popularity of cross-border M&A has been significantly increasing since the 1990s and the globalization waves. From around $100 billion in the late 1980s to $720 billion in 1999, the value of cross border M&A reached almost $800 billion in 2013. Over the last 10 years, cross-border deals accounted for as much as 30 to 50% of all M&A deals. Interestingly, since 2005, cross-border deals have been requiring on average 5% more premium than all M&A deals did (Appendix 3).7 Higher premiums might reveal that cross-border targets are attractive - acquirers are willing to pay more. Cross-border targets could also be underpriced and relatively cheap. However, higher premiums also signal higher risks – mainly economical (currency instability, volatility instability), political and infrastructural (Marsh, Mercer, & Kroll, 2008). Another reason for higher premiums may be target shareholders requiring a premium to accept the deal to be compensated for potential skepticism.
Increasing globalization has created a substantial appetite for international growth over the last 20 years. Acquiring firms with the primary goal of developing new markets, applying new technologies or attracting new customers beyond own business areas have become an indispensable part of M&A.
Cross-border valuation requires special treatment of tax rates (domestic versus foreign), currencies and differences in accounting standards or risks such as foreign exchange or political risk in general.
7 Data source: Bloomberg
- 12 -
Interestingly, cross-border transactions are predominantly cash financed because of tax, legal and flow back limitations, associated with stock payments.
Furthermore, cross-border M&A requires special management of currency risk, which can be classified into three stages:
1. Pre-Close risk: Fluctuations between the signing of the deal and the final closing. 2. At-Close risk: Refers to the repatriation of the cash flows of the target company
(e.g. dividends or inter-company loan interest).
3. Post-Close risk: Risk which arises after the transaction, such as cost vs. revenue mismatches, transnational risk (accounting differences) or risk, related to ongoing cross-border cash flow.
Zenner, Matthews, Marks and Mago (2008) characterized the following driving and hindering forces for cross-border M&A transactions:
Table 4: Driving and hindering forces for cross-border M&A transactions
The valuation of cross-border transactions is more complex than in domestic scenarios. Multiple and comparable valuation methods may have limited application because comparable companies or transactions do not easily incorporate specificities such as synergies, risk or taxes in the context of cross- border valuations. Zenner, Matthews, Marks & Mago (2008) suggest two approaches for valuing cross-border mergers most effectively.
Forces Driving cross-border M&A Forces Hindering cross-border M&A
Long-Term drivers Protectionist Ssentiments
Globalization Tax Complexities
Diversification Cultural Factors
Deregulation Equity Flowback
Short-term catalysts High Relative Valuations Cheap USD
- 13 -
Table 5: Valuing cross-border mergers (Zenner, Matthews, Marks & Mago 2008)
The authors also found out that, at least in the short run, cross-border acquirers tend to outperform domestic acquirers. One of the reasons is the way of financing the deal. Cross-border deals are predominantly cash deals which have more positive signals than stock deals.
In normal market environments, premiums paid for cross-border deals are only moderately higher than the average premium for all deals. However, in stressed markets, the premium is significantly higher (Appendix 3). This phenomenon reveals that cross-border deals incorporate more risk and therefore require an additional premium. Over the last 10 years, the premium was around 33% for cross-border transactions, compared to 28% for all deals.8
2.3.5 Does M&A add or destroy value?
As firms often pay high premiums and have post-transaction difficulties in implementing synergies, the fashionable view on mergers is that “M&A is a loser´s game” and consequently M&A destroys value (Grubb and Lamb 2000).
Why do firms still like tapping into the M&A market and accept abnormal prices for potential targets if the game is a “loser´s game”? The fashionable view appears to be wrong and M&A pays on average, according to Bruner (2004). Recent research about the success of M&A deals often do not use a representative sample of M&A deals leading to the bias that a few extremely unprofitable deals distort the findings. In addition to that,
8 Data source: Bloomberg
Approach A Approach B
1. Estimation of future cash flows in foreign currency
Estimation of future cash flows in foreign currency 2. Discount cash flows with
target/local WACC
Conversion of cash flows to home currency
3. Convert Net Present Value at the spot foreign exchange rate
Discount cash flows with acquirer/home WACC
- 14 -
the net economic gain, either the weighted average returns or the absolute dollar value returns of acquirer and target as a sum, is predominantly positive. Moreover, the asset productivity of the acquiring firms, measured as higher operating cash flows relative to peers, improved significantly after the deals. Solely looking at the post-merger share price to measure the profitability of mergers appears to be incompletely wrong. Bruner (2004) suggests the investor´s required rate of return as a benchmark and defines a value created merger as a transaction, in which the investor´s investment return exceeds the required rate of return.
2.3.6 M&A Market Trends
In 2013, global M&A deal volume increased by 12% and the number of deals by 2% compared to 2012. In 2014, the M&A market is on a significant upward trend. For the first time since the second quarter of 2007, the quarterly volume in Q2 2014 was above a trillion US-Dollars. Compared to the first three months of 2013, total deal count increased by 20% and volume by as much as 70% (Chart 2). Companies have increasing confidence in M&A and less uncertainty and fear for new deals. According to an Ernst & Young Survey, the appetite for M&A is on a 5-year-high (Baigorri 2015). Moreover, the acquisition premium which is often considered a good indicator for transaction risk is with 20%-25% significantly lower and less fluctuating than in the years after the crises (Appendix 3).
The reason for the positive market sentiment and recovery of the M&A market can be explained by a reviving world economy, historically low interest rates and as a consequence high cash balances companies are holding.
According to the KPMG 2014 M&A Outlook Survey Report, the main reasons of acquiring other firms are opportunistic (i.e. targets appear to be cheap and become available) and the expansion of customer bases and geographic reach. Entering into new lines of businesses or products are less important reasons. Industries with structural changes and in which regulations are prevalent such as Technology/Media/Telecom and Healthcare/Pharmaceuticals but also Energy/Oil & Gas are expected to be most attractive for M&A deals in 2014.
- 15 -
Chart 2: M&A total deal volume in $ and total deal count by quarter
In terms of regions, developing countries are expected to be attractive target regions since the high growth potential, but also the opportunity to gain technological knowhow lures acquirers from developed countries (Marsh, Mercer & Kroll 2008).
Nevertheless, as M&A appear in waves of activity, regulatory and political reforms, technological changes, fluctuations in financial markets, the role of leadership and tension between scale and focus (B. Wasserstein, 1998) can quickly change the current overall positive market sentiment.
3. Company and industry background
3.1 Company Profile Siemens
Siemens is a German engineering and manufacturing company, positioned along the electrification value chain. The company was founded in 1847, employs 343.000 people and operates in 190 countries9. Albeit more than half of the revenue is generated in Europe, Siemens has strong business activities overseas, both in Asia and Americas. In 2014, Asia & Australia and Americas accounted for 20% and 26% of the overall revenue.
9 www.siemens.com/investor - Annual Report 2013
0 1000 2000 3000 4000 5000 6000 7000 8000 0 200 400 600 800 1000 1200 1400 1600
I II III IV I II III IV I II III IV I II III IV I II III IV I II III IV I II III IV I II III IV I II III IV I II III
2005 2006 2007 2008 2009 2010 2011 2012 2013 2014 Dea l Count Deal v olume in $ billion
- 16 -
The Munich-headquartered global player divides its business into the four core divisions Energy, Infrastructure and Cities, Industry and Healthcare and the following nine sub-divisions:
Energy - Power and Gas:
The Power and Gas division serves customers such as utilities, independent power producers, engineering, procurement or construction companies with power generation, using fossil or renewable fuels for energy production. With more than €12.5 billion in revenue, operating income of €2.2 billion and operating profit margins above 17%10, Power & Gas is one of the most important components of Siemens´ business portfolio. Wind Power and Renewables:
Wind Power and Renewables delivers clean, renewable energy from offshore and onshore installations. As the segment serves both, business and environmental needs, it helps Siemens to be well positioned for the energy transformation process from fossil fuels to environmental friendly renewable energy solutions. Although this segment has limited profitability yet, it has high strategic future potential.
Energy - Power Generation Services:
Power Generation Services include factory or field services support, maintenance, repairs, replacements, modernizations and upgrades of components. The division is one of the leading service partners worldwide and helps utility firms, oil & gas and industrial processing industries to optimize their business.
Energy - Energy Management:
Energy Management offers clients products, systems, solutions and services for economical and reliable transmission and distribution of electrical power. Although the division had more than €10 billion revenue in 2014, it is critical for Siemens because of the lack of profitability. Operating Income was negative in 2014.
- 17 -
Energy - Building Technologies:
Building Technologies is the world market leader for safe, energy efficient and environmentally friendly buildings and infrastructure. The sub-division offers e.g. fire safety, security, building automation, heating or ventilation and air conditioning.
Infrastructure and Cities - Mobility:
This segment is responsible for the efficient and integrated transportation of people and goods by rail and road. Apart from the full range of vehicles, the mobility section offers infrastructure efficiency solutions such as signal and control technologies or road traffic control and information systems.
Industry - Digital Factory:
Digital Factory is responsible for providing hardware, software and technology-based services to support companies in their manufacturing process. The segment is highly profitable with operating margins above 18% (2014) and consequently absolutely crucial for Siemens’ business portfolio.
Industry - Process Industries and Drives
Process Industries and Drives supports the client in improving reliability, safety and efficiency of products, processes and plants and provides additional value for customers. In 2014, revenues were almost reaching €10 billion, however profitability was relatively low with around 8%.
Healthcare
Siemens’ Healthcare segment forms one of the world´s largest suppliers of technology to the healthcare industry and is a leader in medical imaging, laboratory diagnostics and healthcare IT. Moreover, Healthcare provides clinical consulting and training. The division had 43.000 employees worldwide, revenue worth €11.7 billion and profits of more than €2 billion in the fiscal year 2014. Consequently, Healthcare is substantial for Siemens´ portfolio.
- 18 -
From a financial point of view, Siemens had been able to stabilize its profitability over the last five years. With constant sales figures and increasing net profits (CAGR of 16% from 2009 to 2013), Siemens managed to sustainably overcome the implications of the financial crisis (Table 6).
Siemens Total Debt/Total Capital Ratio had been relatively constant between 38% and 43% over the last five years, which is in line with the competitors’ average of 37%.11 In addition to that, the company has remarkably cheap access to debt and currently refinances itself with a weighted cost of market debt at 1.37%12 (Appendix 7).
Table 6: Siemens key financials 2009-2013
On September 1, 2014 common equity was worth €84.205 million and Siemens’ stock price had been outperforming the benchmark Index DAX 30 since January 2010 (Chart 3). The company’s historic stock prices have a beta with the DAX 30 index of 0.70.13
11 Average Total Debt / Total Capital Ratio Peer Group Siemens, as of August, 28 2014
12 Calculated as weighted yield to maturity by notional amount, converted into Euro as of 01.09.2014 13 Beta calculated with five year weekly return data (Appendix 12)
Siemens - Consolidated Data (€ Million) 2009 2010 2011 2012 2013 CAGR Financials Sales 76.651 68.978 73.515 78.296 75.874 0% EBITDA 9.196 9.262 10.755 9.614 8.099 -3% EBITDA Margin 12,0% 13,4% 14,6% 12,3% 10,7% EBIT 6.272 6.946 8.105 6.778 5.838 -2% EBIT Margin 8,2% 10,1% 11,0% 8,7% 7,7% Net Profit 2.292 3.899 6.835 5.053 4.087 16% Profit Margin 3,0% 5,7% 9,3% 6,5% 5,4%
Cash & Near Cash 10.159 14.108 12.468 10.891 9.190 -2%
Total Assets 94.926 102.827 104.243 108.280 101.938 2%
Working Capital 7.124 9.569 9.253 9.492 9.070 6%
Long Term Debt 18.940 17.497 14.280 16.880 18.509 -1%
Ratios
Return on Assets 2% 4% 6% 4% 4% 14%
Return on Common Equity 9% 14% 21% 13% 15% 14%
Current Ratio 1,2 1,2 1,2 1,2 1,2 1%
Quick Ratio 0,7 0,7 0,6 0,6 0,7 1%
Total Debt/Total Capital 41,8 42,3 38,6 41,4 43,4 1%
- 19 - Investor tyjlklkjlp e Institutional 64% Private 19% Unidentified 11% Siemens Family 6% Germany 27% US 21% UK 11% Unidentified 11% Rest of World 9% Switzerland 8% France 8% Rest of Europe 5% 37.000 47.000 57.000 67.000 77.000 87.000 -20% 0% 20% 40% 60% 80% 2010 2011 2012 2013 2014 Si em en s M ar ke t Ca pi ta liz at io n in € m ill io n Sh ar e pr ic e ch an ge in %
Siemens Dax Index
Chart 3: Siemens stock price performance vs. DAX 30 (January 2010 – September 2014)
The Munich-based firm has 882 million shares outstanding and a free float of 85.9%. The largest shareholders are Siemens Family (6%), Blackrock (6%), Qatar Holdings (3%) and Norges Investment Management (2%).14
Chart 4: Siemens shareholder structure by investor type and region
As of September 2014
In order to attain inorganic growth, Siemens regularly taps into the M&A market with a focus on smaller to medium sized targets. The most remarkable deals by value since
14 Adjusted by Siemens‘ 5% own shares, as of September 2014
Investor Region Investor Type By investor type By investor region
- 20 -
2010 are Invensys Rail LTD (GBP 1.742 million), Connectors and Measurements Divisions (€470 million) and Siteco Lighting GmbH (GBP 254 million). Since the company is operating on a global basis, acquisition targets are predominantly foreign companies. Siemens thereby gains access to new markets and is able to realize growth. Strategic Outlook:
In the context of the strategic focus “Vision 2020”, Siemens’ goals for the near future are:15
1. Driving Performance by cost reduction and business excellence (cost reduction of €1 billion).
2. Underperforming businesses fixed. 3. Solid execution of financial target system:
a. Capital efficiency: ROCE 15-20%. b. Growth > most relevant competitors. 4. Global and decentralized management structures.
5. Partners of choice for customers (Net Promoter Score16 up by >= 20%).
6. Employer of choice (Siemens Engagement Survey. Employee Engagement Index, Leadership and Diversity Index: >75%).
7. Ownership culture: Increase the number of employee shareholders by at least 50%.
3.2 Company Profile Dresser-Rand
Dresser-Rand is a Houston based global manufacturer of oil and natural gas equipment and service provider. The company´s products and services include the fields of oil and gas production, high pressure field injection and enhanced oil recovery pipelines, refinery processes, natural gas processing and petrochemical production. Apart from that, Dresser-Rand operates in the market of power generation and its associated technologies such as biomass, waste-to-energy or compressed air energy storage. The company was founded in the mid-1800s and went public in 2005.
15
Siemens – Vision 2020, JP Morgan Pan-European Capital Goods CEO Conference, June 2014
- 21 - 50 % 32 % 68 %
The business is divided into New Equipment and Aftermarket Parts and Services. New Equipment e.g. includes steam turbines, gas turbines or centrifugal and reciprocating compressors. Aftermarket Parts and Services offers the whole spectrum of service and support such as replacement parts, equipment installation or product training. Sales for both areas are almost at the same level of around $1.5 billion. However, the Aftermarket Parts and Services segment is more profitable with profit margins of around 20%, twice as high as in New Equipment. Moreover, the Aftermarket Parts and Services segment is less sensitive to business cycles and therefore Dresser’s attractive business segment.
Chart 5: Dresser-Rand revenue and operating income breakdown by business segment (2013)
New Units Aftermarket Parts and Services
The company operates on a global basis, earning more than two thirds of its revenue outside the domestic market, North America. Apart from North America (32%), Europe (24%) and Latin America (16%) are the most important markets in terms of revenue.17 With respect to revenue by End-Markets, Gas Transmission accounts for 43% of the revenue followed by Refining and Chemical (25%) and Oil & Gas Production (21%).
Chart 6: Dresser-Rand revenue by region and end-market
17 Dresser-Rand, Annual Report 2014
Revenue Operating Income Region End-Market Revenue North America 32 % Asia Pacific 15% Middle East/Africa 13% Gas Transmission 43% Refining and Chemical 25% Oil and gas
production 21% Environmental 11% 50% 50% 32% 68% Latin America 16% Europe 24% Operating income
- 22 -
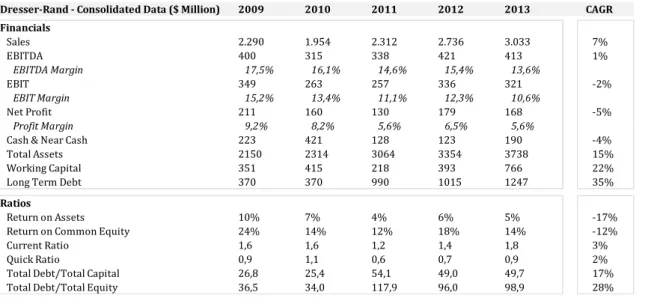
Dresser-Rand - Consolidated Data ($ Million) 2009 2010 2011 2012 2013 CAGR Financials Sales 2.290 1.954 2.312 2.736 3.033 7% EBITDA 400 315 338 421 413 1% EBITDA Margin 17,5% 16,1% 14,6% 15,4% 13,6% EBIT 349 263 257 336 321 -2% EBIT Margin 15,2% 13,4% 11,1% 12,3% 10,6% Net Profit 211 160 130 179 168 -5% Profit Margin 9,2% 8,2% 5,6% 6,5% 5,6%
Cash & Near Cash 223 421 128 123 190 -4%
Total Assets 2150 2314 3064 3354 3738 15%
Working Capital 351 415 218 393 766 22%
Long Term Debt 370 370 990 1015 1247 35%
Ratios
Return on Assets 10% 7% 4% 6% 5% -17%
Return on Common Equity 24% 14% 12% 18% 14% -12%
Current Ratio 1,6 1,6 1,2 1,4 1,8 3%
Quick Ratio 0,9 1,1 0,6 0,7 0,9 2%
Total Debt/Total Capital 26,8 25,4 54,1 49,0 49,7 17%
Total Debt/Total Equity 36,5 34,0 117,9 96,0 98,9 28%
Over the last five years, Dresser-Rand had been able to increase sales by 7% annually. Nonetheless, net profit was not in line with the sales increase. Furthermore, the company had a constantly increasing level of debt. Total Debt to Total Capital increased by 85% and Long Term Debt by even 237% over the last five years.
Table 7: Dresser-Rand key financials
On September 1, 2014 Dresser-Rand’s common equity was worth $5.3 billion. The firm´s biggest shareholders were Blackrock (8.42%), Vanguard Group (6.14%) and Janus Capital Management (6.07%).
The shares of Dresser-Rand significantly outperformed its benchmarks. In particular, over the last six months, Dresser-Rand performed better than the Dow Jones, Dow Jones Sub index for Oil and Gas and the S&P Oil and Gas Equipment and Services Select Industry Index. The stock price of Dresser-Rand may have already incorporated takeover rumors. Dresser-Rand’s beta with the S&P Index is 1.47 (Appendix 12). The company’s payout policy focuses on retaining earnings instead of paying dividends. Since the IPO in 2005, there has not been any dividend payment.
- 23 -
3 months 6 months 1 years 2 years 3 years 4 years
Dresser Rand +13,23% +27,6% +13,7% +36,9% +63,3% +95,1%
Dow Jones Industrial Index +2,3% +4,8% +15,4% +30,6% +47,2% +70,7% Dow Jones Subindex - US Oil&Gas +2,6% +12,1% +18,8% +33% +49,2% +85,6% S&P Oil&Gas Equipment and
Services Select Industry Index -1,6% 2,9% +15% +40% +27,6% +75,4%
-20% 0% 20% 40% 60% 80%
SPSIOS Index WTI BRENT Dresser-Rand
WTI Brent SPSIOS Index 0,65 0,05 Dresser-Rand 0,54 -0,03
Table 8: Dresser-Rand share price – benchmark comparison as of August 29, 2014
Dresser-Rand’s business model highly depends on the oil industry market sentiment. Consequently, the financial success of Dresser-Rand is linked to oil prices. A three-year correlation analysis based on weekly returns reveals that the stock of Dresser-Rand is correlated with WTI-oil (+ 0.54). Interestingly, Dresser-Rand’s shares are not correlated with Brent-oil (-0.03). This phenomenon can be explained by the fact, that Dresser-Rand is an American based firm and their business focuses on the American type of oil - WTI. Since July 2014, when oil prices started to decrease and rumors of Siemens’ takeover plan could have been in the market, the stock price movement has been more volatile and correlation with WTI is less positive. (Chart 7)
- 24 -
The firm’s key strategic objectives are:
1. Increase Sales of Aftermarket Parts and Services to the Existing Installed Base. 2. Expand Aftermarket Parts and Services Business to Non-Dresser-Rand
Equipment. 3. Grow Alliances.
4. Expand Performance-Based Long-Term Service Contracts. 5. Introduce New and Innovative Products and Technologies. 6. Improve Profitability.
7. Selectively Pursue Acquisitions.
3.3 Oil & Gas Equipment and Services Industry
The Oil & Gas Equipment and Services Industry operates as a supplier for the Oil & Gas Refinery and Extraction Industry. The industry is closely related to the economic condition of its clients and therefore to oil and gas prices. The S&P Sub index, Oil & Gas Equipment and Services18 has a relatively strong three year correlation coefficient with WTI (+0.65).19 Consequently, WTI-oil can be considered one of the main industry drivers and makes the industry cyclical and volatile (Chart 7).
Although the share of Oil & Gas in total consumption decreased from 62% in 1973 to 56% in 2012, Oil & Gas is still the most consumed fuel worldwide and supplies approximately 5000Mtoe (Chart 8).20
Demand for Oil & Gas has been steadily increasing. Unconventional extraction methods such as hydraulic fracturing have made gas more attractive and new resources became available. Interestingly, the excess capacity is significantly higher for oil than for gas. Since 2007, the demand for gas has been exceeding the supply (Appendix 8). Until 2035, it is expected that renewable energy and natural gas meet approximately 66% of incremental energy demand.21 As Fossil Fuels are limited, new technologies and extraction and refinery methods will play a more substantial role in the future. There is a huge demand for highly specialized equipment. The Oil & Gas Field Equipment
18 Bloomberg Ticker SPSIOS Index 19
Correlation measured with 3-year-weekly returns
20
International Energy Agency, 2012
21 International Energy Agency forecasts
- 25 -
Industry is a key part in the Oil & Gas value chain and can be considered the key future driver of the whole Oil & Gas industry.
Chart 8: Fuel shares of total final consumption (1973 vs. 2012)
Data Source: International Energy Agency, 2012
Applying the concept of Porter’s five forces to analyze the level of competition within the industry helps to find out, that the competitive rivalry in the Oil & Gas Equipment and Services Industry is relatively low (Appendix 9):
Threat of new Entrants:
The threat of new entrants can be considered low, as multiple high entry barriers exist. The industry is characterized by high capital and technological requirements and a need for highly specialized workers and industry know how. Moreover, strict and long-term refinery extraction service rights and contracts, as well as economies of scale available for existing firms hampers new entries. Companies being active in the Oil & Gas Equipment and Services Industry have to follow strict regulatory and legal restrictions. Product patents, hydraulic fracturing laws are other restrictions which lower the attractiveness for new market participants. Environmental burdens play a more substantial role and potentially hamper the business.
0% 10% 20% 30% 40% 50% 60%
Oil Natural Gas Coal Biofuels and
waste Electricity Other
% o f t ot al fi na l co ns um pt io n 1973 2012
- 26 -
Bargaining Power of Buyers:
Buyers for the Oil & Gas Equipment and Services Industry are e.g. the big Oil & Gas extraction and refinery firms such as Exxon Mobile, BP or Shell. Their buying power is limited, as the size of the order is normally relatively small and products are highly specialized. In particular, aftermarket parts and services serve niche demands. In addition to that, high switching costs, low buyer’s price sensitivity and the lack of alternative energy equipment solutions make the buyer relatively powerless.
Bargaining Power of Suppliers:
Suppliers for the industry are providers of raw materials such as steel, aluminum, or iron. These materials have low levels of specialization and market concentration. As a result, members of the Oil & Gas Equipment and Services Industry can easily change suppliers due to low switching costs. Consequently, the Bargaining Power of Suppliers is low. This result changes, when suppliers provide more specialized products with higher technical requirements e.g. computer systems, hardware or software. These kinds of suppliers tend to have stronger power than the raw material suppliers.
Threat of Substitutes:
Within the Oil & Gas Equipment and Services Industry itself, the threat of substitutes is low because of the high specialization level. Services are related to specific facilities and are therefore unique. Substitutes are rare. This changes when we consider substitutes for Oil & Gas. Multiple alternatives like coal, wind power or nuclear energy exist and form a strong potential threat of substitutes – in terms of energy type substitutes. As long as alternative energy types (Renewable Energy types) are not able to provide enough supply to serve the high level of demand, fossil fuels like Oil & Gas remain the most important energy type and the industry remains profitable (Chart 8). In the near future, the threat of substitutes outside the Oil & Gas Industry is manageable. However, it might become a serious threat in the future.
Competitive Rivalry:
On the one hand, high buyer’s switching costs, high product differentiation and a lack of numerous competitors of equal size and strength create an environment of low competitiveness. On the other hand, high exit barriers and high fixed costs foster
- 27 -
competitiveness. Overall, the low competitive rivalry factors outweigh the high competitive rivalry factors. Hence the rivalry is relatively low. Moreover, the industry is less dynamic due to long-term contracts and slow decision maker processes (Laws, governmental or political negotiations).
3.4 Deal Rationale
1. Technological opportunities
Chakrabarti, Hauschildt & Süverkrüp (1994) as well as Sleuwaegen & Valentini (2006) stress the fact that innovation and technology changes foster M&A activity. Through M&A, firms are better and quicker able to fill gaps in their technological portfolio and to keep pace with the faced-paced technological environment. Internal development is less profitable according to Capron & Mitchell (2009). A deal would enable Siemens to enter the high-speed engine technology market. In the Oil & Gas Industry the current trend goes towards liquefied natural gas (LNG). Siemens could participate in the profitable hydraulic fracturing method, by which fluid is injected into cracks to force them further open. This technology uncovers huge new supply. Nevertheless, it is controversially discussed due to environmental scruple. In many other countries such as Siemens’ home market Germany, it is prohibited above a soil level of 3000m22. Not adopting this technique in today’s world of Oil & Gas business means competitive disadvantages on a global basis and therefore the acquisition of Dresser-Rand is paramount to the future success of Siemens Oil & Gas Business.
2. Additional growth opportunities
Acquiring Dresser-Rand could also mean expanding the area of growth – both in terms of regions and applications (up-/down-stream). With Dresser-Rand, Siemens would be able to utilize "home market" advantage in the United States and Siemens could become a world class provider for the growing Oil & Gas market. An acquisition could help Siemens to strengthen its US presence – the most important region in the Oil & Gas business. Dresser-Rand would be most efficient for Siemens by implementing the business into the Power & Gas, as well as the Power Generation Services segment. Without synergies, Siemens could increase sales by additional $3 billion (2013) – an
22 As of September 2014
- 28 -
increase for the Power & Gas segment by almost 25%. Given a successful post-merger implementation, the two relevant segments could take advantage of Dresser-Rand’s high profit margins. In particular the highly profitable segment of Aftermarket Parts and Services with profit margins of around 20% is attractive for Siemens.
3. Beneficial window of opportunity:
According to Becker-Blease, Golderberg and Kaen (2008), industry shocks coin and trigger M&A transactions. In the business of Oil & Gas, decreasing oil prices can be considered an industry shock or at least a factor which strongly affects the industry. As Dresser-Rand’s business is positively correlated with WTI-oil, decreasing prices (WTI decreased by 10% between June, 13 2014 and August, 29 201423) could make the target attractive, regarding the acquisition price. The overall aspiring and positive sentiment in the current M&A environment supports the timing of a potential transaction. The opportunity of buying an attractive potential strategic fit at a good price at the right time plays a key role in the deal rationale.
4. Strategic Fit for other recent transactions – Optimizing Portfolio
Another good reason to acquire Dresser-Rand can be found in Siemens’ acquisition strategy. The company is in acquisition talks with Rolls-Royce Energy gas turbine and compressor business. An acquisition of Dresser-Rand could complete a potential Rolls-Royce transaction and could be used to increase overall efficiency by economies of skill, scale and scope. In particular the strong Aftermarket Parts and Services division fits into the portfolio of Siemens’ energy division. After the failed bid for Alstom, the French global leader in power generation, power transmission and rail infrastructure, Siemens appetite for acquisitions to complete the plan to become a global leader in the Gas Business is huge. From a strategic point of view, the acquisition of Dresser-Rand fits into Siemens’ strategy and looks at a first glance advantageous.
23 Data Source: Thomson Reuters
- 29 -
4. Valuation
4.1 Siemens
4.1.1 Financial Projections
EBIT and EBITDA forecasts are optimistic for all of the next three years with Compound Annual Growth Rates (CAGRs) from 2013 – 2016 of 9.3% and 10.5%. Sales are expected to grow in line with the 3.4% world GDP growth rate forecasted for 2014 (Statista 2015). Two cost reduction programs help the Munich-based company to increase its profitability, while having moderate sales growth. “Siemens 2014” – a €6 billion savings program - will affect financial data from 2014 onwards. Furthermore, with respect to its long term strategic program “Vision 2020”, Siemens wants to reduce overhead and support function costs by approximately €1 billion through removing additional layers (cluster, sectors), combining certain divisions and businesses and optimizing corporate services.
Table 9: Siemens – Income Statement projections
In addition to that, Siemens plans to increase efficiency by inorganic growth. In the past, Siemens’ acquisition targets have had high profitability business models, which have helped the firm to increase its overall efficiency and to overcome short term market and business turbulences.
Depreciation and Capital expenditures depend on the following relation: PPEt = PPEt-1 + capital expenditures – depreciation
Capital expenditures = PPEt - PPEt-1 + depreciation
Property, Plant and Equipment (PPE) as a percentage of sales is expected to remain constant at the historic five-year-average of 14%. As depreciation is linked to PPE, I
(€ million) 2011 2012 2013 2014e 2015e 2016e CAGR
Net Sales 73.515 78.296 75.874 78.454 81.121 83.879 3,4%
Operating Expenses 62.760 68.682 67.775 68.239 70.559 72.958 2,5%
EBITDA 10.755 9.614 8.099 10.215 10.562 10.921 10,5%
Depreciation & Amortization 2.650 2.836 2.261 3.075 3.180 3.288 13,3%
- 30 -
assumed depreciation to constantly develop at the five-year depreciation as a % of PPE average of 28%.
In perpetuity, capital expenditures equal depreciation, which implies a non-growing business state.
Table 10: Siemens – Capital Expenditures & Depreciation projections
When forecasting operating working capital, I assumed all asset items to remain at their respective 5-year-average percentage-of-sales-ratio in the future (Appendix 10). Siemens’ high working capital indicates short-term financial health – the company is capable of covering its short term debt with short term assets. Despite that, a high working capital may also indicate that the company has either too much inventory or does not efficiently invest excess cash.
Table 11: Siemens – Working Capital projections
4.1.1.2 Divestment Bosch Siemens Hausgeräte (B/S/H/)
At the beginning of September 2014, the rumor that Siemens plans to sell its 50% stake in B/S/H/ was in the markets. B/S/H/ – a joint venture between Siemens and Bosch - is the largest manufacturer of home appliances in Europe and one of the leading companies worldwide. Siemens considers a divestment due to a lack of synergies to their business in technology or go-to-market. Moreover, the joint venture faced
(€ million) 2013 2014e 2015e 2016e 2017e 2018e 2019e 2020e 2021e PPE 9.815 10.984 11.357 11.743 12.142 12.555 12.982 13.423 13.880 Sales 75.874 78.454 81.121 83.879 86.731 89.680 92.729 95.882 99.142 PPE % of sales 13% 14% 14% 14% 14% 14% 14% 14% 14% Capex 1.869 4.244 3.553 3.674 3.799 3.928 4.062 4.200 4.343 Depreciation 2.261 3.075 3.180 3.288 3.400 3.515 3.635 3.759 3.886 as a % of PPE 23% 28% 28% 28% 28% 28% 28% 28% 28%
(€ million) 2013 2014E 2015E 2016E 2017E 2018E 2019E 2020E 2021E Working Capital 9.070 9.082 9.390 9.710 10.040 10.381 10.734 11.099 11.476 Increase in Working
- 31 -
increasing competitive pressure from market consolidation. As the likelihood of a successful divestment was relatively high, this case proceeds as if B/S/H/ was sold. As a consequence, Siemens’ financial figures and forecasts are adjusted by the transaction (Appendix 11). According to Siemens Management, Bosch was willing to pay € 3 billion in cash and an additional € 250 million dividend and the transaction is expected to be closed in summer 2015.
4.1.2 Discounted Cash Flow Valuation 4.1.2.1 Free Cash Flow estimation
Siemens FCFF forecasts without a B/S/H/ divestment from 2014-2021 underlie the following assumptions:
Sales will grow by 3.4% which equals the expected world GDP growth rate of 2014 (Statista 2015).
EBIT-Margins remain constant at the 3 year average of 9.1%.
Tax payments on EBIT equal 27% - the 3 year average effective tax rate.
Depreciation equals the 5-year-average of depreciation as a percentage of PPE - 28% (Table 10).
Working Capital requirements are forecasted under the assumption that all current Assets and Liabilities will remain its respective 5yearaverageas a % -of -sales ratio in the future (Table 11).
Capital Expenditures equal PPEt – PPEt-1 + depreciation (Table 10). Long-Term Growth rate equals 1%.
In perpetuity:
EBIT, Sales and Working Capital requirements will grow by 1% (long-term growth rate).
Tax as a percentage of EBIT will be unchanged. Depreciation equals capital expenditures.
Capital expenditures equal the amount in 2021E.
FCFFs are at a first step calculated as if Siemens would not sell its B/S/H/ stake and at a next step FCFFs are adjusted by the divestment.
- 32 -
(€ million) 2013 2014e 2015e 2016e 2017e 2018e 2019e 2020e 2021e Perpetuity
Sales 75.874 78.454 81.121 83.879 86.731 89.680 92.729 95.882 99.142 100.133 Sales B/S/H/ 5.719 5.966 6.225 6.494 6.775 7.069 7.375 7.448 Sales ex divestment 75.402 77.913 80.506 83.186 85.954 88.813 91.767 92.685 EBIT 5.838 7.139 7.382 7.633 7.893 8.161 8.438 8.725 9.022 9.112 EBIT B/S/H/ 255 338 353 368 384 401 418 436 455 460 EBIT ex divestment 7.029 7.265 7.508 7.760 8.020 8.289 8.567 8.652 Tax 1.630 1.928 1.993 2.061 2.131 2.203 2.278 2.356 2.436 2.460 Tax B/S/H/ 71 101 106 110 115 120 125 131 137 138 Tax ex divestment 1.887 1.950 2.016 2.083 2.153 2.225 2.299 2.322 Tax as a % of EBIT -27,9% 27,0% 27,0% 27,0% 27,0% 27,0% 27,0% 27,0% 27,0% 27,0% NOPAT ex divestment 5.142 5.314 5.493 5.677 5.867 6.064 6.267 6.330 Depreciation 2.888 3.075 3.180 3.288 3.400 3.515 3.635 3.759 3.886 4.343 Depreciation B/S/H/ 189 197 205 214 223 233 243 254 265 314 Depreciation ex divestment 2.975 3.074 3.177 3.282 3.392 3.505 3.622 4.029
Gross Cash flow ex divestment 8.117 8.388 8.669 8.959 9.259 9.569 9.889 10.359
Increase in Working Capital -422 12 309 319 330 341 353 365 377 381
Increase in Working Capital B/S/H/ 163 -6 45 47 49 51 54 56 58 59
Increase in Working Capital EX divest. 264 272 281 290 299 309 319 322
Capex -1.869 -4.244 -3.553 -3.674 -3.799 -3.928 -4.062 -4.200 -4.343 -4.343
Capex B/S/H/ -189 -233 -243 -254 -265 -277 -288 -301 -314 -314
Capex ex divestment -3.310 -3.420 -3.534 -3.652 -3.773 -3.899 -4.029 -4.029
Free Cash Flow without B/S/H/ 4.032 4.543 4.696 4.854 5.018 5.186 5.361 5.541 6.008
Cash Flows from sales of B/S/H/ 3.250
Free Cash Flow with B/S/H/ 5.649 4.032 4.707 4.867 5.032 5.203 5.380 5.563 5.752 6.271
Forecast Period