University of Trás-os-Montes and Alto Douro
Reorganization of Web sites content based on
Users Visual Behaviour
PhD Thesis in
Informatics
Martinho Fradeira Gonçalves
Supervisors: Prof. Dr. Maximino Esteves Correia Bessa Prof. Dr. Luís Gonzaga Mendes Magalhães
University of Trás-os-Montes and Alto Douro
Reorganization of Web sites content based on
Users Visual Behaviour
PhD Thesis in
Informatics
Martinho Fradeira Gonçalves
Supervisors: Prof. Dr. Maximino Esteves Correia Bessa Prof. Dr. Luís Gonzaga Mendes Magalhães
JURY COMPOSITION:
Prof. Dr. Joaquim Bernardino de Oliveira Lopes Prof. Dr. Thomas Edward William Bashford-Rodgers Prof. Dr. António Fernando Vasconcelos Cunha Castro Coelho
Prof. Dr. João Manuel Pereira Barroso Prof. Dr. Luís Paulo Peixoto dos Santos
Prof. Dr. Luís Filipe Leite Barbosa Prof. Dr. Maximino Esteves Correia Bessa
This thesis was specifically prepared to obtain the PhD degree in Informatics.
Financial support provided by FCT (“Fundação para a Ciência e a Tecnologia”) and POPH-QREN/FSE (“Programa Operacional Potencial Humano-Quadro de Referência Estratégico Nacional/Fundo Social Europeu”, PhD grant SFRH/BD/64013/2009).
The presented doctrines are of the exclusive responsibility of the author.
The partial reproduction of this thesis is authorized only for research purposes, by written declaration of the person concerned, who commits to do so.
University of Trás-os-Montes and Alto Douro, _____/_____/_______
“The good news about computers is that they do what you tell them to do. The bad news is that they do what you tell them to do.”
i
Acknowledgments
Institutionally, through the numerous efforts made to provide the best conditions for the development and realization of this work I would like to recognize Professor António Augusto Fontaínhas Fernandes, Rector of the University de Trás-os-Montes e Alto Douro and the Visualization Group, Warwick Manufacturing Group (WMG), University of Warwick.
For the financial support through the attribution of a PhD grant. I would like to recognize the “Fundação para a Ciência e a Tecnologia” (FCT), and the “Programa Operacional Potencial Humano/Fundo Social Europeu” (POPH/FSE).
This work was developed in a laboratory, supported by the Portuguese government, through the National Foundation for Science and Technology — FCT (Fundação para a Ciência e Tecnologia) and the European Union (COMPETE, QREN and FEDER) through the project REC I/EEI-SII/0360/2012 entitled "MASSIVE—Multimodal Acknowledgeable multiSenSorial Immersive Virtual Enviroments".
Professor Maximino Esteves Correia Bessa and Professor Luís Gonzaga Mendes Magalhães, as my advisors, for helping me develop skills and knowledge.
To Professor Alan Chamers, my supervisor in the University of Warwick, I am grateful for his guidance.
To my colleagues, Miguel Melo and Telmo Adão who were of great help in difficult times and the knowledge exchange allowed me to develop this work.
I am bound to my family who have always supported my decisions and helped me in everything I needed.
I would like to thank Cátia Fernandes who was always by my side during all the process.
At last, I would like to give my special thanks to all the people that have participated in the experiments conducted and all the people who enabled me to complete this work. Without them this PhD was not possible.
REORGANIZATION OF WEB SITES CONTENT BASED ON USERS VISUAL BEHAVIOUR.
Abstract
One of the main problems in web development is that the pages are designed and built around the main task that a user will perform on the website. Usually e-commerce sites are oriented towards searching; on the other hand newspaper sites are more oriented towards the exploration of web pages, where a large amount of information is available to the user when the web page is loaded. When users try to perform a different task from which the site is arranged/designed, it becomes very difficult, taking a long time to find the desired information. The aim of this work is to improve web page's efficiency, by applying knowledge of the human visual mechanism. This is achieved by identifying how the Human Visual System operates when browsing web pages, and how it can be exploited.
In order to accomplish this concept, this work shows that it is possible to distinguish if a user is completing a task or simply exploring a web page. This difference can be identified by the operations of human visual mechanisms and by saccade distances. Clear differences can be observed in the visual patterns when users perform a task or simply explore a web page. With this knowledge an Eye Tracking Task Identification system will be proposed. The system is able to automatically detect if a user is completing a task or simply exploring a web page.
The application of this method allows for the possibility of automatically restructuring web pages based on the user’s task/visual patterns. This work implements such a restructuring method, and the results obtained through experiments show that the proposed method restructures the web page with a success rate of 83,3%. Additionally, the collected data also indicates that the restructuring of web pages can allow users to complete tasks in the same time duration as a hand optimised web page.
VISUAL HUMANO.
Resumo
Um dos principais problemas no desenvolvimento web é o facto dos sites serem desenhados e construidos com base na principal tarefa que os utilizadores irão realizar no site. Normalmente sites de e-commerce são orientados para a pesquisa, por outro lado sites de jornais online são mais orientados para a exploração das páginas, onde uma larga quantidade de informação é apresentada ao utilizador quando esta é carregada. Quando os utilizadores tentam realizar uma tarefa diferente da qual o site foi desenhado/construido para, fica muito difícil, demorando um longo período de tempo para encontrar a informação pretendida. O objectivo deste trabalho é aumentar a eficiência das páginas web, aplicando conhecimentos sobre o sistema visual humano. Isto é alcançado através da identificação de como o Sistema Visual Humano funciona quando os utilizadores navegam nas páginas web, e como pode este ser explorado.
De modo a atingir este objectivo, este trabalho apresenta a possibilidade de identificar se o utilizador está a completar uma tarefa ou simplesmente a explorar uma página web. A diferença pode ser identificada através das operações do sistema visual humano ou através das distância das saccades. Diferenças óbvias podem ser observadas nos padrões visuais quando os utilizadores realizam uma tarefa ou simplesmente exploram uma página web. Com este conhecimento, vai ser apresentado um sistema de Eye Tracking Task Identification. O sistema é capaz de automaticamente detectar se o utilizador está a completar uma tarefa ou simplemente a explorar a página web.
A aplicação deste método permite a possibilidade de automáticamente restruturar as páginas web baseado-se nos padrões visuais da tarefa. Este trabalho aplica este método de restruturação, e os resultados obtidos através das experiências mostra que este restrutura as páginas web com um sucesso de 83,3%. Adicionalmente, os dados recolhidos indicam que a restruturação das páginas permite aos utilizadores completar as tarefas em igual período de tempo ao realizado num site previamente optimizado.
Homem-Table of Contents
1. INTRODUCTION ... 17 1.1. OBJECTIVES ... 19 1.2. THESIS CONTRIBUTION ... 19 1.3. POSSIBLE APPLICATIONS ... 20 2. BACKGROUND ... 232.1. HUMAN VISUAL SYSTEM ... 23
2.2. VISUAL ATTENTION ... 24
2.2.1. Bottom-Up ... 26
2.2.2. Top-Down ... 29
2.2.3. Taxonomy and Models of Eye Movements ... 31
2.2.4. Eye tracking ... 32
2.3. VISUAL PERCEPTION ON THE WEB PAGES ... 35
2.4. SUMMARY ... 44
3. WEB TASKS CLASSIFICATION ... 45
3.1. WEB TASKS CLASSIFICATION BASED ON THE DOMINANT VISUAL MECHANISM IDENTIFICATION ... 46
3.1.1. Hypotheses ... 46
3.1.2. Metrics ... 47
3.1.3. Participants ... 47
TABLE OF CONTENTS
ix
3.1.5. Results and Discussion ... 49
3.2. WEB TASKS CLASSIFICATION BASED ON SACCADES DISTANCES ... 54
3.2.1. Hypotheses ... 55
3.2.2. Metrics ... 55
3.2.3. Participants ... 56
3.2.4. Conditions and Procedure ... 56
3.2.5. Results and Discussion ... 57
3.3. SUMMARY ... 59
4. PROPOSAL OF AN EYE TRACKING TASK IDENTIFICATION METHODOLOGY61 4.1. METHOD /ALGORITHM ... 62
4.2. CASE STUDY -METHOD EVALUATION AND VALIDATION ... 66
4.2.1. Prototype Implementation ... 66
4.2.1.1. Task Identification System Architecture ... 66
4.2.1.2. Implementation ... 67
4.1.1.1. Task Identification System Flow Chart ... 68
4.1.1.2. System data ... 71
4.2.2. Evaluation and Validation ... 71
4.2.2.1. Conditions and Procedure ... 71
4.2.2.2. Participants ... 73
4.2.2.3. Results and Discussion ... 73
4.3. SUMMARY ... 74
5.1. OBJECTIVE ... 80
5.2. CONDITIONS AND PROCEDURE ... 80
5.3. PARTICIPANTS ... 83
5.4. RESULTS AND DISCUSSION ... 83
5.5. SUMMARY ... 90
6. CONCLUSIONS AND FUTURE WORK ... 91
Table of Tables
Table 3.1. Nonparametric Test (2 Independent Samples) ... 51
Table 3.2. Parametric Test (2 Independent Samples). ... 58
Table 4.1. Actions and Websites ... 72
Table 4.2. Success rate of the application guesses. ... 74
Table 5.1. Tasks and websites. ... 82
Table 5.2. Results of the application task detection success. ... 83
Table 5.3. Participants’ task time (milliseconds). ... 84
Table 6.1. Nonparametric Test (2 Independent Samples) of the percentage of hotspots that are also saliency region and the percentage of hotspots per page. ... 92
Table 6.2. Parametric Test (2 Independent Samples) of the Mean Saccade Distance and the Mean Saccade Distance per Task Time. ... 93
Table 6.3. Success rate of the method predictions. ... 94
Table of Figures
Figure 2.1. Itti and Koch computational model of attention. From [Itti et al., 1998] ... 28
Figure 2.2. a) Ilya Repin. The Unexpected Return. 1884; b) the subject was allowed to examine Repin's painting freely. c) the subject was asked to estimate the ages of the people d) the subject was asked to remember what the people were wearing; ... 30
Figure 2.3. Different types of eye trackers. a) Mobile eye tracking - Tobii Glasses, b) Flexible eye tracking - Tobii X60 & X120, c) Tobii X2-60 Eye Tracker, d) Wide-screen eye tracking - Tobii T60XL. Images captured from tobii company web page [Tobii, 2013]. ... 34
Figure 2.4. Irrelevant node: All users leave node E always towards node G with little average time spent within E - this node is likely to be irrelevant [Doer et al., 2007]. ... 41
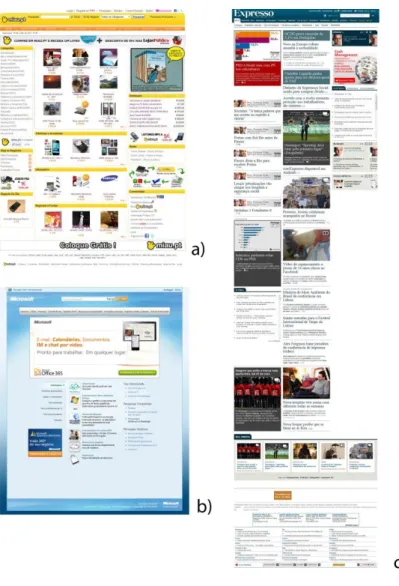
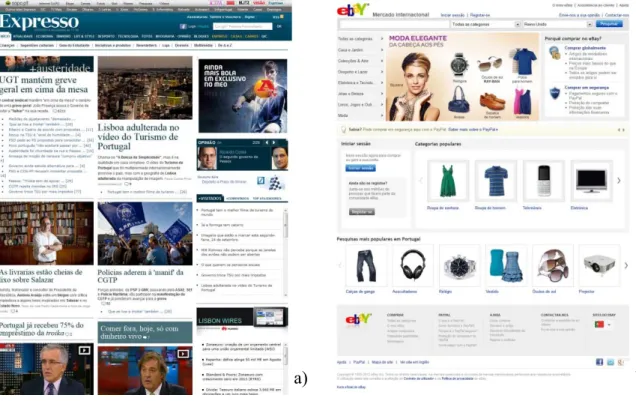
Figure 3.1. The web pages used in the case study. a) Miau Ecommerc Web page. b) Microsoft Company web page. c) Expresso online journal Web page. ... 49
Figure 3.2. Example of the images used to compare the visual pattern of subject number six with the saliency map of a web page. a) Original web page image, b) Saliency Map generated using Ezvision, c) Dichromatic image generated in MatLab from image b), d) Hotspot image from user visual patterns and e) Dichromatic image generated in MatLab from image d). ... 50
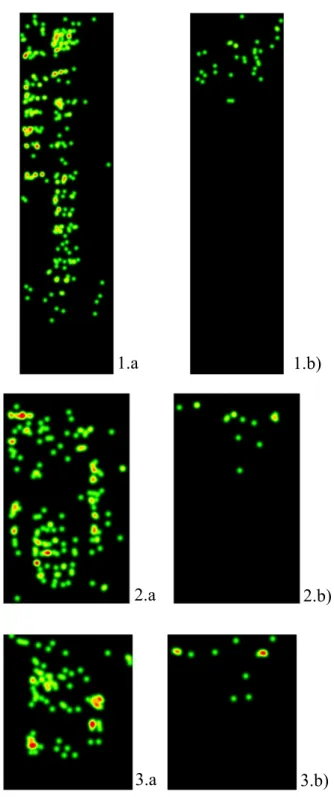
Figure 3.3. 1.a) visual patterns of one subject while exploring in Expresso; 1.b ) visual patterns of one subject while performing a task in Expresso; 2.a) visual patterns of one subject while exploring in Miau; 2.b) visual patterns of one subject while performing a task in Miau; 3.a) visual patterns of one subject while exploring in Microsoft; 3.b) visual patterns of one subject while performing a task in Microsoft. The disparity of the images height and width results from the need to represent the complete web page. ... 53
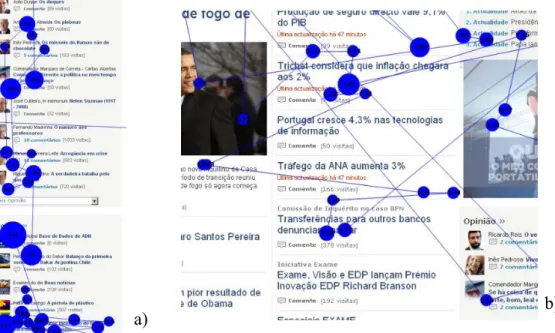
Figure 3.4. Gaze maps collected from Clear View. a) visual patterns from a user freely exploring Expresso Newspaper, b) visual patterns from a user performing a task in the Expresso Newspaper. ... 54
Figure 3.5. The Web pages used in this case study. a) Part of the online Expresso Newspaper. b) Ebay e-commerce website ... 57
TABLE OF FIGURES
xv
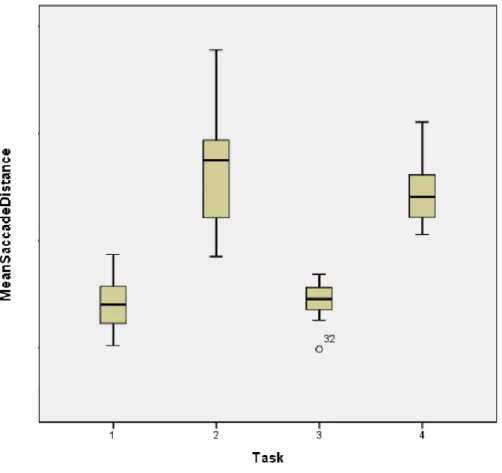
Figure 3.6. Boxplots of the Mean Saccade Distances in the different tasks ... 59
Figure 4.1. Boxplots of the Mean Saccade Distances in the different tasks (chapter 3, section 2). ... 62
Figure 4.2. Fixation calculation (process 1). ... 63
Figure 4.3. Identification of the task (process 2) ... 65
Figure 4.4. Task Identification System Architecture. ... 67
Figure 4.5. Task Identification System Flow Chart. ... 69
Figure 4.6. Print Screen of the application window. ... 70
Figure 4.7. Print screens of the Web pages used in this case study. a) Ebay Ecommerce website, b) Parte of the online Expresso Newspaper, c) Parte of the online Publico Newspaper. ... 73
Figure 5.1. Real time Task Identification Algorithm. ... 79
Figure 5.2. Web pages used in this case study. a) web page for the subjects that are freely exploring a web page, b) web page presented to the subjects that are performing a task. ... 81
Figure 5.3. Web page layout scheme for each task. ... 82
Figure 5.4. Boxplots of the participants´ task time. ... 85
Figure 5.5. Boxplots of the participants´ time in the web page exploring task. ... 86
Figure 5.6. Web pages used and respective Saliency maps of the web pages. ... 87
Figure 5.7. Fixations map for one participant completing a task. ... 88
Figure 6.1. Boxplots of the Mean Saccade Distances in the different tasks. ... 93
17
1. INTRODUCTION
The Internet has become an essential tool for many people. “Adding up all the users in individual countries around the world, there appear to be around 2.5 thousand million global internet users today – roughly 35% of the world’s population.” [Wearesocial, 2014].
Compared to last year, at the time of submission, a growth of 150 million users can be verified. However, there exists the possibility of there being even more because the data from some countries may be not accurate. The International Communications Union estimates that there are probably closer to 3 billion global internet users, especially when taking into account the increasing number of mobile accessing to the Internet.
Regarding e-commerce, based on the study of the International Data Corporation, global business-to-business and consumer transactions equate to 16 trillion dollars in 2013. Added to the global market for digital products and services (4.4 trillion dollars in 2013), it is estimated to be worth 20.4 trillion US dollars, representing about 13,8% of global sales [OxfordEconomics, 2011].
Based on the volume of online business, some companies devote a lot of resources to try to build the perfect layout in order to guarantee that their customers/visitors can find what they want/need and have a good experience while visiting their website. However, accomplishing this is not an easy task, as the user attention will be focussed on different areas of a website, depending on the task.
One of the main problems in web development is that the pages are designed and built around the main task that a user will perform on the website. Usually e-commerce sites are oriented towards searching; on the other hand newspaper sites are more oriented for the users to explore the web page, where there is a great amount of information available to the user when the web page is loaded. When users try to perform a different task from which the site is arranged/designed, it becomes very difficult, taking a long time or even becoming impossible to find the desired information.
The perception of a visual environment depends on the user and the task the user is currently performing. Models of the human visual system can be exploited to significantly reduce computational time when rendering high fidelity images, without compromising the perceived visual quality. This works by identifying which areas are going to capture the users’ attention and reduce the image quality in the others. The models of the human visual system can be based in different visual mechanisms, depending if the user is performing specific tasks or simply exploring.
The bottom-up mechanism is more active when users are exploring, and usually these models are based on models of features which are deemed salient by the Human Visual System. These salient regions are typically encoded as Saliency Maps in the computer graphics literature. The Top-Down mechanism is active when the user is performing a task and long term cognitive processes are used to guide the visual search pattern. The Models for this stimulus are based on task related goals, where this tasks is most likely to be visualised by a user. A common example is detecting fire safety equipment, where the visually important regions are the areas around fire extinguishers and safety signs. Again, this importation regions can be encoded into an image, known as a task map [Sundstedt
INTRODUCTION
19
In this work, the goal is to apply the same concept to web page restructuring based on the web page content and its perceptual importance. We propose the concept of a task identification system that can successfully detect if a user performed a task, or if the user was just exploring the web page. Starting by identify what the user is doing on the web page, identifying the visual mechanism and then identify the areas that will most likely attract their attention. Based on this, the proposed system will enable real-time restructuring of web pages. This presents the most important content in the visually important areas of the webpage. Furthermore, this information may be used to develop a dynamic web site interface that adapts to the tasks, in order to improve web sites.
1.1. Objectives
This work aims to investigate the possibility to automatically, and in real time, restructure the web pages based on the user's actions. This will be accomplished by identifying the task that the user is performing, and combined with knowledge of the Human Visual System and visual perception, web pages will be re-arranged based on their visual and perceptual importance. This will be used to highlight the most important and relevant information of the website, and thereby making the website more efficient.
To achieve this we conduct an extended user study in the use of internet. This study will characterize and identify browsing patterns in order to verify that they can be associated with the two mechanisms of visual attention (Bottom-Up and Top-Down). Based on this study, a methodology will be proposed to automatically detect the task the user is performing. To support this concept, the proposed methodology will be implemented, and additional user studies will be conducted to support its validity. Lastly, to verify the possibility of using the method for automatic and real-time restructuring of web pages in order to improve their efficiency.
1.2. Thesis contribution
We present a literature review, discussing relevant aspects of visual perception, and examining issues regarding the study of the human visual system when using web pages.
We hypothesise that people use different visual patterns when completing different tasks on web pages, and obtain evidence through our experiments to support this theory.
We propose a method for an automatic task identification system, as well its implementation. We assessed this method through experiments to verify its validity.
We studied the possibility of applying the proposed methodology to real time web page restructuring based in the participants’ tasks. Evidence was found that using this method it would be possible to improve the efficiency of web pages.
1.3. Possible applications
Being able to improve the efficiency of web pages in terms of the time that users take to complete a particular task, as well as the information that the user is able to assimilate, is one of the major goals of this work. Besides this, there are several practical applications for this concepts, like publicity, web commerce, and web assistance, amongst others.
The Web advertisement is a way of financing web pages and is a very important market in the Wold Wide Web. Global Industry Analysts predicts that World Wide Web advertising market will reach almost 73 billion dollars by 2015. The advertisements may be presented in different ways, as banners, pop ups, floating advertisements, amongst others. There are different ways to charge companies for the publicity in different web sites. Some companies pay for the number of times the advertisement is clicked, others by the number of times that the advertisement is presented. Using the concept presented in this work, by knowing which visual mechanism of the human visual system is active at a particular moment, it will be possible to identify the probability of the user paying attention to the advertisement and then charging the advertising company accordingly. One of the biggest problems regarding charging by the number of times that the advertisement is presented, is that it doesn´t represent the actually number of times that the advertisement is seen by the users. On the other hand, when users are performing a task in the internet they may only pay attention to the task related areas, and ignoring all the other information present. This information can be useful, because it can potentially save money for the companies that are advertising and the area that is occupied by
INTRODUCTION
21
publicity could be used to place more information regarding the task that the user is performing [Advertising, 2014].
Knowing what areas/products the user is looking for, in e-commerce web pages could also be used to improve efficiency and present important products in the areas the user is most likely going to look at. This way not only is information going to be placed in strategic positions on the site, but also all the data can be selected by its relationship with what the user is looking for (accessories, promotions, amongst others). Even if these approaches only lead to a 1 - 2% improvement in search efficiency, a growth of thousands of dollars may be observed, especially for large companies.
Web assistance is other field where this concept can be applied. There are companies that offer web assistance, sometimes presented as a pre-recorded answer for specific questions, sometimes even in real-time and using a real person’s guidance. This assistance starts by identifying what a user is searching for, or what are his goals and then provide efficient answers and solutions in order that the user can reach his goal. Our work can be used to improve the identification of the users’ goal by transmitting in real time the areas/information that is capturing the users’ visual attention and/or his visual behaviour. With this, the assistance can be improved and provide the users with a better and faster solution.
Lastly, one has to consider the growth of internet access using mobile browsers and apps. In the US, this is already used more frequently than desktop browser access. This is a very important sector and search strategies should be, and are already being taken in consideration for mobile access to web services, information seeking, online commerce, and online advertisement, amongst others. For example, many websites have a mobile version for use with small screen devices. Due to the small screen size the information display and page design needs to be carefully planned and precise. The amount of information displayed is greatly reduced when compared with regular screens, therefore identifying the users’ visual attention and the task that is being performed could help to improve the efficiency of the web sites as well for the apps [Mobile, 2014].
Outline of the thesis
Chapter 2: Provides information on the Human Visual System and specifically visual attention. This chapter presents the visual mechanisms used to capture a visual stimulus, including taxonomy and models of eye movements. Additionally, this chapter presents an overview of eye tracking. Furthermore, this chapter reflects on the Human Visual Perception when viewing Web pages.
Chapter 3: Presents a formally-designed psychophysical study that was carried out in
order to determine the possibility of distinguishing a user’s visual behaviour when she/he is simply exploring a web page or performing a task on the same web page. It was concluded that it is possible to distinguish if a user is completing a task or simply exploring a web page, according to their visual patterns.
Chapter 4: Presents a method to identify if a user is completing a task or simply exploring a web page and its implementation in a computer system. In addition a formally-designed psychophysical study shows that the proposed system is able to automatically detect if a user is performing a task or simply exploring a web page.
Chapter 5: Presents a formally-designed psychophysical study that aims at verifying if the proposed method can be used to rearrange the web page structure and visual content in real time, depending if the user is performing a task or freely exploring a web page.
Chapter 6: This final chapter presents the main results and contributions of this thesis and suggests future work.
23
2. BACKGROUND
The works focuses on effective presentation of the content on web pages in real time. This is essential to help the user to efficiently find relevant information. This can be achieved by changing the web page structure, rearrange the information, suggesting paths or improve a web assistant by identifying what information the user is looking for, amongst others.
However for a better understanding of the work presented in this document, one needs to understand several different areas including, the Human Visual System (HVS), visual perception and the visual perception on web pages.
2.1. Human Visual System
The physical structure of the eye is quite well known. This physical structure is made of a set of visual organs, without which Visual Information Processing would not operate.
Vision begins when light rays enter the eyes through the cornea, the transparent outer covering of the eye. These rays then travel through the pupil, the lens, the vitreous humour until they hit the retina which is located at the back of the eye. The retina is a
light-sensitive layer which consists of rod and cone cells, which are named after their distinct shapes. Cones are concentrated in the centre of the retina, and in bright conditions provide sharp central vision and detect colours and fine details. Rods are located in the region from the outer edge of the retina to the centre area containing the cones. They provide peripheral or side vision. They also allow the eye to detect motion and help us see in dim light and at night. These cells in the retina collect the light signals and send them as electrical impulses to the optic nerve. Then the optical nerve sends these electric impulses to the brain where they are processed, thereby allowing an understanding of the scene.
Visual psychophysics, when the brain processes the electric impulse, can be affected by the limitation of the neurological substrate. There are many characteristics that can affect vision such as the range of the visual field, the frequency that the stimuli is presented, colour perception, amongst others. Although these attributes are regarded as limitation of the HVS, these limitations can be used to improve applications in a way such that a minimal amount of information is lost. Therefore, characteristics of the scene such as information location, the speed at which it is presented, whether if it has movement, luminance, chrominance and contrast, should be taken into account when sending visual stimulus because they affect the visual attention.
2.2. Visual Attention
Research into how human senses work can lead to a more comprehensive knowledge of human behaviour and expected reaction with faced with external stimuli. For instance, studying the main characteristics of vision, the visual pattern, the capability of visual depth, perceptual consistency, ability to identify patterns, the visual sensitive and the contrast.
When the user is exposed to an external stimulus (for instance a web page) the stimulus is processed and a response is generated automatically. This response is influenced by a large number of factors, such as type of stimulus, socioeconomic factors pertaining to the observer, age, gender, amongst others.
The HVS is selective and only a small part of the visual information captured is preferentially processed. Several researches have studied visual attention and its features
BACKGROUND
25
[Helmholtz, 1925], [Gibson, 1941], [Broadbent, 1958], [Deutsch, 1963], [Yarbus, 1967], [Noton and Stark, 1971], [Posner, 1980]. This research studied different aspects of visual attention, such as the attention targets (where the attention is focused on), how these targets are selected, how this information is filtered and also the influence of the tasks that the users were performing.
In 1980 Treisman and Gelad studied the feature integration theory, where they made breakthroughs in the models of human visual attention. In this study [Treisman and Gelad, 1980], they performed several experiments where the results suggested that visual perception is formed between parallel detections of visual targets and perceptual grouping. Usually these two ways of visual perception operate together, but is possible to show either of the two working independently. In the parallel detections of visual targets, perception occurs automatically and unconsciously. In this stage the object is processed by details such as shape, colour, movement, amongst others, with each aspect being process in different areas of the brain. In the perceptual grouping, the attention focused on the object and the individual features of the object are combined in order to perceive the whole object. To combine the individual features of the object the HVS creates a map of the location of the features. When attention focused on one point of the map, that feature is processed and created a piece of image of the full object. Then that specific image is processed with prior knowledge and with the intent of identify the object.
In 1983 the psychologist William James created one of the most popular definitions of attention. In his study he described the attention has the process by which the mind captures what seems the different objects and trains of thought. When this process occurs the mind only focus in some features the entire scene, improving the efficiency when processing those features [James, 1983].
In 1994, kosslyn et. al presented a model of visual attention which they describe as a selection filter of the perceptual processing. They proposed a “window”, which is responsible for the selection of the visual patterns [Kosslyn, 1994].
As in 2004, psychologists [John, 2004], discussed the existence of a series of bottlenecks, when visual attention becomes selective and choose only one at a time of the memory
representation for further processing results in attentional bottleneck, in the human visual system. They showed that these led to information processing problems when there were several sources of information to be processed. In study conducted by Tombu [2011], they concluded the existence of a unified attentional bottleneck in different regions of the brain. These bottlenecks were exhibited when performing temporally limited different operations such as perceptual encoding and decision-making. Regarding the visual perception of a stimulus, a specific bottleneck in visual information is very evident. As stated in section 2.1 the cells that capture the fine details of a visual stimulus, as acuity of the visual stimulus are the cones, located in a very small part of the retina. This area is only capable of registering a small portion of the visual field, thus when we look at a certain region of the visual stimulus, processing will be concentrate in that specific area of the visual stimulus. The remaining of the visual field will receive only a small part of the visual processing capacity. For example, when reading a book, one processes each word rather than the entire page.
The process by which subjects’ quickly move their eye position directly to important areas in the visual field is called Selective Visual Attention. The visual attention can be attracted automatically by the stimulus, by bottom-up or top-down mechanism, which depends on the context.
2.2.1. Bottom-Up
As in feature integration theory, which has served as a basis for many computational models of bottom-up attention deployment, the bottom-up mechanism automatically attractthe visual attention to features of potential importance without the person making a conscious choice. It operates on the raw sensory input, and attention is involuntarily driven to the salient visual features [Itti, 2000]. One example is if one is walking in a dark environment and a light is switched on, people tend to automatically look at the light source.
Through the study of the HVS, is possible to determine the approximate ordering by which people tend to focus on regions in a scene. This information can then be encoded into an image, termed a Saliency Map.
BACKGROUND
27 Saliency Map
The first neurally-plausible bottom-up computational architecture was proposed by Koch and Ullman [Koch and Ullman, 1985], based on the idea of the existence, in the brain, of a specific visual map encoding for local visual conspicuity. A Saliency Map can provide information about salient, ie. visually important, areas that will attract one’s attention in an involuntary way. This work is deeply connected to the integration theory, and from the work born the “Saliency Maps” concept.
In this study they defined the saliency map as an explicit two-dimensional topographical map which combines the information of individual topographical maps, standing for different dimensions, such as colour, orientation of edges, disparity, and direction of movement. The saliency map codes conspicuous details belonging to each feature dimension, at every location in the visual scene [Bessa, 2007].
Over the years, saliency maps have been the target of several studies, with particular emphasis on its computational models’ architecture. Over time the different approaches to this became more specific and differentiated. The characteristics of topographical maps were divided, making it possible to distinguish more layers. In Figure 2.1, the architecture presented is based on the model by Koch and Ullman [Koch and Ullman, 1985]. This architecture provides the implementation of the feature integration theory.
Figure 2.1. Itti and Koch computational model of attention. From [Itti et al., 1998]
Saliency Maps are central to the architecture of several successful models of visual attention control based on Bottom-up mechanisms. The differences between these computational models are commonly found in strategies employed to analyse incoming sensory information for the construction of the saliency map. For instance in [Kock and Ulman, 1985], the visual input was computed in a parallel manner into a set of pre-attentive feature maps, and then for each point all the information from the different feature maps creates a topographic saliency maps. In the computational model by [Itti et
al., 1998] (Figure 1), the visual input is computed using a linear filtering at eight spatial
scales.
In 1994 Wolfe, introduced a hybrid architecture to the models of visual attention, where he also considered that Top-down processes also contributes to the creation of the saliency maps. As the result of this architecture their method creates an activation map that “will guide the deployment of attention” [Wolfe, 1994]. The visual stimuli’s is processed in different channels generating the feature maps. In this feature maps, bottom-up and task related (Top-down) processes is also take into account. The sum of these features maps
BACKGROUND
29
generates the Activation Map. Other models have also been proposed. For a more extensive review, please see [Itti, 2000].
2.2.2. Top-Down
As previously presented in the feature integration theory section 2.2, the visual stimulus can be processed automatically and unconsciously by bottom-up or top-down processes, using top-down process the visual stimulus is processed comparing with prior knowledge and with the intent of identify the object. The top-down mechanism is related to a subject's long-term cognitive strategies, where knowledge and context play a crucial role on how one selects where to pay attention to.
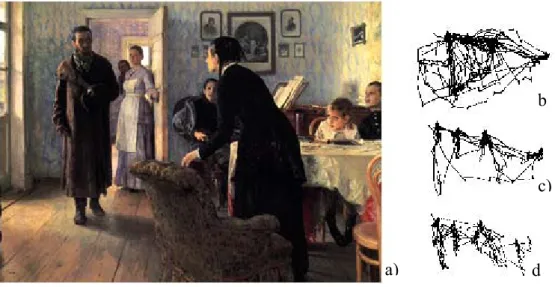
One of the best well known experiments was made by Alfred Yarbus [1967]with the observation of Repin's painting, “The Unexpected Visitor" (Figure 2.2). In this experiment he observed the fixations and the saccades of different participants when performing seven different tasks. Figure 2.2, presents three different gaze patterns from one subject. Figure 2.2b) shows the subject's gaze pattern when they were allowed to exam freely the painting. Figure 2.2c) shows the gaze pattern when the subject was asked to estimate the peoples' ages and in 2.2d) the subject was asked to remember the clothes worn by the people in the painting.
Figure 2.2. a) Ilya Repin. The Unexpected Return. 1884; b) the subject was allowed to examine Repin's painting freely. c) the subject was asked to estimate the ages of the people d) the subject
was asked to remember what the people were wearing;
Yarbus showed that the way one perceives an environment depends on the socio-economic background and on the task that is currently performing in that environment [Yarbus 1967]. He stated that “the distribution of points of fixation on the object changes depending on the purpose of the observer”, and “people who think differently also, to some extent, see differently”. He also concludes that when subjects viewed complex scenes they use saccadic jumps (distances travelled between to fixations) between points of most interest.
This experiment has been one of the most cited to explain the differences in the Bottom-up and Top-Down mechanisms. In 2004, Lipps and Plez [2004], revised the Yarbus study and point out some aspects that should be considered; the primitive eye tracker, the conditions in which the experiments were conducted, the restricted movements, viewing times, painful optical stalks. All these aspects could affect the visual behaviour and the results presented in the paper. In this study they perform an experiment, conducted with 20 subjects, on the gaze patterns to verify the extent on which the results of Yarbus’ study were affected by subject head restrains leading to variations on the oculomotor nerve behaviour. They conclude that the subjects' visual patterns were clearly task dependent as shown in study by Yarbus. However, the differences in the visual behaviour between
a)
b
c)
BACKGROUND
31
tasks were less dramatic and they also verified that the time that the subject paid attention to the visual stimulus was considerably less. Despite this, they re-enforced the conclusion that eye movement patterns are influenced by high-level tasks.
2.2.3. Taxonomy and Models of Eye Movements
Almost all the basic movements of the eyes are the result of the combination of five types of movements: "saccadic, smooth pursuit, Vergence, vestibular and physiological nystagmus (small movements associated with fixations)" [Robinson, 1968].
The saccades are rapid eye movements which are used to reposition the fovea. This set of movements consists of reflexes and voluntary saccades. These can also occur as a response to the need to correct the position of the focus of the eye. The saccades have short duration, and make the subject effectively blind during the transition [Shebilske and Fisher, 1983].
The smooth pursuit eye movements are involved in the chase and search for a moving target. Depending on the speed of the target, the eyes are able to maintain a speed equal to the movement of the target [Grasse and Lisberger, 1992].
Vergence movements are used to focus the eye on a target at a distance. This movement enables the viewing / perception of depth. Other types of depth related eye movements, such as accommodation and adaptation, refer to non-positional features such as pupil dilation and focus.
The fixations are the focus of the retina on one object or target of interest of the visual stimulus. They are characterized by tiny eye movements: drift, tremor and micro-saccades. The fixations last between 150 milliseconds to 600 milliseconds. 90% of the time in which the HVS is capturing visual data is spent in fixations [Irwin, 1992].
The physiological nystagmus eye movements are related with saccades. In the case of Optokinetic nystagmus is necessary to compensate for the movement of the retina. The Vestibular nystagmus is a necessary move to compensate for head movement. These
movements are fundamental to allow visual system to focus the target [Robinson, 1968], [Carpenter, 1977].
The main features in the analysis of eye movement are the identification of fixations, the Saccades and Smooth Pursuit. These three types of characteristics show us the voluntary movements of the subject’s eyes, thus showing us visual attention. Fixations are used when we want to focus on a static target, saccades when we want to change the position of the focus of attention and Smooth Pursuit when we chase a moving target, and they all deliberate movements by the subject. One of the tools that allow the study of the user visual behaviour is the eye tracker.
2.2.4. Eye tracking
An eye tracker is a device for measuring eye positions and eye movement. Eye trackers are used in research on the HVS, in psychology, in cognitive linguistics, in product design, amongst others. Eye tracking is the process of measuring either the focus of gaze ("where we are looking") or the eye motion relative to the head.
The first studies related to eye movements were conducted through direct observation of the eyes. These studies raised some very important issues concerning the reading and visualization of images. Only at the beginning of the 20th century, Huey [1908], built the first prototype of eye tracker. In this study he also observed that not all words are read in order when reading a sentence.
After this demonstrated the different possibilities of studies that could be conducted with an eye tracker, the investigator Guy Buswell, created the first non-invasive eye tracker [Buswell, 1922]. With this technology, they conducted some studies on reading text and image visualization. In one of his studies [Buswell, 1922] he focused on reading, comparing mature adults and immature children. This allowed the evolution of reading to be investigated, including behaviours induced by reading and the effect of different teaching methods on reading ability.
In 1967, Yarbus studied the influences of tasks in visual patterns [Yarbus, 1967x2]. He showed that if the subject, when viewing a stimulus, is given task to perform, it will completely change the visual pattern. The examination of pictures "is dependent not only
BACKGROUND
33
on what is shown on the picture, but also on the problem facing the observer and the information that he hopes to gain from the picture." This study was also conducted using a rudimentary eye tracker which implied that the subject was subject to some pain and some restrictions.
Later in 1980, Just and Carpenter [Just and Carpenter, 1980] formulated the hypothesis that the positions and durations of gaze fixations are related to information processing. New researchers use this hypothesis as granted, but it was just studied after a lot of reading and image processing studies (a good survey [Rayner, 1978]). It was also around this time that the eye tracking start to be used in the Human Computer Interaction, to gain an understanding how we interact with computers, and also to enable interaction by disabled users.
Through the 1980’s, there were studies which challenged the Just and Carpenter [1980] hypotheses. Several researchers studied the differences between where the fixations and gazes were pointing and where the visual attention was focused. Eye tracking alone cannot lead to insights on the cognitive process, just the gaze patterns [Posner, 1980].
Despite the number of studies in this area, the cognitive processes that occur during a fixation on a particular object or place remain unknown. When a subject is fixing a car in an image with several cars, this can indicate different meanings, for example the subject recognizes the car, likes the car, dislikes the car, amongst many other possibilities. [Wright and Ward, 2008], [Hoffman, 1998], [Deubel and Schneider, 1996], [Holsanova, 2001]
Figure 2.3. Different types of eye trackers. a) Mobile eye tracking - Tobii Glasses, b) Flexible eye tracking - Tobii X60 & X120, c) Tobii X2-60 Eye Tracker, d) Wide-screen eye tracking - Tobii
T60XL. Images captured from tobii company web page [Tobii, 2013].
Nowadays there are several types of eye trackers, head mounted (Figure 2.4 a)), inside in the display (Figure 2.4 d)), some placed in a table in front of the user (Figure 2.4 b)), amongst others (Figure 2.4 c)). This newer hardware enables non-invasive studies to be performed with increased accuracy and efficiency. This can include performing eye-tracking without the subject being aware of what is happening. Furthermore it allows researchers to perform eye tracker studies in many everyday situations to better understand how the HVS works.
Applications
One of the fields where the eye tracking studies are most performed is web usability. Although the old techniques to verify the usability of the pages are quite important, most of the information that returned was the number of clicks, number of returns and number of times the page was scrolled. Utilising eye-tracking technology, a more detailed analysis of user interactions with the web page between mouse clicks can be performed. Specifically, eye tracking can be used to evaluate the efficiency of information retrieval,
a) b)
c)
BACKGROUND
35
such as locating where the negative aspects are on a page, efficiency of online advertising, usability, navigation, overall design and many other components.
Other examples of studies using eye tracker are evaluate applications prototype, the visual attention when driving, study the actual site of a company or any life experiment using the eyesight.
An alternative to Eye tracking – Mouse tracking
Mouse tracking is the study of mouse’ movements and clicks over one object (web page, application, amongst others). From the data gathered by this study it’s possible to observe the interaction between the user and the correspondent object.
As both eye and mouse tracking have similar goals, both allow the generation of the task map (hotspots) of where the subjects navigated pages, this permits the methods to be directly compared. However, although they permit the same visualization does not mean that they exhibit the same results. Studies have been performed to compare both systems. These approaches investigated correlation values when users perform tasks in web pages. These values can range from 32% [Rodden et al., 2008], 42% [Rodden et al., 2007], 69% [Cooke, 2006], or from 84% to 88% [Chen et al., 2001].
The big question is: can the mouse tracker be used to replace the eye tracker? Mouse tracking has an advantage of being able to run without the user being aware, and thus is more realistic when people are surfing the internet. On the other hand, eye trackers are very expensive and can have some head limitations. Regarding the data retrieval from these methods, with the eye tracker there is access to data that would not be possible to collect from mouse tracking. The type of study, the variables that are to be studied, and also the significance of the study determine the hardware that we should use.
2.3. Visual Perception on the Web Pages
Recently, studies have been conducted on human visual behaviour when browsing web pages. Many researchers have focused on the topic of Internet search using search engines. Lorigo et al. [2008] studied the online search, describing what knowledge that
could be retrieved from the experience and the difficulties encountered. Comparing different search engines, they concluded that the metrics they used did not show significantly different values, thus asserting that visual processing and the complexity of reasoning are similar between search engines. They also concluded that the SERP (search engine results page), affects the visual behaviour. However, there were no significant differences in the success factors, time taken to perform the tasks, number of fixations and number of clicks. The individual’s satisfaction in relation to search engines differs due to subjective preferences of the individual. As the main difficulties identified when performing this study were interpreting the data gathered with the eye tracker, the difficulty of analysing the interaction between individuals and search results, and the difficulty of integrating the eye tracker studies with usability studies. The lack of feedback and analysis of the success of the task limit the types of studies that can be performed with eye trackers.
In 2004 a study was conducted where Granka et al. [2004] analysed the behaviour of individuals when conducting web searches to observe how they interact with the web page and the results they get from the search. Taking as a reference the time it takes for individuals to select a pre-determined link, this study demonstrates the complexity of the mental process involved in choosing the link, as well as the complexity of the information that is displayed. The order, search results are arranged, is related to the time that individuals give "attention" to them. Thus, the search is automatically restrained to the behaviour of the search engine and the way it presents its results.
Jansen and Pooch conducted a literature review of studies that have addressed the issue of Internet search engine results [Jansen and Pooch, 2001]. Initially they developed a survey which analysed all studies related to Internet search. Failing to directly compare the search engines, due to differences in the structure of the web pages, they used other information to verify if the concept of an information search on the Internet is universal. This compared the response time, number of responses, number of searches and information available. They concluded that despite the portals are different and the technology used in each is different, the concept of Internet search is universal. However, the researchers added that is necessary to standardize the metrics used to perform these
BACKGROUND
37
types of studies on the Internet so that they become more conclusive and easier to facilitate comparisons.
Hsieh-Yee [2001] conducted a study on human visual behaviour during the development of research on the Internet, including a literature review from 1995 to 2000 where he summarised all the studies regarding children and adults visuals’ behaviour. Most studies which focused on children's visual behaviour only described their interaction with the web. In the studies pertaining to adults, the main objective was to describe the visual patterns. Other factors in visual behaviour have also been investigated, including the organization of information and its presentation, the type of search task, the web experience, cognitive skills and affective state (experience of feeling or emotion). What distinguishes research in adults from children is the use of multiple methods of data gathering. Research on visual behaviour in web search requires that there be a commitment for the users perform the tasks in experimental conditions and requires a rigorous design and data analysis. Although these studies have an increasingly rigorous objective, there still exists a lack of acceptance of them as well as their validation.
In an experiment to establish if the difference in age groups influences the success in conducting research on the Internet, Bilal and Kirby conducted a study with adults and children [Bilal and Kirby, 2002]. In this study, they conclude that research on the Internet is affected by: the cognitive ability of users, affective state, and physical condition; variations in these leads participants to give differing answers depending on the task. The main results of this study highlight the ability of adults reformulate the search when faced with an impasse, the type of navigation used across pages and concentration while performing a task. The cultural experience of adults is one factor that distinguishes them from children, resulting in a higher success rate.
To investigate how people search for information when the best search result is not at the top, Guan et al, conducted a study using an eye tracker. They tried to determine what the most important areas were when seeing the results of a web search. The analysis showed that the performance decrease for searching for information is the result of: the decreased chance of willingly looking at lower down search results and/or the possible reliability in the ranking of search results of the search engine, although people may clearly see the
other results in lower positions. People are more likely to depreciate their own sense of objective relevance and conform to the classification established by the search engine [Guan and Cutrell, 2007].
In addition to the studies conducted on the online search, a few studies have focused on the usability and interactions with web portals. Jacob and Karn conducted a study where they validate interaction and usability studies between subjects and a Web page, based on the results extracted from an eye tracker [Jacob and Karn, 2003]. The main conclusion is that is possible to use the eye tracker to perform these studies but they observed some difficulties in interpreting the data from the eye tracker. When performing studies using eye trackers the goal of the study will affect how the variables are analysed. For instance, the analysis can be made either top-down, or bottom-up. The top-down are based in the cognitive and task related studies. The bottom-up relays only in the observation of data without taking into account the cognitive knowledge.
Pan et al. [2004] studied the importance of human visual behaviour in Web pages, through the analysis of the order in which pages were visited and their complexity. They concluded that the human visual behaviour when viewing Web pages is the result of the order in which pages are displayed, by the subjects’ cognitive knowledge and also the relationship between the sites visited. The results of gaze pattern (individuals’ visual path when viewing a visual stimulus) have shown relations between the different subjects’ visual behaviour and the structure of web pages.
Poole and Ball [2006] studied the usability and interactions between humans and computers using an eye tracker. With the results gathered with an eye tracker it’s possible not only to quantify the interaction of subjects with the computer but also to obtain other information as its significance when relating that information to the Web pages. Analysing different studies in the field, they identified variables and factors that indicate not only the time it takes individuals to perform specific tasks, but also to determine the task complexity, the difficulty of information retrieval, the type of Web pages structure, among others. With the knowledge of the interaction between human and computer, as well as information that can be extracted from this type of study, it becomes a very important tool for exhaustive analysis of the systems usability, as well as the effectiveness of the used information technologies/structures.
BACKGROUND
39
The Internet is an extremely important place for sociology researchers for testing theories of technology diffusion and the effects of the media, especially because it is uniquely capable of integrating different media and different forms of content.
DiMaggio et al. perform an analysis of studies by different sociologists found on the internet where a recurring theme in many areas is that the Internet tends to complete and not replace existing devices, or behaviour patterns. Furthermore, in each domain the social implications of this new technology depend on economic decisions, and legal policies that are shaping the Internet and making it institutionalized. Sociologists need to study the Internet more actively and, above all, synthesize research findings on individual user behaviour with detailed analyses of institutional, political and economic factors that might influence it [DiMaggio et al., 2001].
In a study conducted in 2001 by Bilal and Kirby they examined the success and information seeking behaviours of science students from seventh grade and graduate students in information science using Yahoo. Although graduate students have more success in finding the answer to the search task, and were more efficient in their use, they shared an information search behaviour common to children. The main factors that contributed to the differences in the pursuit of information between the two groups were: the ability to recover after an error, the navigation style and concentration on the task [Bilal and Kirby, 2001]. Moreover, Habuchi et al. conducted a study in which the aim was to investigate how the web browsing experience influences behaviour when viewing web pages. They used a detailed questionnaire to measure the web browsing experience from users and also analysed visual data using an eye tracking. This study found that previous experience of web browsing forms an effective visualization method or mental model of how to browse a Web page, increasing the efficiency of web browsing [Habuchi
et al., 2006].
Regarding comparisons between different users performing tasks online, Feusner and Lukoff, [2008] conducted a study where they define a mathematical formula to do statistical analysis on the differences in the visual scanpath obtained from users. Initially, based on the study of Salvucci and Anderson [2001] to detect differences in the viewing patterns of users (by area), this method was also used by other investigators [Holmes and
Josephson, 2002, 2006], [Pan et al. 2004], [Myers, 2005] [West et al., 2006]. In a second phase, they estimate the statistical deviation between the two groups, using their formula. As a main conclusion, they note the importance of doing the statistical analysis on the scanpath, in addition to the visual analysis. This allowed them to distinguish differences between visual behaviour of the group and the differences caused by random visualization variation [Feusner, 2008].
Browsing patterns
Fu et al., [2001]proposed an approach to reorganize web pages based on user access patterns. Their proposed methodology consists of three stages, pre-processing of the page, rating, and reorganizing the site. In the pre-processing stage, the pages were analysed to create an internal representation of the web page and the user's web pages navigation path (navigation between the different web pages) were extracted from the server. In the classification phase the researchers classified the pages into index pages and content pages. This classification was based on information gathered in the first phase. Finally, during the reorganization, the web site is examined to find better ways to organize the pages. In their tests, they concluded that this method was effective and practical to adapt the structure of the sites.
Different web sites offer different services to their customers. It is therefore inevitable that some of these customers have immediate access to desired information, while others will have to follow some links to get the information. Consequently the growth of the web site complexity, even for the customers who got the information very fast, they begin to be forced to go through several links to get it.
Doerr et al., [2007] described a system that analyses the data collected from a server to see what opportunities exist for improving the navigation of a site In their system, an administrator must manually enter a default query that is used to find issues with navigation. As shown in Figure 2.5, this system tracks and finds nodes that could be irrelevant, and with it remove it could be possible to improve the navigation.
BACKGROUND
41
Figure 2.4. Irrelevant node: All users leave node E always towards node G with little average time spent within E - this node is likely to be irrelevant [Doer et al., 2007].
Due to the evolution of technology and the Internet, the number of web pages has increased significantly in recent years. Web development has an important role in not only creating content, but also providing efficient and easy-to-use web pages. An important aspect in the development of a web page is to plan how the pages will be connected and how therefore the layout of the navigation path. In a study performed by Gillenson et al. [2000], they defined a taxonomy for web navigation between the different web pages in a website and its structure. They used this taxonomy to perform complex studies on features of the navigation between different web pages. This allowed them to verify if the web page is well built. This study also points to the ramifications of the main web page structures, which allow the user to jump between different branches’ web pages from one big company. They also describe how efficient navigation and web page structure can prevent the user getting lost in the web page and therefore become more efficient when browsing.
Niu et al. [2002] conducted a study where they state that pattern mining was a promising approach to make it possible for administrators adapt websites and better serve consumers. Assuming that previous navigation paths made by other users is an indicator of the interest of the new users, then the recording of the navigation through a servers logs can be used to guide future customers. Under this assumption, a navigation aid can be automatically generated for new visitors. In this study they analyze data mining for
dynamic adaptation of web sites. This approach is only valid for web pages that offer information on a specific theme and are well defined. However, this approach cannot be used for when users are exploring a site. The data mining process was based on three stages. In the first phase, information from the server logs was analysed and compressed to eliminate redundant errors and identify user sessions. The second stage uses the algorithm to retrieve the desired patterns. Finally these patterns are used to generate recommendations for other users who are browsing the same pages.
There have been other studies to improve structure on web page navigation and navigation patterns for further knowledge, please see: Eirinaki and Michalis [2007] and Ikumi et al. [2007]
Previously Gonçalves et al. [2011], studied if when users perform different tasks in the internet they use the same visual patterns depending on the task and on the web page where they perform the Task. In this study was presented an experiment using an eye tracker where the user visual behaviour was observed to verify the similarities and the differences, when performing different tasks in the internet. After recording all the user data, a statistical analysis was conducted. On this analysis was observed clear differences in the saccade rate when comparing the four different tasks’: searching using search engines, online shopping, exploring a site and search in a company site. It was also verified that the saccade rate didn’t depend on the web page where the task was realized. To validate the statistic data it was also presented the gaze maps, showing the visual patterns, where it can be seen the differences in the visual patterns, depending on the tasks that the user was performing.
Web analytics applications
Web analytics, sometimes mistaken as tools just for web traffic analyses, are tools that allow data measurement, collection, analyses and generates reports. These tools are used not just for web optimization but also to understand how the web pages works, what web pages were visited, if the ads were clicked, if the web pages is being profitable, amongst others. Companies and e-commerce web pages are the main users of web analytics tools. These tools are used to improve the efficiency of the web page and at the same time the visibility/advertising trough out the Internet.
BACKGROUND
43
One of the most known and widely-used applications [Rank, 2012] on web analytics is the Google Analytics [GoogleAnalitcs, 2012]. This tool offers the users detailed reports on websites’ activity. Developed for marketers this tool allows sites owners to analyse their sales, review product banners to improve efficiency of the sales, improve the advertising on other web pages, amongst other. Mainly used for e-commerce this tool allows the integration of Google AdWords and Google Analytics Content Experiments, using just one control panel, the marketer, can cross information of this 3 application and significantly improve the web page and business behind it. Other related web analytics applications are BuiltWith [2012], ClickTale [2012] and Moat [2012].
Founded in 2007 in Sidney, BuiltWith became the second more used web analytics tool in the Internet. This tool includes “widgets, analytics, frameworks, content management systems, advertisers, content delivery networks, web standards and web servers…” [BuiltWith, 2012]. As Google analytics being developed for marketers, bring a sales intelligence market analyses tool to improve the business. For developers it includes an API for report personalization and with the possibility to adapt the web analyses to each type of business.
One application that analyses a subject's internet navigation is ClickTale [2012]. This application uses mouse movements and positions to create heat maps of where the user placed the mouse. The path through the web pages visualized is also tracked by changes in the URL of sites being visited. Despite the fact that the application records and saves the user’s mouse navigation the information retrieval and the results of the analyses only are obtained / generated later. This means that the system is not useful for real-time applications.
Brand analytics by Moat [2012] is an application that studies advertising in a web page by trying to understand how a consumer pays attention to it in a web page. They study and analyse a series of 27 different metrics regarding to the users attention on advertisements. “These metrics focus on who’s viewing the ad impressions and for how long, as well as whether you’ve engaged in any sort of interaction (did you click on something? roll over a photo gallery? play a video? listen to music or a podcast?) and how much time you spent doing so” [Moat, 2012]. With this approach they offer a new
way of studying the visualization of advertisements through the analysis of human visual perception.
2.4. Summary
This chapter presented a background on the human visual system, visual perception and human visual attention when browsing web pages. The key structure of the human eye and it's functioning when receiving a visual stimulus was explained. Furthermore, this section described models of attention, namely the bottom-up and top-down models, and these influence how a visual stimulus is perceived and processed.
A review of the key studies on human visual attention when browsing web pages was presented. Applications and recent developments regarding web analytics were also presented to provide a better understanding of the work in this thesis.
45
3. WEB TASKS CLASSIFICATION
In previous research a study was conducted [Gonçalves, 2011], as described in chapter 2, that observed clear differences in the human visual system when performing different tasks. Although it is possible to state that the user’s visual patterns when performing different tasks are diverse, the type of task the user is performing is unclear.
In the study of Pan et al. [2004], they considered that the categories of tasks users perform on the Internet consist of free exploration, search for information, reading an informational page (newspaper) and searching through search engines. They selected one page of each type to examine task. Although our previous study based our tasks / methodology on the study of Pan et al. [Pan et al., 2004], we consider that first step is to distinguish whether the user is freely exploring a Web page or performing a task, considering that the tasks online all boil down to the mental process of search/finding information or else free exploration.
Therefore two approaches are presented in this chapter to detect the possibility of distinguishing a user’s visual behaviour when she/he is simply exploring a web page or
![Figure 2.1. Itti and Koch computational model of attention. From [Itti et al., 1998]](https://thumb-eu.123doks.com/thumbv2/123dok_br/16057792.1105817/40.892.207.688.142.554/figure-itti-koch-computational-model-attention-itti-et.webp)