Chemical Engineering Department
C
HARACTERIZATION AND
P
HENOMENOLOGICAL
P
HOTOELECTROCHEMICAL
P
RODUCTION FROM
Tânia Sofia Teixeira Lopes
Dissertation presented to obtain the degree of
DOCTOR IN CHEMICAL AND BIOLOGICAL ENGINEERING
By the
UNIVERSITY OF PORTO
Adélio Miguel Magalhães Mendes,
2014
Chemical Engineering Department
HENOMENOLOGICAL
M
ODELING OF
LECTROCHEMICAL
C
ELLS FOR
H
YDROGEN
RODUCTION FROM
S
OLAR
E
NERGY
Tânia Sofia Teixeira Lopes
Dissertation presented to obtain the degree of
BIOLOGICAL ENGINEERING
By the
UNIVERSITY OF PORTO
SUPERVISOR:
Adélio Miguel Magalhães Mendes, Full Professor
A
CKNOWLEDGEMENTS
I am grateful to the Portuguese Foundation for Science and Technology (FCT) for my PhD grant (SFRH/BD/62201/2009), to the European Commission (Project NanoPEC - Nanostructured Photoelectrodes for Energy Conversion; contract number 227179) and to the FCT (H2Solar – PTDC/EQU-EQU/107990/2008) for funding. I would like to acknowledge LEPABE, DEQ and FEUP for providing me all the facilities to develop my work.
I would like to thank my advisor, Professor Adélio Mendes, for his wisdom, patience and guidance throughout my PhD. The opportunity to develop my work in such an interesting field was an amazing experience, for which I am extremely grateful to Professor Adélio Mendes.
A special thanks to Doctor Luísa Andrade, for her guidance, critical insights and integrity that were fundamental in the development of my work. But, most of all, for being the good friend that always encouraged me to pursue my dream.
I gratefully acknowledge Doctor Laura Meda, Professor Michael Grätzel, Professor Kevin Sivula, Professor Sixto Gimenez, Professor Francisco Fabregat-Santiago and Professor Juan Bisquert for welcoming me in their groups. The fruitful collaborations I have experienced with these highly capable people have helped me to become the professional and person that I am now. I also acknowledge all the facilities and materials provided for the development of the experimental part of my thesis at ENI, LPI and at GDFO groups.
I would also like to thank my lab-mates for their patience and for contributing to a productive but fun working environment. Special thanks to my hydrogen production mate Paula Dias and to Joana Ângelo.
I am particularly grateful for the important discussions and collaborations with Alessandra Tacca and Florian Le Formal. Thanks to my Spanish friends for the amazing times that we spent together in Castellón…
I am very thankful to all my friends, for their support, affection and for all the good moments that we have been living together.
I would like to express much appreciation to my lovely parents and to my brother for the upbringing, love, support, guidance, interest and pride that I received.
Last, but definitely not least, I would like to express my love to Luís. Thank you for all the encouragement and for helping me to overcome the difficult moments I went through while developing this thesis, always with a smile, and celebrating the good ones …
“It’s true that humanity has seen a succession of crises, wars and atrocities, but this negative side is offset by advances in technology and cultural exchanges.”
P
REFACE
The present work was developed at the Laboratory for Process Engineering, Environmental, Biotechnology and Energy, Chemical Engineering Department of the Faculty of Engineering – University of Porto (FEUP).
Part of the studies was also performed at the Laboratory of Photonic and Interfaces (LPI), École Polytechnique Fédéral de Lausanne (EPFL), Switzerland, under the supervision of Professors Michael Grätzel and Kevin Sivula and at the Institute Eni Donegani, Center for Non-Conventional Energy, Italy, under supervision of Doctor Laura Meda.
C
ONTENTS
Abstract xi
Sumário xiii
Figure captions xvii
Table captions xxiv
Chapter 1
INTRODUCTION 1
1.1 Photoelectrochemical cells systems overview 2
1.1.1 Solar water splitting arrangements 2
1.1.2 Working principles of photoelectrochemical cells 6
1.1.3 Materials overview 10
1.1.4 Stability issues – photocorrosion 16
1.1.5 PEC reactors 19
1.2 Electrochemical impedance spectroscopy 24
1.2.1 Fundamentals 25
1.2.2 Electrical analogues 28
1.2.3 EIS analysis of PEC cells for water splitting 33
1.3 Objectives and outline of this work 36
Nomenclature 38
References 41
Chapter 2 DEVELOPMENT AND TEST OF ATEST BENCH FOR PHOTOELECTROCHEMICAL DEVICES
Abstract 51
2.1 Introduction 53
2.2.1. Electrochemical characterization 59
2.3 Experimental 62
2.3.1 Photoelectrochemical cell setup 62
2.3.2 I-Vmeasurements 63
2.3.3 EIS measurements 64
2.4 Results and discussion 64
2.4.1 Photocurrent-voltage characteristics 64
2.4.2 Electrochemical impedance measurements 65
2.5 Conclusions 69
Acknowledgements 70
Nomenclature 71
References 73
Chapter 3 HEMATITE PHOTOELECTRODES FOR WATER SPLITTING:EVALUATION OF THE FILM THICKNESS
ROLE BY IMPEDANCE SPECTROSCOPY 77
Abstract 77
3.1 Introduction 79
3.2 Experimental 80
3.2.1 Photoelectrochemical cell setup 80
3.3 Results and discussion 81
3.3.1 Film thickness 81
3.3.2 Photocurrent density-voltage characteristics 82
3.3.3 Electrochemical impedance spectroscopy measurements 86
3.4 Conclusions 98
Acknowledgements 99
Nomenclature 100
Chapter 4
AN INNOVATIVE PHOTOELECTROCHEMICAL LAB DEVICE FOR SOLAR WATER SPLITTING 107
Abstract 107
4.1 Introduction 109
4.2 The new PEC cell 109
4.3 Materials and methods 112
4.3.1 WO3 photoelectrode on metal substrate 112
4.3.2 WO3 photoelectrode on TCO glass substrate 113
4.3.3 Fe2O3 photoelectrode on TCO glass substrate 113
4.3.4 J-V measurements 113
4.3.5 EIS measurements 114
4.4 Results and discussion 115
4.4.1 WO3 photoelectrodes 116
4.4.2 Fe2O3 photoelectrode on a glass substrate 124
4.5 Conclusions 129
Acknowledgements 130
Nomenclature 131
References 132
Chapter 5 UNSTEADY STATE PHENOMENOLOGICAL MODEL APPLIED TO PHOTOELECTROCHEMICAL CELLS FOR HYDROGEN PRODUCTION FROM WATER SPLITTING
135
Abstract 135
5.1 Introduction 137
5.2 Development of the PEC cell model 139
5.2.1 Electrons balance 144
5.2.2 Holes balance 146
5.2.3 Hydroxyl ions balance 148
5.2.4 Electrolyte-Platinum contact: Butler-Volmer equation 149
5.2.6 Dimensionless equations 153
5.3 Experimental 155
5.4 Results and discussion 156
5.4.1 J-V characteristic 156 5.5 Conclusions 163 Acknowledgements 164 Nomenclature 165 References 168 Chapter 6
A
BSTRACT
The awareness concerning carbon dioxide emissions and the depletion of fossil fuel reserves motivate the development of innovative processes to take advantage from renewable energy sources. Photoelectrochemical (PEC) cells for hydrogen production using as raw materials water and solar energy are nowadays considered as a sustainable route to produce transportable and storable hydrogen, as chemical feedstock. Although this route to store solar energy in hydrogen form is very attractive, there are many challenges to overcome. One of the most critical challenges concerning water photo-cleavage is finding a stable semiconductor material with the conduction band edge positioned at a higher energy level than the water reduction potential. Few semiconductor metal oxides were identified to accomplish efficiently the water oxidation, exhibiting a valence band positioned at an energy level sufficiently lower and a suitable bandgap. For these metal oxides an external bias should be given in order to bring the electron Fermi potential to an energetic level higher than the hydrogen evolution potential. This is the case of hematite and tungsten trioxide, the semiconductors studied and characterized under biased systems in the present work.
In the past few years, research on PEC cells technology is growing quite fast and remarkable developments on various aspects have been achieved, mainly concerning the development of new semiconductors for water photosplitting. The objective of this thesis is to contribute to the insightful study and characterization of PEC cells for hydrogen production, mainly electrochemical characterization and phenomenological modeling investigation since the identification of the main sources of inefficiencies, such as overvoltages and resistances, can highly contribute for the PEC cells understanding and optimization. To accomplish these goals, an automated test bench was designed and assembled. It was used for investigating the electrochemical
behaviour of PEC cells, namely for obtaining J-V characteristics and perform electrochemical impedance spectroscopy (EIS) and cyclic voltammetry (CV) studies.
Under dark conditions relevant information about the major internal charge transfer resistances, as well as the main charge accumulation zones in the photoelectrode and in the semiconductor/electrolyte interface were gathered. An electrical analogue was used to fit the experimental EIS spectra allowing to quantitatively study the charge transport resistance and capacities of the semiconductor layer and its interface with electrolyte.
An innovative PEC cell reactor was also designed and built for indoor and outdoor conditions for characterizing photoelectrodes up to 10 x 10 cm2. This new PEC device is very versatile since it is suitable for continuous feed operation with direct illumination but also to operate tilted. For continuous feed operation a hydrophobic porous membrane of Teflon was placed on the top of the cell allowing gas permeation but no liquid electrolyte leakage. A complete device characterization and optimization was performed in order to test its applicability under real outdoor conditions. A first PEC prototype was developed based on this device and presented on the industrial panel review of project NanoPEC.
Finally, a dynamic phenomenological model was developed and the results critically compared to the experimental results obtained with hematite photoelectrodes. This model was also used for studying the electrochemical reaction rate at the counter-electrode side.
S
UMÁRIO
A atenção dada atualmente às emissões de dióxido de carbono para a atmosfera e à depleção das reservas de combustíveis fósseis, tem motivado um investimento crescente no desenvolvimento de processos inovadores de produção de energia a partir de fontes renováveis. O uso de células fotoeletroquímicas para a produção de hidrogénio a partir de água e energia solar (células PEC – “PhotoElectrochemical
Cells”) tem sido considerado um dos caminhos mais promissores para o
desenvolvimento de uma solução sustentável para a transformação da energia solar num combustível químico – o hidrogénio - transportável e armazenável.
Embora este caminho para o ‘armazenamento’ de energia solar na forma de hidrogénio pareça muito atrativo, há ainda muitos desafios a ultrapassar para a sua concretização de uma forma economicamente viável; de entre eles, um dos mais críticos é a identificação de um material semicondutor estável e eficiente para as células de fotoclivagem da água. Até ao momento foi identificado um conjunto reduzido de óxidos de metal semicondutores capazes de efetuar eficientemente a oxidação da água, por possuírem uma banda de valência que se encontra a um nível energético suficientemente baixo para permitir a oxidação da água e com um hiato energético adequado para maximizar a capacidade de absorção da radiação solar. No entanto, a sua banda de condução encontra-se a um nível energético abaixo do potencial de redução da água, pelo que é necessário fornecer ao sistema um potencial elétrico externo para elevar o potencial de Fermi dos eletrões acima do potencial de formação do hidrogénio. Dentro desse grupo de materiais encontram-se a hematite e o trióxido de tungsténio que são os semicondutores estudados e caracterizados no presente trabalho.
Nos anos recentes o investimento em investigação em células PEC tem crescido de forma acentuada tendo sido alcançados avanços assinaláveis em vários domínios, nomeadamente no que diz respeito ao desenvolvimento de novos semicondutores. O
objetivo desta tese é o de contribuir com o estudo esclarecedor e a caracterização detalhada de células PEC para a produção de hidrogénio, principalmente no que diz respeito à sua caracterização eletroquímica e à sua modelização fenomenológica, dado que a identificação das principais fontes de ineficiência, como sobrevoltagens e resistências, pode dar um contributo decisivo para a sua compreensão e otimização.
Para atingir estes objetivos foi projetada e montada uma bancada de teste automatizada. Esta bancada foi utilizada para investigar o comportamento eletroquímico das células PEC, nomeadamente para a obtenção das curvas características I-V e para o desenvolvimento dos estudos de espetroscopia de impedância eletroquímica (EIS – “Electrochemical Impedance Spectroscopy”) e de voltametria cíclica (CV – “Cyclic Voltammetry”).
Informações relevantes acerca das principais resistências internas à transferência de carga, assim como das mais importantes zonas de acumulação de carga no fotoelétrodo e na interface semicondutor/eletrólito, foram obtidas nos estudos em condições de escuro. Um análogo elétrico foi ajustado ao espectro de EIS obtido experimentalmente, permitindo o estudo quantitativo das resistências e capacitâncias associadas ao transporte de carga no semicondutor e na sua interface com o eletrólito.
Foi também projetado e construído um reator PEC inovador para caracterização de fotoeletrodos até 10 x 10 cm2, adequado ao uso em condições de interior e exterior. Este equipamento é extremamente versátil dado que permite a operação com alimentação contínua de eletrólito e em posição vertical ou inclinada para otimizar a exposição à luz solar. Para o funcionamento com alimentação contínua foi colocada no topo da célula uma membrana hidrofóbica porosa de Teflon, que permite a permeação do gás mas impede a fuga de eletrólito. Foi efetuada uma caracterização completa deste equipamento, bem como a sua otimização, para testar a sua aplicabilidade em condições reais de exterior. Com base neste trabalho foi desenvolvido um protótipo inicial que foi apresentado ao painel de revisão do projeto NanoPEC.
Finalmente, foi desenvolvido um modelo dinâmico fenomenológico, sendo os seus resultados comparados de forma crítica com os resultados experimentais obtidos com os fotoelétrodos de hematite. Este modelo foi igualmente usado para o estudo da velocidade da reação eletroquímica no contra-elétrodo.
F
IGURE
C
APTIONS
Figure 1.1 - Solar water splitting based on PEC cells, PV cells or combined
arrangements systems. The red line represents the “holy grail” of the PEC system.
2
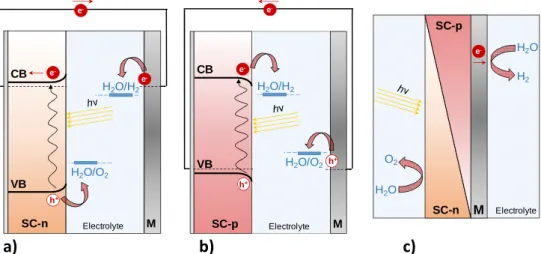
Figure 1.2 - No-biased single photo-system configurations for solar water
splitting (SC - semiconductor; M - metal) - (adapted from [14]): a) n-type semiconductor photoanode and a metal counter-electrode; b) p-type semiconductor photocathode and a metal counter-electrode; and c) monolithic configuration.
5
Figure 1.3 - Different no-biased multiple photo-system configurations for solar
water splitting (SC - semiconductor; M - metal) - (adapted from [14]): a) n- and p-type semiconductors wired; b) n- and p-type semiconductors linked by an ohmic contact; and c) hybrid systems.
6
Figure 1.4 - Energetic diagram of a PEC cell under dark (a) and illumination (b)
conditions.
7
Figure 1.5 - Schematic illustration of a semiconductor with a hypothetically
ideal bandgap of 1.9 eV. Right: Intensity of sunlight vs. wavelength for AM 1.5G conditions. The grey area represents the part of the spectrum that can be absorbed by a semiconductor with a bandgap of 1.9 eV.
9
Figure 1.6 - Energy band positions for various semiconductors at pH 14. [13] 10
Figure 1.7 - Relative positions of decomposition Fermi Levels of a
semiconductor with respect to its band edges: a) cathodically and anodically stable, b) cathodically and anodically unstable, c) cathodically stable but anodically unstable and d) anodically stable but cathodically unstable. Adapted from ref [77].
Figure 1.8 - Positions of band edges and decomposition Fermi levels for
different oxide and non-oxide semiconductors at pH 7. Adapted from [37] .
18
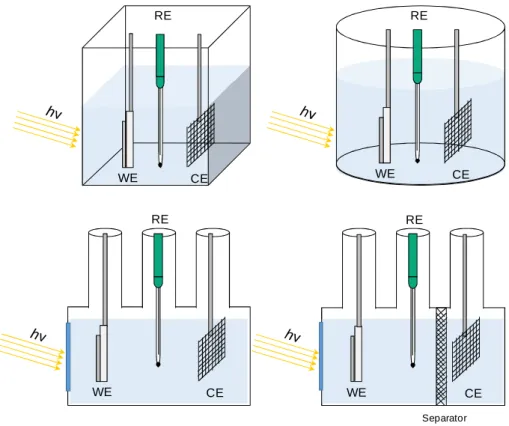
Figure 1.9 - Example of PEC cells for water splitting with different designs, in a
3-electrode configuration. WE – working electrode, CE – counter electrode and REF – reference electrode.
20
Figure 1.10 - Sinusoidal voltage perturbation and resulting sinusoidal current
response, phase-shifted by φ. V0 - amplitude of the voltage signal; I0 -
amplitude of the current signal; Voc – open-circuit voltage; Ioc – open-circuit
current.[90]
26
Figure 1.11 - Graphical representation of the AC impedance of a PEC cell in
3-electrodes configuration: a) Nyquist diagram; b) impedance Bode diagram; c) phase Bode diagram.
27
Figure 1.12 - Current versus voltage curve showing pseudo-linearity.
(Current-voltage characteristic is a steady-state technique that determines the performance response of a photoelectrode in the dark and under different light conditions. The I-V characteristic applied for water splitting is usually performed in a three electrodes configuration (being the third one is the reference electrode, usually Ag/AgCl).
28
Figure 1.13 - Graphical representation of the AC impedance of a resistor (R = 5
kΩ): (a) Nyquist diagram; (b) impedance Bode diagram; (c) phase Bode diagram. 29
Figure 1.14 - Schematic representation for an n-type semiconductor of:
depletion layer zone and the electrical double layer (Helmholtz layer).
30
Figure 1.15 - Graphical representation of the AC impedance of a capacitor: a)
Nyquist diagram; b) impedance Bode diagram; c) phase Bode diagram. ω is the radial frequency; C = 1 µF.
31
Figure 1.16 - Graphical representation of the AC impedance of a capacitor in
series with a resistor: a) Nyquist diagram; b) impedance Bode diagram; c) phase Bode diagram. ω is the radial frequency; C = 1 µF and R = 5 kΩ.
Figure 1.17 - Circuit diagram and Nyquist plot representing the impedance
behavior of an electrochemical reaction: a) Nyquist diagram; b) impedance Bode diagram; c) phase Bode diagram. ω is the radial frequency; ZR = 8 kΩ and
ZC = 1 µF.
33
Figure 1.18 - Proposed electric models to describe PEC cells behavior: a) simple
RC element used to calculate the flat band potential and the donor density from Mott-Schoktty equation, applicable at high-frequency; b) electric model taking into account trap states (interface states at low-potentials and near the flat band potential and deep donor levels far from the flat-band potential); c) electric model describing electron transfer from the conduction band to the redox system via two steps: electron trapping in the surface states and posterior tunneling to the redox system; d) typical response of hematite photoelectrodes prepared by APCVD.[34]
34
Figure 2.1 - Variables affecting the rate of an electrode reaction.[3] 54
Figure 2.2 - View of the test bench for the electrochemical characterization of
PEC cell for water splitting. Three light sources with different illumination areas and accuracy were used; a) xenon lamp with an aperture of 2 inches diameter; b) solar simulator class A with 2 × 2 inches and c) solar simulator class B with 6 × 6 inches.
56
Figure 2.3 - Reflectance of the broadband reflector mirror with the enhanced
aluminum coating.
57
Figure 2.4 - Small PEC cell supported on the precision rail and carrier in a
3-electrode configuration. In the inset figure a top-view is presented.
57
Figure 2.5 - Ideal behavior for an n-type semiconductor in the dark a) and under
irradiation b).[11]
59
Figure 2.6 - Incident photon-to-current conversion efficiency (IPCE) installation
scheme view for PEC cells characterization.
60
Figure 2.7 - Flow diagram for measurement and characterization of a
material-electrode system.[15]
62
Figure 2.9 - Photocurrent-voltage curves of the undoped-Fe2O3 electrode in
the dark (blue solid line) and under 1 sun simulated light (red solid line).
65
Figure 2.10 - a) Nyquist diagram and b) Bode plots obtained in the dark and under simulated sunlight at 0.4 V in a 2-electrode configuration.
66
Figure 2.11 - a) Nyquist diagram and b) Bode plots obtained in the dark and
under simulated sunlight at 0.4 VAg/AgCl in a 3-electrode configuration.
68
Figure 3.1 - Absorption curves for the different samples; the absorbance was
determined assuming a Lambertian relation.
82
Figure 3.2 - Photocurrent density-voltage characteristics of the prepared
photoanode samples A to D in the dark (dashed lines) and under simulated 1 sun illumination (100 mW•cm-2, solid curves).
85
Figure 3.3 - Energy diagram for an n-type semiconductor in charge-transfer
equilibrium with the electrolyte.
87
Figure 3.4 - Energy diagram of semiconductor/electrolyte interface with the
corresponding electrical circuit analogue.
99
Figure 3.5 - Nyquist spectra for samples A – D at 1.2 VRHE, 1.4 VRHE and 1.7 VRHE.
Dots represent the experimental data ( - 1.2 VRHE, - 1.4 VRHE, - 1.7 VRHE);
lines represent the fitted model given in Figure 3.4.
90
Figure 3.6 - Impedance results obtained by fitting the experimental data to the
equivalent electrical circuit shown in Figure 3.4 plotted versus the applied potential with reference to RHE: a) Bulk semiconductor resistances; b) Charge transfer resistance; c) Space charge capacity; d) Helmholtz capacity.
91
Figure 3.7 - Mott–Schottky plots calculated from CSC values determined from
fitting the impedance spectra for all range of applied bias potential. The inset table shows the obtained values for donor density and flat band potential determined from the slop of C2
SC
1 / vs. applied potential and by the extrapolation of C2
SC
1 / =0 , respectively.
95
Figure 3.8 - Comparison between the normalized resistance and capacitance
values obtained for the four different samples under study at 1.25 VRHE applied voltage. Symbols and represents sample A , B, C and D,
respectively.
Figure 3.9 - a) SEM analysis of the exposed TCO on sample D (10.6 nm) and b)
the respective EDS analysis related to the two marked zones, Z1 and Z2.
97
Figure 4.1 - 10 × 10 cm2 photoelectrochemical cell: a) disassembled, b) under
operating conditions and c) detail of the innovative feeding system. 1 – Transparent acrylic cap (gas collection chamber); 2 – Teflon membrane; 3- transparent acrylic cap (electrodes contacts); 4 – photoelectrode; 5 – Diaphragm to separate both electrodes; 6 - Pt-counter electrode; 7 – black acrylic for light blocking; 8 – transparent window; 9 – transparent PEC cell body;
10 - removable metallic window; 11- electrolyte inlet; 12 – electrolyte outlet.
110
Figure 4.2 - 10 × 10 cm2 photoelectrochemical cell with a mirror system to
redirect the light beam.
112
Figure 4.3 - J-V characteristics obtained for metal and glass WO3 photoanodes,
under dark and 1 sun light conditions, in a 2- and 3-electrodes configurations. All the measurements were performed without membrane. WO3-Metal:
Sample of WO3 on metal substrate, WO3-Glass: Sample of WO3 on TCO glass
substrate.
117
Figure 4.4 - J-V characteristics of the WO3 anodized metallic sample in the dark
and under 1 sun solar radiation for the three situations under study: without membrane (□), with Nafion® membrane (◊) and with Teflon® diaphragm (ᴏ). WO3-Metal: Sample of WO3 on metal substrate.
118
Figure 4.5 - Left: Nyquist plots for the three situations under study: without
membrane (□), with Nafion® (◊) and with Teflon® (ᴏ) tape at three different applied potentials (1.00 VRHE, 1.25 VRHE and 1.45 VRHE); Right: Nyquist plots
zooming for the case of using a Teflon® diaphragm. WO3-Metal: Sample of WO3
on metal substrate.
119
Figure 4.6 - Left Axis: Hydrogen production rate (mmol•cm-2) for the case of
not using membrane (□), with Nafion® membrane (◊) and with Teflon® diaphragm (○). Right axis: Solar-to-hydrogen PEC cell efficiency (%) for the case of not using membrane (■), with Nafion® membrane ( ) and with Teflon®
diaphragm (●).WO3-Metal: Sample of WO3 on metal substrate. Both plots were
calculated with experimental data obtained in a 2-electrode configuration.
Figure 4.7 - J-V characteristics for the WO3 sample prepared by the blade
spreading method, in the dark and under 1 sun solar radiation for the three situations under study: without membrane (□), with Nafion® membrane (◊) and with Teflon® membrane (ᴏ), all in a 2-electrode configuration. WO3-Glass:
Sample of WO3 on TCO glass substrate.
122
Figure 4.8 - Nyquist a) and b) Bode plots for the three situations under study:
no membrane (□), with Nafion® (◊) and with Teflon® diaphragm (ᴏ) at an applied potential of 1.25 VRHE. WO3-Glass - Sample of WO3 on TCO glass
substrate.
123
Figure 4.9 - Left Axis: Hydrogen production rate (mmol•cm-2) for the case of
not using membrane (□), with Nafion® membrane (◊) and with Teflon® diaphragm (○). Right axis: Solar-to-hydrogen PEC cell efficiency (%) for the case of not using membrane (■), with Nafion® membrane ( ) and with Teflon® diaphragm (●).WO3-Glass: Sample of WO3 on glass substrate. Both plots were
calculated with experimental data obtained in a 2-electrode configuration.
124
Figure 4.10 - J-V characteristics for the undoped-Fe2O3 sample prepared by the
USP method in the dark and under 1 sun solar radiation without (□) and with Teflon® diaphragm (ᴏ) under: a) 2- and b) 3-electrodes configuration. Fe2O3
-Glass: Sample of Fe2O3 on TCO glass substrate.
125
Figure 4.11 - Left Axis: Hydrogen production rate (mmol•cm-2) for the case of
not using membrane (□) or using a Teflon® diaphragm (○). Right axis: Solar-to-hydrogen PEC cell efficiency (%) for the case of not using membrane (■) or using a Teflon® diaphragm (●). Fe2O3-Glass - Sample of Fe2O3 on TCO glass
substrate. Both plots were calculated with experimental data obtained in a 2-electrode configuration.
126
Figure 4.12 - Nyquist and Bode plots for the two situations under study:
without membrane (□) and with Teflon® diaphragm (ᴏ) at an applied potential of 1.00, 1.25 and 1.45 VRHE. Fe2O3-Glass - Sample of Fe2O3 on TCO glass
substrate.
Figure 4.13 - a) Nyquist plots comparing a PEC system with undoped-Fe2O3
under 1 sun illumination (■) and a dummy cell (■), at an applied bias potential of 1.5 VRHE and 2.3 VRHE, respectively. b) Nyquist plots comparing the Pt-Pt PEC
system with (■) and without a Teflon® diaphragm (■) at 2.3 VRHE.
128
Figure 5.1 - Schematic representation of the photoelectrochemical cell used to
carry out the water photo-splitting reaction.[17]
139
Figure 5.2 - Scheme of the modeled photoelectrochemical cell for
photo-assisted water splitting. The TCO/semiconductor interface positioned at x=0 and the electrolyte/Pt counter-electrode placed at
x
=
b
define the limits of the photoanode and cathode, respectively. The electrolyte solution fills the free volume between x=L andx
=
b
.142
Figure 5.3 - Experimental (squares symbols) and simulated (red line) J-V
characteristic curves under 1 sun front illumination.
158
Figure 5.4 - Simulated electron (left) and holes (right) densities profiles. 159
Figure 5.5 - Simulated hydroxyl ions concentration profiles in the electrolyte
bulk.
160
Figure 5.6 - Simulated platinum overpotential (left) and applied potential (right) vs. current density. The
Pt
η vs. ln(J) is represented in the inset plot.
161
Figure 5.7 - Exchange current density parameter effect on the current-potential
characteristics curves. The solid red line is the reference case as presented in Table 5.1.
162
Figure 5.8 - Ohmic resistance effect on the current-potential characteristics
curves. The solid red line is the reference case as presented in Table 5.1
163
T
ABLE
C
APTIONS
Table 1.1 - Non-oxide n-type semiconducting materials with small bandgap.
[73]
14
Table 1.2 - Examples of n-p photoelectrochemical cells for water splitting
(Figure 1.3a).
15
Table 1.3 - Common reference electrodes for PEC research overview.[83] 23
Table 3.1 - Thicknesses and photocurrent-voltage performances of the ultra
thin-film Fe2O3 photoanodes.
85
Table 4.1 - Summary of the characterization parameters. 114
Table 5.1 - Simulator input parameters. The values extracted from the literature
are indexed to the corresponding reference, the values of the experimental set-up are identified as “Exp.” and the model values fitted to the experimental J-V curve are identified as “Fit”.
Chapter 1
1)
Chapter 1
I
NTRODUCTION
The awareness concerning carbon dioxide emission and the depletion of fossil fuel reserves motivates the development of innovative processes to take advantage from renewable energy sources.[1] The world power consumption is currently about 13 TW and it is expected to increase up to 23 TW by 2050.[2] With approximately 120 PW of solar energy continuously striking the earth at any given moment, the challenge in converting sunlight into electricity via photovoltaic (PV) cells is to reduce the cost per watt of delivered solar electricity, which is already ca. 0.65 €/Wp for crystalline silicon modules. The solar PV technology has greatly evolved in the last decade and it is now a well-established way to convert solar energy into electric energy, which accounts presently more than 21 GW installed worldwide.[3] Nevertheless, this technology only works in a daily basis and it largely depends on the amount of solar radiation available. Thus, an effective method to store energy for later dispatch is still needed.[4] A practical way to convert sunlight into a storable energy form is using a photoelectrochemical (PEC) cell that splits water into hydrogen and oxygen by light-induced electrochemical processes.[5] Hydrogen production via photoelectrochemical water splitting is a thriving alternative that combines photovoltaic cells with an electrolysis system.[6, 7] The major advantage is that solar harvesting, conversion and storage are combined in a single integrated system, reducing the overall costs.[8, 9] The hydrogen generated by this process has the potential to be a sustainable carbon-neutral fuel since it is produced from a renewable source and it can be stored or transformed into other chemicals such as methanol or methane.[5, 10]
The present chapter introduces and reviews the state-of-the-art PEC cells materials and technologies. The PEC cell operating mechanisms will be discussed in detail. Finally, the main goals to be accomplished in the present work are presented.
1.1
P
HOTOELECTROCHEMICAL CELLS SYSTEMS OVERVIEW11.1.1 SOLAR WATER SPLITTING ARRANGEMENTS
Converting sunlight into hydrogen and oxygen through water splitting can be accomplished via different technologies, as sketched in Figure 1.1. More specifically, via three general types of devices: i) composed devices - photovoltaic (PV) cells associated with an electrolyzer or photovoltaic cells associated with a PEC cell; ii) stand alone devices - semiconductor-liquid junction (SCLJ) photoelectrochemical cell[11-14]; and iii) by thermochemical cycles.[15] The third technology will not be considered in this introduction chapter.
Figure 1.1 - Solar water splitting based on PEC cells, PV cells or combined arrangements systems. The red
line represents the “holy grail” of the PEC system.
1
Adapted from: Lopes, T., Andrade, L. and Mendes, A., Photoelectrochemical Cells for Hydrogen Production from Solar Energy in Solar Energy Sciences and Engineering Applications, N.E.A. Akbarzadeh, Editor. 2013, CRC Press.
Composed devices
PV+Electrolyzer PV + PEC Cell
Single devices
Biased Chemical Biased PV/PEC PV/PV PEC/PEC No-Biased Single Bandgap Multiple BandgapCOMPOSED DEVICES
Up to today, no semiconductor photoelectrode is able to efficiently perform alone water splitting and thus an extra bias must be supplied. The most developed technology is the PV device/electrolyzer arrangement where the photovoltaic cells are silicon based, achieving maximum efficiencies of 15 %, and efficiencies of electrolyzers is often around 75 %2. For instance, combining commercial 12 % efficiency PV modules with a water electrolysis unit operating with an energy conversion efficiency of approximately 65 % (output voltage of 1.9 V) results in a solar-to-hydrogen (STH) efficiency of about 7.8 %.[16-18] Only combining optimized PV technologies it is possible to achieve higher solar-to-hydrogen conversion efficiencies.[19, 20]
Even if biasing an electrolyzer with a separate set of solar cells is very attractive from an efficiency point of view, the fact of involving two separate devices complicates the system and increases the cost,[9, 13] besides being more energy dissipative. Furthermore, in a system PV + electrolyzer is required at least four silicon PV cells connected in series to generate the required voltage for water splitting, which under unfavorable climatic conditions such as partial shading, haze or cloudiness may ultimately interrupt the photoelectrolysis. Similar problems are observed when a PV cell is used as external bias for a PEC cell to promote water splitting. In this case, the electric current generated by the PV cell goes directly to the PEC cell instead of feeding an electrolyzer, resulting in a cheaper but not necessarily more efficient embodiment. [11, 14] Still, two separated parts must be considered when estimating the initial and operating costs. Moreover, the available area for solar exposure must be substantially increased since both PV and PEC cells have to be illuminated.[14, 20] In this sense, a more effective approach would be to “merge” the PV cell with an electrolyzer to make photoelectrochemical devices with a semiconductor-liquid junction. Thus,
2
The efficiency of an electrolyzer is defined as ηZ = E∆ °/V, where E° is the thermodynamic cell
potential (1.23 V for water electrolysis) and V is the voltage applied to the cell under operating condition.
several efforts have been made to design a monolithic system to partially avoid the previously mentioned technological and economical drawbacks.[14]
SINGLE DEVICES
Single water splitting devices (Figure 1.1) can be divided into biased and zero biased systems. Concerning biased systems, there are chemically biased photo-assisted photoelectrolysis cells and tandem devices.[11, 14] In the first case, the bias is achieved using two different electrolytes (e.g. acid and basic electrolytes) placed in two separated half-cells. However, this configuration is not self-sufficient, relying not only on sunlight but also on additional input of chemicals to stabilize the electrolyte solutions.[14] In the tandem approach, the cell is normally characterized by layered stacked or hybrid structures involving several different semiconductor films placed on top of each other. In this configuration, at least one of the substructures must work as a bias source. These internal biased photoelectrode tandem structures can be subdivided into: i) PV/PEC [21, 22]; ii) PV/PV[23] and; iii) PEC/PEC [24].
The use of PV/PEC systems has an advantage over PV/PV systems because the PEC face (layer) can replace the face conductor grids that partially obscure the PV layer. Consequently, PEC panels are able to reduce some cost components and improve photon capture of PV layer.[25] Recently it was proposed a new multiphoton combination of a PEC cell and two dye cells (tandem arrangement).[26] Three different architectures were suggested. The authors found that the “trilevel” tandem architecture (hematite/squaraine dye/black dye) produces the highest operating current density. The expected highest solar-to-hydrogen efficiency was about 1.36 %. However, this value is far below the expected 3.3 % that should be possible with the nanostructured hematite photoanodes used.[26] More recently Abdi and co-authors developed a tandem configuration, combining tungsten-doped bismuth vanadate photoanode with an earth-abundant cobalt phosphate water-oxidation catalyst and a double- or single-junction amorphous Si solar cell. This device produces stable short-circuit water-splitting photocurrents of ~ 4 mA·cm-2 for the double junction solar cell and 3 mA·cm-2 for the single junction under 1 sun illumination. The 4 mA·cm-2
photocurrent corresponds to a solar-to-hydrogen efficiency of 4.9 %, which is the highest efficiency yet reported for a stand-alone water-splitting device based on a metal oxide photoanode.[27]
Photoelectrochemical devices with no additional bias represent a prospective pathway to overcome the complexity of biased systems. No-bias photoelectrochemical devices comprise single and multiple photo-system arrangements. The possible arrangements of single photo-system are:
i) n-type semiconductor photoanode and a metal counter-electrode (Figure 1.2a)[28];
ii) p-type semiconductor photocathode and a metal counter-electrode (Figure 1.2b)[29];
iii) monolithic - bipolar system and a layered metal counter-electrode (Figure 1.2c).
a) b) c)
Figure 1.2 - No-biased single photo-system configurations for solar water splitting (SC - semiconductor;
M - metal) - (adapted from [14]): a) n-type semiconductor photoanode and a metal counter-electrode; b) p-type semiconductor photocathode and a metal counter-electrode; and c) monolithic configuration.
In what concerns multiple photo-system arrangements, it can be identified the following configurations: Electrolyte CB VB H2O/H2 H2O/O2 M SC-n e -e -h+ e -Electrolyte CB VB M SC-p h+ e -e -H2O/H2 H2O/O2 h+ H2 H2O M H2O O2 SC-n SC-p e -Electrolyte
i) n- and p-type semiconductors (acting as photoanodes and photocathodes, respectively)[30], wired (Figure 1.3a) linked by an ohmic contact (Figure 1.3b); ii) hybrid systems with layered structures involving several different
semiconductor films stacked on top of each other (Figure 1.3c).
a) b) c)
Figure 1.3 - Different no-biased multiple photo-system configurations for solar water splitting (SC -
semiconductor; M - metal) - (adapted from [14]): a) n- and type semiconductors wired; b) n- and p-type semiconductors linked by an ohmic contact; and c) hybrid systems.
All the presented routes to convert solar energy into hydrogen show advantages and disadvantages. Nevertheless, there is a consensus that the single photo-system is the “holy grail” of PEC technology in terms of simplicity, packaging and overall system costs.[13]
1.1.2 WORKING PRINCIPLES OF PHOTOELECTROCHEMICAL CELLS FOR WATER
SPLITTING
The principle of converting sunlight into hydrogen by water photoelectrolysis using a single photon-system, taking as an example a n-type semiconductor in an alkaline media, is illustrated in Figure 1.4.
Electrolyte CB VB H2O/H2 H2O/O2 M SC 1 e -e -h+ e -SC 2 h+ e -VB Electrolyte CB VB H2O/H2 H2O/O2 SC-n e -e -h+ e -h+ CB VB SC-p e -H2O H2 H2O O2 Glass Substrate e -SC-n SC-p Electrolyte
Figure 1.4 - Energetic diagram of a PEC cell under dark (a) and illumination (b) conditions.
The single-photon PEC system for water-splitting is composed by a semiconductor photoelectrode that absorbs photons with sufficient energy to inject electrons from the valence to the conduction band, creating electron-hole pairs – Equation (1.1).
− +
→ +
2hv 2e 2h Photon-induced electron-hole pair generation (1.1) As sketched in Figure 1.4, the excited electrons percolate through the semiconductor layer reaching the counter-electrode, via the external circuit, to promote water reduction at its surface – Equation (1.2). While the holes oxidize water in the semiconductor surface – Equation (1.3).[13, 31] The cycle is closed when the electrolyte anions generated at the counter-electrode diffuse back to the surface of the semiconductor to recombine with holes.
Cathode: 2H O 2e2 + -→ +H2 2OH- EH O/H2 2 0.828 V
° = − (1.2) Anode: 2OH-+2h+→H O2 +1 O2 2 E -2 O /OH 0.401 V ° = (1.3)
If an acid media is considered, instead of having hydroxyl anions traveling from the counter electrode to the surface of the semiconductor we have hydrogen ions, as described by the following equations:
Electrolyte CB VB H2O/H2 OH-/O 2 M SC-n 1.23 eV EF E W ∆VPh Electrolyte CB VB H2O/H2 OH-/O 2 M SC-n 1.23 eV EF,n E W h+ e- e -ηa ηc 0 a L b
Cathode: ++ -→ 2 2H 2e H + =0.0 V 2 ° H /H E (1.4) Anode: H O 2h2 + +→2H++1 O2 2 2 2 =1.23 V ° H O/O E (1.5)
In both cases, i.e. for an alkaline medium or for an acid medium, the overall PEC water splitting reaction takes the following form:
+ → +
2 2 1 2
H O 2 H O
2
hv (1.6)
A similar phenomenon occurs when a p-type semiconductor is used. Nevertheless, for this case the dominant (or the majority) charge carrier is holes, which will travel through the external circuit towards the metal counter-electrode, working now as the anode, on the other hand, electrons travel to the surface of the semiconductor in contact with the electrolyte to reduce water.[32]
The minimum potential of -1.23 V at 25 °C is needed to electrolyze water. The negative sign identify the process as not being spontaneous and so the reaction cannot occur without additional energy from an external electrical power source. This value is obtained from the following relation:
o o ΔG
ΔE
=-zF (1.7)
o
Δ G is the standard Gibbs free energy change (+237 kJ·mol-1), representing a thermodynamic minimum for splitting water into the gaseous hydrogen and oxygen at 25 ˚C and 1 bar; ∆Eois the electric standard potential of the reaction.
For a direct photoelectrochemical water-split using a single-photon system, several key criteria must be simultaneously fulfilled:
i) The semiconductor system must generate sufficient voltage upon irradiation to split water;
iii) The band-edge potentials at the surface must straddle the hydrogen and oxygen redox potentials according to the half-reactions described in Equations (1.1 – 1.7);
iv) Low overpotentials;
v) The system must exhibit long-term stability in aqueous electrolytes;
vi) The charge transfer from the surface of the semiconductor to the solution must be selective for water splitting and exhibit low kinetic overpotentials; [33]
vii) The material must be sufficiently abundant, harmless and cost-effective
Since overpotentials are required at various points in the system to ensure sufficiently fast reaction kinetics, i.e. related to the electrochemical reaction kinetics at anode and cathode and charge transfer (inside the electrodes and in the electrolyte), the minimum bandgap required to split water is at least 1.9 eV. This value also imposes that the semiconductor is able to absorb light for wavelengths lower than 650 nm, as shown in Figure 1.5.[13]
Despite the research efforts to date no single semiconducting material has been found that fulfill all the requirements needed to generate stand alone devices for solar hydrogen production from water splitting.[13, 34]
Figure 1.5 - Schematic illustration of a semiconductor with a hypothetically ideal bandgap of 1.9 eV. Right: Intensity of sunlight vs. wavelength for AM 1.5G conditions. The grey area represents the part of
the spectrum that can be absorbed by a semiconductor with a bandgap of 1.9 eV.
Bandgap 1.9 eV
-+
e -h+ Valence Band Conduction Band H2O/H2 OH-/O 21.1.3. MATERIALS OVERVIEW
The keystone in water photoelectrolysis is the development of an efficient, robust, reliable, cost-effective, and stable photoelectrode system.[35] The first material recognized to split water under UV light was TiO2, reported by Fujishima and Honda in
1971.[36] Thenceforward, extensive efforts have been made to find a suitable material for efficient photoelectrodes. Thus, during the last three decades, different types of semiconductors were studied such as metal oxide (e.g. Fe2O3, SrTiO3, TiO2, WO3,
BiVO4, Cu2O, etc.) and non metal oxide semiconductors (e.g. GaAs, CdS, InP, etc.). [35]
The photocorrosion stability of photoanode or photocathode, its wavelength response (bandgap) and current-voltage characteristic are important factors that determine the semiconductor performance in water splitting – Figure 1.6.
Figure 1.6 - Energy band positions for various semiconductors at pH 14. [13]
METAL OXIDE SEMICONDUCTOR
Concerning the metal-oxide semiconductors, only few are able to fulfill the bandgap and band edge requirements for operating at zero bias voltage; SrTiO3, KTaO3 and
ZrO2 are among them but only SrTiO3 has been in fact studied. [37]
SrTiO3 generates
hydrogen without any additional bias even if with a barely small efficiency, less than 1 %, which was ascribed to its large bandgap energy (3.4 - 3.5 eV).[38]
OH-/O 2 H+/H 2 SnO2 +3 0 -1 -2 +1 +2 -7 -4 -3 -5 -6 Eabs [eV] ENHE [V] WO3 KTaO 3 TiO2 Cu2O CdS GaAs EC EV EC EV EC EV EC EV EC EV EC EV EC EV EC EV Fe2O3 EC EV SrTiO3 EV InVO4 EV EC EC SiC EC EV GaInP2
Preparing a semiconductor oxide that meets all criteria needed to achieve efficient water splitting is a great challenge and the most frequently studied photoelectrode materials are TiO2, WO3, Fe2O3, BiVO4 SnO2 and Cu2O and their modifications.
The well known titanium dioxide (TiO2), with different crystalline structures
(anatase mostly but also rutile) and arrangements as single crystal, polycrystalline or thin films, have been largely investigated [39-43] mainly due to its excellent stability over a wide range of pH and applied potentials, low cost and abundance.[39] As a major drawback, TiO2 only absorbs in the UV light spectrum due to its large bandgap
of approximately 3.2 eV. Several attempts have been made to extend TiO2 spectral
response into the visible light doping it with aliovalent ions, such as W, Ta, Nb, Zn, In, Li and Ge[44], Pb[45], Mo and Cr[46], Cr[47], C[48] and N[49, 50]. Wilke and co-workers showed the important effect of doping TiO2 with Mo and Cr ions on the decrease of TiO2
bandgap.[46] An impressive reduction on the bandgap of TiO2 photoanodes was
achieved also by Khan et al. (2002) with carbon incorporation into the TiO2-x lattice
during heating in a natural gas flame.[48] Nevertheless, the studies concerning the doping effect of TiO2 semiconducting material do not provide clear conclusions, since
the dopant that may have a positive effect on the bandgap (Eg) reduction, and thereby increasing the light absorption, has a negative effect in the energy conversion efficiency (ECE). Moreover, the reduction of Eg should be followed by changing other relevant functional properties. Finally, the procedures used to incorporate the dopants are often arbitrarily selected. Thus, without a solid knowledge of the time and the temperature required to incorporate the dopants, it is truly difficult to replicate the TiO2 material and to obtain a homogeneous distribution in the
semiconductor.[47]
The same holds for tin dioxide (SnO2) semiconductor; it has also a large bandgap in
the range of 3.1–3.3 eV that makes this material able to absorb only the UV solar spectrum.[35] Nevertheless, an n-type single crystal of SnO2 doped with Sb was
investigated by Wrighton and co-workers for H2 and O2 production with an applied
bias of 0.5 V under UV light illumination.[51] Though, comparing TiO2 with SnO2, the
Tungsten trioxide (WO3) is an interesting semiconductor since it has an attractive
bandgap of 2.5-2.7 eV.[43, 52, 53] Theoretically, a bandgap of 2.7 eV allows to use 12 % of the AM 1.0 solar spectrum, a very high value compared to the barely 4 % achieved with TiO2.
[35, 53]
Although this material had been widely studied by Deb in 1972, it was Hodes in 1976 that first recognized it as an active visible-light driven photoanode for water splitting.[54] This material shows good stability in water for pH < 4 and a favorable energy band edge for oxygen evolution.[53] Nevertheless, the minority carrier (hole) diffusion length plays a limiting role in the photoresponse of tungsten trioxide photoanodes due to the indirect bandgap transition.[55] Usually, WO3
photoanode is used as thin films and can be found either in the crystalline or in the amorphous forms. To obtain efficient WO3 photoanodes, a highly crystallinity
structure is desirable since it minimizes the imperfections and the surface contaminations which may lead to a charge trapping and carrier recombination.[56] Recently, it has been described a nanostructured WO3 photoanode capable to
produce a photocurrent of about 3 mA cm-2 in 3 M CH3HSO3 (AM 1.5 G). [55]
Alternatively, small bandgap materials can be considered as starting point in the research of single-photon systems, such as Fe2O3 or BiVO4.
[13, 28, 57-60]
Particular attention has been given to hematite (α-Fe2O3) and it has actually been considered a
material with great potential for PEC applications. Hematite is one of the most abundant and inexpensive oxide semiconductors with an interesting bandgap of 1.9-2.3 eV, is a non-toxic material and is stable in water.[61] As a drawback, pure-phase ɑ-Fe2O3 has intrinsically poor charge carrier transportation, which limits its quantum
efficiency. Moreover, it has a poor oxygen evolution reaction (OER) kinetics and the band edges are not well positioned to directly carry out the reduction of water. Intensive research efforts have been conducted to improve hematite’s intrinsic electronic properties by varying the deposition method or by doping the photoelectrode with Si, Ti, Pt, Mo and Cr, among other atoms.[28, 61-64] In an ideal hematite photoanode, the onset is just anodic of the flat band potential with a photocurrent plateau of 12.6 mA·cm-2.[65] However, until the moment, no research group has been successful in splitting water by means of an α-Fe2O3 photoanode
without assistance of an external bias voltage.[13] Recently, a record-breaking performance of 4.32 mA·cm-2 was published for hematite photoanode applied in a PEC system for water splitting.[66]
Another interesting material is BiVO4 semiconductor with a bandgap of 2.4 – 2.5 eV
and a reasonable band edge alignment with respect to water redox potentials; in fact it has the ability to carry out the water photosplitting reaction.[67] Moreover, it has been reported that BiVO4 is able to show both semiconducting properties, n- and
p-types,[68] as well as a high photon-to-current conversion efficiencies (> 40 %) at 420 nm.[37, 44] More recently, a tungsten-gradient-doped bismuth vanadate (W:BiVO4)
photoanode was synthesized and optimized, capable of producing in a tandem configuration ca. 4 mA·cm-2.[69]
Over the past few years several efforts have been made in order to find an efficient harvesting semiconductor under visible light. Cuprous oxide (Cu2O), which works as a
photocathode, has an interesting bandgap of 2.0-2.1 eV.[70] Theoretical calculations indicate that Cu2O can produce up to 14.7 mA·cm
-2
, corresponding to a light-to-hydrogen conversion efficiency of 18 % based on the AM 1.5G spectrum.[71] For solar water splitting purposes, Cu2O has a favorable energy band positions; the conduction
band is located 0.7 V negative of the hydrogen evolution potential and the valence band lying just positive of the oxygen evolution potential.[71] Since no overpotential is available for oxygen evolution, the reduction band edge is close to the water reduction potential, the p-type Cu2O can drive half of the water splitting reaction but
an external bias must be applied to conduct the other half reaction (water oxidation).[71] However, the limiting factor of this material is the poor stability in aqueous solutions, since the redox potentials for the reduction and oxidation of monovalent copper oxide lie within the bandgap.[70, 71] The corrosion sensitivity issue of cuprous oxide under illumination can be addressed depositing very thin protective layers by e.g. atomic layer deposition (ALD).[72] In fact, using this methodology Grätzel and co-workers have designed, up to now, the best performing oxide photoelectrode, producing 7.6 mA·cm-2 at 0 VRHE. It is a Cu2O electrode protected with nanolayers of
electrodeposited platinum nanoparticles, i.e. Cu2O was coated with layers of n-type
oxides with structure 5 × (4 nm ZnO/0:17 nm Al2O3)/11 nm TiO2. [71]
NON-OXIDE SEMICONDUCTOR
Non-oxide semiconductors (p-type and/or n-type photoelectrodes) are known to efficiently harvest sunlight, converting it into electricity: amorphous, polycrystalline and crystalline silicon (a-Si, p-Si and c-Si), gallium arsenide (GaAs), cadmium telluride (CdTe), gallium phosphide (GaP), indium phosphide (InP), copper indium diselenide (CIS), cupper indium gallium diselenide (CIGS) and gallium indium phosphide (GaInP2). [73]
As mentioned, most of the oxide semiconductors studied for water splitting show bandgap and stability issues, thus, particularly attention has been given to non-oxide materials since they have smaller bandgaps enabling the capture of a larger portion of the solar spectrum energy.
Cadmium sulfide (CdS) has well positioned band edges to efficiently reduce and oxidize water with an optical absorption of 520 nm (corresponding to a bandgap of 2.4 eV). However, it suffers from anodic photodecomposition by the photogenerated holes. [73] Similar problems of photocorrosion can be found with other n-type non-oxides semiconductors as the ones presented in Table 1.1.
Table 1.1 - Non-oxide n-type semiconducting materials with small bandgap. [73]
Semiconductor Bandgap CdSe 1.7 eV CdTe 1.4 eV GaP 2.24 eV GaAs 1.35 eV InP 1.35 eV MoS2 1.75 eV MoSe2 1.5 eV
Considering now p-type non-oxide materials, they usually show stable behavior against cathodic photodecomposition since the photoelectrons in excess migrate towards the semiconductor/electrolyte interface such as the p-Si and p-GaP.[73]
However, the flat band position of these materials is unfavorable for the H2O/O2
redox and a large bias voltage must be applied. [32]
One approach to overcome stability issues is covering the unstable photoelectrodes with thin films of stable wide bandgap semiconductors with suitable band edges or with thin metal films (e.g. by chemical vapor deposition (CVD), sputtering or atomic layer deposition).[32] Although, single-photon systems seem to be the preferable route to produce hydrogen from solar energy, either with oxide or non-oxide materials, significant improvements should be accomplished on electronic structure and stability in order to be used alone in PEC systems – Figure 1.2a) and b).
Clearly, there are three routes that may result in a high efficient system for water splitting and without need of an additional bias. These are illustrated in Figure 1.2c)
and in Figure 1.3a) and c). All strategies share the feature of having two
semiconductors with different bandgaps. This provides a mechanism by which a single electron is photoexcited twice and, correspondingly, generates a larger bias from light. It has been calculated that this type of system could realistically achieve a solar-to-hydrogen conversion efficiency of 21.6 %.[74]
The most compelling approach is however illustrated in Figure 1.2c) and Figure
1.3a). Here, various combinations of n-type and p-type semiconductors, oxide and
non-oxide, such as n-TiO2/p-GaP, n-SrTiO3/p-GaP, n-Fe2O3/p -Fe2O3 have been used to
eliminate the bias needed for water splitting - Table 1.2. Because of the low performance of the individual electrodes in these dual-photoelectrode devices, the resulting overall efficiency is as well low.
Table 1.2 - Examples of n-p photoelectrochemical cells for water splitting (Figure 1.3a).
n-SC/p-SC Electrolyte Energy conversion
Efficiency, η Reference
n-TiO2/p-GaP 0.2 M H2SO4 0.25 % [30]
n-SrTiO3/p-GaP 1 M NaOH 0.67 % [75]
1.1.4. STABILITY ISSUES –PHOTOCORROSION
In photoelectrochemical cells, stability issues are one of the major problems to be solved. [13] Usually, when a semiconductor electrode is placed in contact with an electrolyte solution some reactions may occur, for instance ionic oxidation or reduction of the semiconductor with simultaneous reduction or oxidation of a component. [77] The electrolytic reduction of a semiconductor is often associated with the electrons in the valence band, while the electrolytic oxidation reaction is related to holes in the conduction band as electronic reactants. [77] Following the Gerischer´s derivations, it is possible to formulate the simplest type of decomposition reaction involving a binary semiconductor MX and the solvation (complexing) of the elements (labeled hereafter as “solv”) as stated next:[37]
−
−
+ + → + solv
MX ze solv M Xz (1.8)
for a cathodic reaction, and
+
+
+ + → solv+
MX zh solv Mz X (1.9)
for an anodic reaction. Using H+/H2 standard potentials as reference, the
corresponding reaction for hydrogen may be written as:
+ − + → + 2 solv 1 H solv H e 2z z z (1.10)
The addition of Equation (1.10) to Equation (1.8) or to Equation (1.9) yields the corresponding equations for the free energy values, nΔGsH and pΔGsH, respectively. The
decomposition potentials equations are:
z
E G
p d= ∆p sH/ (1.11)
for the oxidation, and
z
E G
for the reduction of the semiconductor.[37]
The energy positions of the electron-induced potential nEd and the hole-induced
corrosion value pEd can be plotted with respect to the band edges Ec and Ev, as shown
in Figure 1.7. In fact, the criterion for thermodynamic stability of the semiconductor is:
pEd > Eredox > nEd (1.13)
Figure 1.7 - Relative positions of decomposition Fermi Levels of a semiconductor with respect to its band
edges: a) cathodically and anodically stable, b) cathodically and anodically unstable, c) cathodically stable but anodically unstable and d) anodically stable but cathodically unstable. Adapted from ref [77].
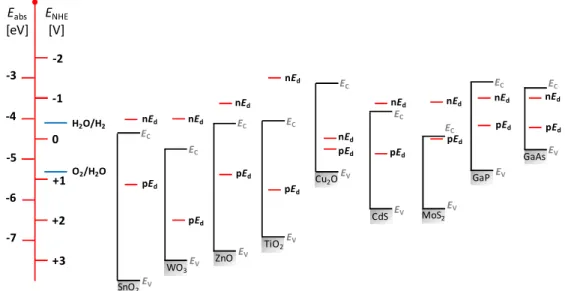
Figure 1.8 shows some decomposition potentials for various semiconductors used to carry out the water splitting reaction under solar radiation. However, these diagrams show some practical limitations since, besides the thermodynamic stability, the reaction kinetics may also play an important role in the stability definition of a given semiconductor material. Actually, none of the semiconductors presented in Figure 1.8 have their Fermi levels edges positioned as shown in Figure 1.7a), meaning
that they are cathodically and/or anodically unstable. However, some of these semiconductors show cathodic and/or anodic stability because the reaction kinetics can help preventing crystal decompositions where the charge transfer of photogenerated carriers in the interface is faster compared to the crystal decomposition. [77] E EC EV nEd pEd a) E EC EV nEd pEd b) E EC EV nEd pEd c) E EC EV nEd pEd d)
Figure 1.8 - Positions of band edges and decomposition Fermi levels for different oxide and non-oxide
semiconductors at pH 7. Adapted from [37].
The stability of a semiconductor in contact with an electrolyte solution strongly depends on the competition between anodic dissolution and redox reaction, which are controlled by thermodynamic and kinetic parameters, respectively. [37] Thus, even if the semiconductor oxides are not thermodynamically stable, following the Gerischer´s approach, their stabilities can only be achieved in the presence of a suitable redox system for kinetic reasons.[78] For instance, even if the metal oxides are thermodynamically stable, based on the nEd and pEd positions, towards cathodic
photocorrosion, most of them are unstable towards anodic photocorrosion. Nevertheless, there are some n-type semiconductors, such as ɑ-Fe2O3 and TiO2, which
are sufficiently stable in aqueous electrolytes because their decomposition is controlled by very slow corrosion reaction kinetics.[79] As suggested by Krol, if the material has a tendency for photodecomposition, this may be prevented by adding a suitable co-catalyst to favor the water oxidation route. [79]
SnO2 +3 0 -1 -2 +1 +2 -7 -4 -3 -5 -6 O2/H2O H2O/H2 nEd pEd nEd pEd WO3 nEd pEd ZnO nEd pEd TiO2 nEd pEd Cu2O nEd pEd CdS nEd pEd MoS2 nEd pEd GaP nEd pEd GaAs EC EV EC EV EC EV EC EV EC EV EC EV EC EV EC EV EC EV Eabs [eV] ENHE [V]

![Figure 1.3 - Different no-biased multiple photo-system configurations for solar water splitting (SC - semiconductor; M - metal) - (adapted from [14]): a) n- and type semiconductors wired; b) n- and p-type semiconductors linke](https://thumb-eu.123doks.com/thumbv2/123dok_br/15143867.1012146/34.748.92.647.262.501/figure-different-multiple-configurations-splitting-semiconductor-semiconductors-semiconductors.webp)