1
In situ AFM imaging of adsorption kinetics of DPPG Liposomes: A Quantitative Analysis of Surface Roughness
Andreia A. Duarte1, Joaquim T. Marquês2, Francisco Brasil1, Ana S. Viana2, Pedro
Tavares3 and Maria Raposo1
1 CEFITEC, Departamento de Física, Faculdade de Ciências e Tecnologia, FCT,
Universidade Nova de Lisboa, 2829-516 Caparica, Portugal.
2 Centro de Química e Bioquímica, Faculdade de Ciências da Universidade de Lisboa,
Ed. C8, Campo Grande 1749-016, Lisboa, Portugal
3REQUIMTE, Departamento de Química, Faculdade de Ciências e Tecnologia, UNL,
Campus de Caparica, 2829-516 Caparica, Portugal
Abstract
The adsorption of intact liposome on surfaces is of great importance for the development of sensors and drug delivery systems and, also, strongly dependent of surface roughness where liposomes are adsorbed. In this article, we analyzed, by using atomic force microscopy (AFM) in liquid, the evolution of morphology of gold surfaces and of poly(allylamine hydrochloride) (PAH) surfaces with different roughness, during the adsorption of liposomes prepared with the synthetic phospholipid 1.2-dipalmitoyl-sn-Glycero-3-[Phospho-rac-(1-glycerol)] (DPPG). Our results reveal that: i) on smooth surfaces of Au only or Au/PAH, the liposomes open and deployed on the substrate creating a supported-lipid bilayer being the opening process faster on the latter surface; and 2) on rough substrates of Au coated with polyelectrolyte multilayers (PEM), the liposomes adsorbed intact on the surface, as corroborated by power spectral density analysis that demonstrates the presence superstructures with average lateral size of 43 nm and 87 nm, in accordance with 2 and 4 times the mean liposome hydrodynamic diameter of about 21 nm. In addition, this work presents an adequate and effective methodology for analysis of adsorption phenomena of liposomes on rough surfaces.
Keywords: Liposome; Atomic force microscopy; Dynamic scaling analysis; Adsorption. Introduction
The adsorption of intact liposomes onto solid surfaces is a subject of potential interest on the development of sensors and drug delivery systems prepared from encapsulated biological drug molecules and for studies regarding the interaction of radiation with biological molecules on an environment close to that of living cells. Although this issue
2
has been analyzed since the end of the last century [1 and references therein], the adsorption of liposomes on surfaces continues to be challenging.
One of the most suitable characterization technique to study adsorption phenomena in situ at the solid/liquid interface is atomic force microscopy (AFM) since this technique makes it possibly to study of the adsorption kinetics of molecules or aggregates of molecules on a surface. However, one must be careful when using traditional AFM, as the scan rate requested for capturing instants spaced apart in time of few minutes only must be very high, of the order of several hertz. Moreover, both the fast AFM data acquisition in liquid is challenging and the analysis of topographic data requires advanced mathematical tools and related expertise to describe and interpret the observed structures. Fortunately, in opposition to these difficulties, fractal analysis has the capacity to extract much information from the measured morphology and is a useful approach to describe the characteristic surfaces of thin films [2]. Here, it should be referred that not only grown structures such as deposited nanoparticles or constituents of films are fractal, but also engineered surfaces produced by subtractive methods may be, such as e.g., those resulting from air abrasion [3]. Because particle deposition is a far-from-equilibrium process, the growth of an interface can be characterized quantitatively using different growth models which can explain the observed morphology. The complexity of thin film morphology and the growth process at an interface is mainly governed by the interaction of deposition, desorption and surface diffusion of the atoms or molecules when arriving on the surface [4]. It is now believed that most particle aggregates in nature and engineered systems are fractal in their morphological structure [5]. Thus, fractal theories have been used to provide a new quantitative method to describe particle aggregates structures in many water systems, e.g. fractal characterization of particles produced from wastewater treatment [6], bacterial and yeast aggregates from laboratory batch experiments and phytoplankton aggregates in a simulated oceanic system [7]. Therefore, the research in this field have proved that fractal geometry and scaling concepts can describe the morphology of a rough surface because its symmetry does not change at different scales. Recently, the application of fractal concepts to AFM topographic data of liposomes adsorbed ex situ onto solid surfaces allowed to determine scaling exponents and mean grain size values and conclude about growth regimes [8,9].
In this work was used tapping mode AFM in liquid to characterize the adsorption kinetics of 1.2-dipalmitoyl-sn-Glycero-3-[Phospho-rac-(1-glycerol)] (Sodium Salt) (DPPG) liposomes onto gold coated quartz crystal and poly(allylamine hydrochloride) (PAH) surfaces prepared by the layer-by-layer (LbL) technique [10]. The topographic data was interpreted considering the roughness amplitude parameters and Power Spectral Density (PSD) analysis of the features, treated as self-affine structures. By applying a combination of three PSD models namely, the conventional, the fractal and the ABC or K-correlation, parameters as mean grain size and correlation lengths were estimated and fractal geometry growth regimes were analyzed.
3
Experimental Section Liposome Preparation
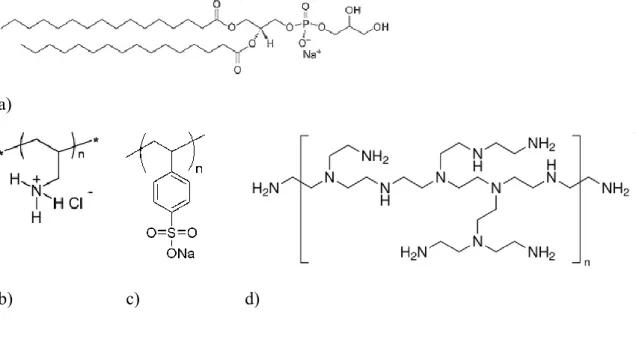
Liposomes were prepared from synthetic DPPG phospholipids (744.96 gmol-1) (see
chemical structure in Figure 1a), by dissolving the phospholipid powder, supplied by Avanti Polar Lipids (Alabaster, AL), in methanol:chloroform 2:8 vol:vol mixture. After solvent evaporation using a gentle stream of nitrogen, the lipid film was hydrated for 2 h in ultrapure water with a resistivity of 18.2 MΩ·cm and pH~5.7, obtained from Milli-Q water system (Millipore GmbH, Billerica, MA). The liposome suspension was then sonicated in an ice bath by an ultrasonic processor UP50H (Dr. Hielscher GmbH, Germany) for 30 s at 30 kHz of working frequency and a power of 50 W. This procedure was repeated 15 times with one-minute delay between cycles. In order to avoid the presence of titanium debris from the ultrasonicator probe, the DPPG suspensions with monomeric concentrations of 1.47 mM and 5mM were carefully withdrawn with a syringe and stored at 6C. The fact that DPPG liposomes are negatively charged at pH~5.7 allows its use in the assembly of LbL films.
a)
b) c) d)
Figure 1. Chemical structures of (a) DPPG, (b) PAH, (c) PSS and (d) PEI.
Cushion preparation
Polyelectrolyte multilayer cushions were prepared using the LbL technique from aqueous solutions, with a monomeric concentration of 10 mM, of PAH (50,000–65,000 gmol−1), poly(sodium 4-styrenesulfonate) (PSS) (70,000 gmol−1) and
poly(ethyleneimine) (PEI) (60,000 gmol−1) supplied by Sigma-Aldrich (St. Louis, MO
4
PEI are positively charged while PSS is negatively charged. All chemicals were used as received and solutions were prepared using ultrapure water. These polyelectrolytes, chosen due to their well-known assembly characteristics, namely growth features and adsorption kinetics [8,11], were adsorbed sequentially via LbL technique onto gold coated quartz crystals sensor available directly from Stanford Research Systems, U.K.. These crystals consists of thin disks (or wafers) of α-quartz with circular electrodes patterned on both sides coated with a layer of gold upon a chromium layer. In conditions of resonance, these crystals present a resonance frequency near 5 MHz. The gold quartz crystal wafers were pre-treated in a 3:1 mixture of sulfuric acid and hydrogen peroxide, "piranha solution", during 5 min at room temperature, and then sequentially washed in ultrapure water, ethanol, ultrapure water again and dried under a soft nitrogen flow. Afterwards, the substrates received an UV/Ozone treatment during one hour, followed by washing with ultrapure water and dried with nitrogen stream.
Preparation of Au/PAH and Au/PEI/(PSS/PAH)4 (here also designated by
polyelectrolyte multilayers (PEM)) surfaces was performed ex situ. In the first case, the Au-quartz crystal resonator was dipped in a PAH solution for 3 min, followed by a washing process with ultra-pure water. The Au/PEI/(PSS/PAH)4 films were prepared
using the same immersion time for each polyelectrolyte solution which were sequentially adsorbed until reach the desired number of layers. In this case, NaCl salt concentration of PAH and PSS solutions was 1 M. Finally, the polymers-supported surfaces were dried at room temperature.
Surface Characterization
Surface morphologies of Au-quartz crystal, polymers-supported surfaces and DPPG liposomes, were investigated by in situ AFM measurements, i.e., with the sample immersed in ultra-pure water using a liquid cell. Au and polymers-supported surfaces were initially covered with 40 μL of ultra-pure water followed by the injection of 60 μL of DPPG vesicular suspension. In situ AFM analysis scanned area were performed at room temperature using a Multimode Nanoscope IIIa Microscope (Digital Instruments, Veeco). Topographic images of 2 × 2 μm2 with 512 × 512 pixels were taken with a scan
rate of ca. 2 Hz in tapping mode; the use of an oscillating tip significantly reduces the force applied to the surface during the scanning as compared to the measurements carried out in contact mode [12], since the cantilever only touches the surface once per oscillation cycle closest to the lowest vertical position i.e. for a small portion of the total time. Images were recorded on height and phase modes. Before each experiment, the glass block holding the cantilever was rinsed several times with water and ethanol. The
5
probes used were made of silicon nitride (NPS, Veeco), with cantilever spring constant of approx. 0.58 N/m and resonance frequency in liquid of approx. 9 kHz.
Quantification of Adsorbed DPPG
The adsorbed amount of a DPPG layer assembled onto PAH was monitored in situ via quartz crystal microbalance (QCM), QCM 200, from Standford Research Systems, U.K. using the Stationary Vertical Closed (SVC) experimental configuration, detailed in ref. [13]. Prior to QCM measurements, the Au-quartz crystal/PAH and Au-quartz crystal/PEI(PSS/PAH)4 were plugged in the crystal holder and the liquid cell attached to
it, which has a capacity volume of 6 mL. In order to perform an operation in liquids, after the ultra-pure water injection in the QCM cell with the crystal/PAH plugged, the capacitance cancellation was carried out. Then 2.5 mL of DPPG suspension was injected into the cell to attain 1.47 mM as final concentration. The frequency shift was recorded during 70 min. The frequency shift measured by the QCM was converted into adsorbed amount per unit area using the Sauerbrey equation [14]:
ΔF= -C f× Δm [Hz] (1)
where ΔF is the change in resonant frequency, Δm the mass change on the electrode surface and Cf is the mass-sensitivity constant (56.6 Hz μg-1 cm2). All QCM
measurements were carried out at 20°C with a fundamental frequency of 5 MHz.
Results and Discussion
Analysis of amplitude parameters of AFM Topographic Images
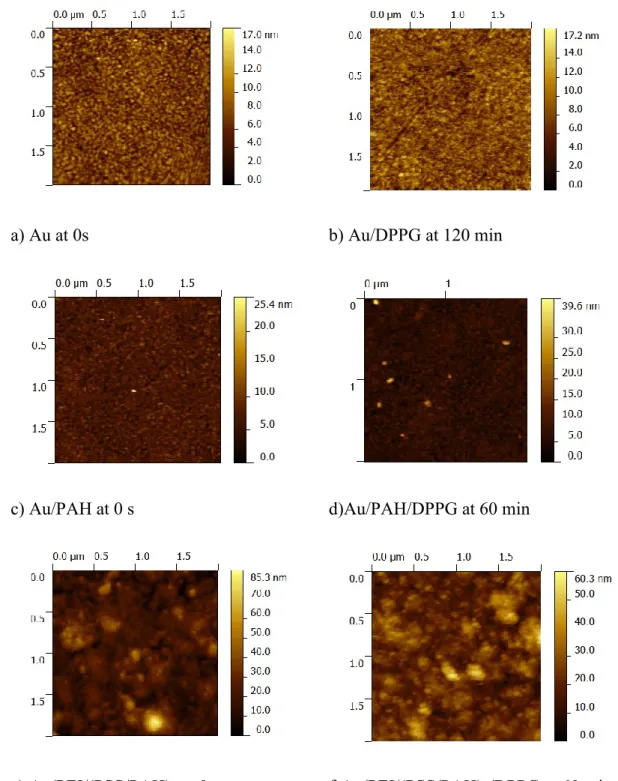
Topographic images of DPPG liposomes deposited onto Au, Au/PAH and Au/PEI/(PSS/PAH)4 surfaces are shown in figure 2, before the injection of the DPPG
liposomes suspension in the AFM liquid cell and for longer adsorption periods. The time t=0 min corresponds to the instant before the injection of the DPPG liposomes suspension into the AFM liquid cell. Table I shows the one-dimensional height statistical parameters, namely, the root-mean-square roughness (Sq), estimated from the topographic images obtained for the different periods of time of adsorption.
6
a) Au at 0s b) Au/DPPG at 120 min
c) Au/PAH at 0 s d)Au/PAH/DPPG at 60 min
e) Au/PEI/(PSS/PAH)4 at 0 s f)Au/PEI/(PSS/PAH)4/DPPG at 60 min
Figure 2. AFM in situ images of heights with 2x2 µm2 , of DPPG suspension with 1
mM of concentration deposited on: a) Au surface at 0 s; b) Au/DPPG surface at 120 min; c) Au/PAH surface at 0 s; d) Au/PAH/DPPG surface at 60 min; e) Au/PEI/(PSS/PAH)4 surface at 0 s; and e) Au/PEI/(PSS/PAH)4/DPPG surfaces at 60
7
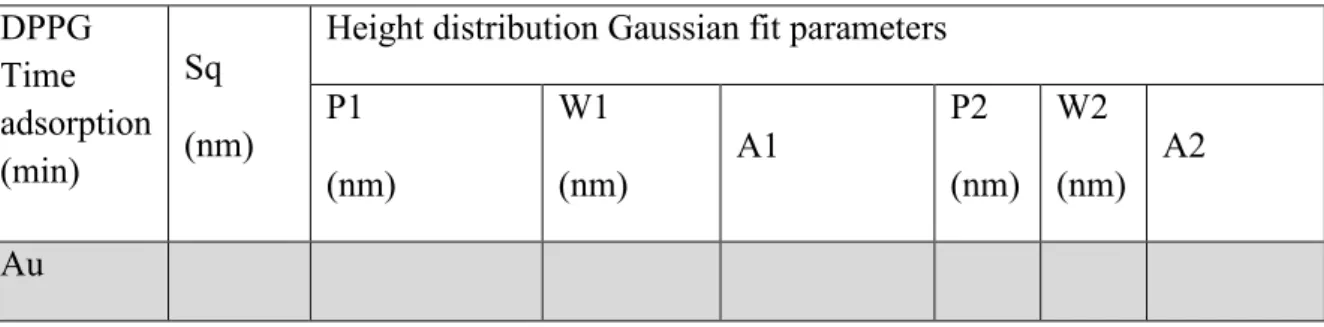
Table I: AFM 1D Statistical parameters calculated from topographic images with
22m2 areas of Au, Au/PAH and Au/PEI(PSS/PAH)
4 surfaces (t=0 s) and DPPG
deposition at t = 3, 5,10, 60 and 120 min. DPPG Time adsorption (min) Sq (nm)
Height distribution Gaussian fit parameters P1 (nm) W1 (nm) A1 P2 (nm) W2 (nm) A2 Au
8 0 1.5±0.3 7.064±0.006 3.42±0.01 0.981±0.004 3 2.7±0.6 16.79±0.01 5.13±0.02 0.959±0.005 5 2.3±0.3 13.410±0.007 4.45±0.02 0.970±0.003 10 2.3±0.3 10.596±0.008 4.53±0.02 0.977±0.004 120 1.9±0.2 7.984±0.008 3.61±0.02 0.973±0.005 Au/PAH 0 1.6±0.2 6.478±0.007 3.23±0.01 0.984±0.004 3 1.9±0.6 6.284±0.009 3.45±0.02 0.963±0.006 5 2.0±0.8 5.813±0.009 3.66±0.02 0.967±0.005 10 2.8±2* 6.433±0.008 4.06±0.02 0.958±0.004 60 2.1±0.8 6.357±0.007 3.89±0.02 0.988±0.004 Au/PEM* 0 8±3 17.7±0.2 10.4±0.6 0.6±0.1 26±3 17±2 0.3±0.1 60 7±2 20.6±0.2 10.9±0.2 0.88±0.06 33±3 16±4 0.15±0.06
9
Sq – root-mean-square roughness; P1 – peak 1 position; W1 – width peak 1; A1 – area peak 1; P2 – peak 2 position; W2 – width peak 2; A2 – area peak 2.
*PEM – polyelectrolyte multilayers of PEI(PSS/PAH)4
Analyzing Sq values listed in table I, one can see that after the first 3 min of DPPG adsorption the Sq rises from 1.5±0.3 to 2.7±0.6 nm, decreasing to 2.3±0.3 nm two minutes later. Five minutes after DPPG injection, this parameter was preserved decreasing again, at t=120 min, to a value close to the gold surface. This Sq behavior suggests that at 3 min the anionic DPPG vesicles are closed. But, as time passes, they interact with the hydrophilic and oxidized gold surface, since the substrate had a specific treatment with UV/ozone during one hour [15]. Afterwards, vesicles start to open and deploy through the substrate creating a supported-lipid bilayer (SLB) as described by Israelachvilli and collaborators [16]. Thus, surface evolution for SLB development presents two regimes: i) initially, there is a surface roughness variation as a function of time; ii) then a stabilization stage of the surface roughness which corresponds to a saturation time (sometimes also designated as crossover time from point of fractal theory) is attained.
The surface of the PAH layer adsorbed on gold (Au/PAH (t=0)) present a Sq value of 1.6±0.2.The Sq calculate from topographic images measured, at 3 and 5 min after DPPG dispersion deposition are marginally higher than the PAH surface, being an evidence of liposomes disruption and subsequent formation of a phospholipid bilayer. At 10 min it is possible to observe an increment of Sq which presents a large error; this is due to the presence of some liposomes aggregates immobilized onto the cushion layer as already mentioned above. After one hour, Sq values decreased revealing liposome desorption or liposome breaking and fusion into a flat layer. Nevertheless, we must consider the preservation of the Sq values at 3 and 5 min. This Sq value is in accordance with adsorption studies of DPPG liposomes onto PAH [9] which revealed that kinetics is ruled by three processes: i) the first with a small characteristic time ( = 2.19 ± 0.02 min) during which the liposomes adsorb onto the PAH surface and break releasing the water stored; ii) followed by a long characteristic time with approximately 23 min corresponding to the end of the diffusion-controlled process; iii) and after another characteristic time, ~60 min, associated to a minor fraction of phospholipid desorption from the surface.
Generally, comparing Sq of the Au/DPPG and Au/PAH/DPPG surfaces, it is possible to realize that after DPPG injection, the Sq value is smaller in the case of Au/PAH/DPPG, representing a fast DPPG adsorption followed by vesicles disruption due to the electrostatic forces between both molecules. It is well known that at pH< 6 PAH is highly ionized [17,18] and, therefore, in water, the electrostatic interactions between NH3+ and PO4- groups of PAH and DPPG, respectively are strong. On the other hand,
10
interactions between the polar head groups of DPPG and the nonpolar PAH chains (hydrophobic interactions) might be weak.
To better understand the processes that occur during liposomes adsorption, the DPPG adsorption kinetic curves onto the PAH surfaces and the Sq values, obtained from in situ imaging were plotted together, and are presented in Figure 3 a). After 70 min the DPPG adsorbed amount per unit area measured was 5±1 mg/m2 which corresponds to a
planar DPPG bilayer [19,20].
The height distribution curves, obtained by considering as zero the position of the lower depression the topographic images of Au/DPPG and Au/PAH/DPPG, at different DPPG adsorption times are shown in figures 3 b) and c), respectively. The parameters achieved by fitting the height distribution Gaussian curves are listed in table I.
For the adsorption of DPPG vesicles onto the gold surface, the peak positions of the height Gaussian distributions at 0, 3 and 120 min are centered at 7.064±0.006 nm, 16.79 ±0.01 nm and 7.984±0.008 nm, respectively, assigned to the height of the Au surface, closed DPPG vesicles attached to the Au surface and to a supported-lipid bilayer (SLB), correspondingly. Thus, the height profiles revealed a substantial increase in the first three minutes of DPPG deposition, but afterwards decreasing to values close to the gold surface. Therefore, these height parameters are in accordance with the Sq values confirming the adsorption of closed DPPG liposomes onto the Au solid support in the first minutes, followed by vesicles break and scattering of the lipid bilayer on the surface.
Concerning the DPPG adsorption onto PAH, the estimated height parameters obtained by fitting the Gaussian curves of figure 3 c) are listed in table I. Similar peak position values at different adsorption times, such as 0, 3, 5, 10 and 60 min, reveal that the DPPG phospholipid bilayer has already been formed at 3 min which is in accordance with the small characteristic time, = 2.19±0.02 min, estimated by fitting the QCM kinetic curve of figure 3 a). The height residual peaks (that could not be fitted) with a range between 15-40 nm and presented in figure 3 c) are related to some DPPG vesicles that have attached onto the Au/PAH/DPPG surface.
11
a)
b)
c)
Figure 3. a) DPPG adsorbed amount per unit of area measured by QCM (open circles) and Sq values (full squares) obtained from 22m2 topographic images of DPPG
liposomes adsorbed onto PAH at 3, 5, 10, 30 and 60 min. b) Height distribution curves obtained by treatment of AFM topographic data in situ of Au and Au/DPPG films at 3, 5, 10 and 120 min and c) Au/PAH and Au/PAH/DPPG at 3, 5, 10 and 60 min.
Comparing the height amplitude parameters obtained from Au/PEI/(PSS/PAH)4 and
Au/PEI/(PSS/PAH)4/DPPG topographic images, the Sq roughness slightly lower after
DPPG adsorption. Furthermore, it can be detected a reduction of the mean peak-to-valley roughness and a growth of the height peaks justified by the adhesion of closed vesicles onto PEM surface, as we can see by comparing PEM and PEM/DPPG profiles exhibited in figure 4 a). Height distributions for both surfaces are accessible in figure 4
12
b) and the parameters obtained after fitting the Gaussian curves are displayed in table I. Both surfaces present two maximum values of height centered at 17.7±0.2 and 26±3 nm for Au/PEI/(PSS/PAH)4 and 20.6±0.2 and 33±3 nm for Au/PEI/(PSS/PAH)4/DPPG.
Values in accordance with the measured value of 25±6 nm for the hydrodynamic diameter of DPPG liposomes. The largest area of the obtained fitted curves is the one centered at 20.6±0.2 nm proving that liposomes are adsorbed onto the PEM surface maintaining its own structure, i.e., being not flattened.
a)
13
b)
Figure 4. a) Au/PEI/(PSS/PAH)4 and Au/PEI/(PSS/PAH)4/DPPG height profiles with 2
m of scan length obtained from the topographic images showed in figures 2 a) e c). b) Height distribution curves and respective Gaussian fitted curves obtained by treatment of AFM topographic data in situ of Au/PEI/(PSS/PAH)4 and
Au/PEI/(PSS/PAH)4/DPPG.
Fractal Analysis of AFM Topographic Images
To characterize the surface topography of Au/DPPG, Au/PAH/DPPG and Au/PEI/(PSS/PAH)4/DPPG, one must rely on the amplitude parameters; however, they
only provide vertical information. PSD analysis was used to study the kinetics behavior of DPPG liposomes deposited on Au solid support and Au/PAH polymer surface as a function of time. Figures 5 a), b) and c) show the one-dimensional PSD spectra of the AFM images collected at different periods of times of adsorption of DPPG liposomes on Au-quartz crystal, Au/PAH and Au/PEI/(PSS/PAH)4 surfaces. This one-dimensional
spectral analysis provides a representative description of the overall surface roughness. All power spectra exhibit three distinct regions represented as parts I, II and III: (I) the plateau at low frequencies which is related to the height of the rough surface. This section has an absence of correlation (it does not change with the scale) and of characteristic length; (II) the region of the medium frequencies gives the correlation length, which defines the lateral extent of the rough surface, is strongly frequency
14
dependent and it represents the power-law decay; and (III) the region at high frequencies, PSD analysis de-convolutes the roughness as a function of surface lateral length scales, correlates the vertical amplitude with the spatial frequency of surface features and may also reveal the characteristics of the microstructure surface [21]. PSD spectra of figure 5 a) present a plateau at low spatial frequencies (region I) of 7 107 m-1, revealing a nearly constant value for roughness and an absence of any
characteristic length beyond ca. 15 nm. In this region, after 3 min of DPPG addition in the liquid AFM cell, the magnitude of PSD curves increases followed by a decrease after 5 min. When 120 min have elapsed, the magnitude at this region of spatial frequencies suffers a marginal reduction. The PSD spectra at region I complies with the roughness of the surface. The region II involves intermediate frequencies and characterizes the mechanism of the surface growth, where PSD is strongly frequency dependent. It also shows the surface self-affine behavior. Looking at this range of spatial frequencies, it is possible to observe that after 3 min of DPPG vesicles injection in the liquid cell, there is a decrease of the slope value of the PSD curve. However, in the following measurements (t= 5, 10 and 120 min) the slope of the PSDs spectra in this region increased progressively, until reach a value close to the initial. So, at intermediate frequencies the PSD spectra reveals two regimes, strongly frequency dependent, with a constant slope (sub-regions IIa and IIb), representative of a combination of two mechanisms that are involved in surface growth. In the subzone IIa, the surface evolution corresponds to an anomalous dynamic scaling, i.e., roughening and smoothing mechanisms cannot reach equilibrium and the local surface changes with time. The subregion IIb is attributed to the balance between random fluctuations and diffusion processes [22], so the local structure remains unchanged. The region III ( 3108 m-1) relates to the highest frequencies of the spectrum. This spatial
frequencies range is associated with physical dimensions of the AFM tip. Thus, the convolution of the tip and surface features happens and consequently, the PSD is highly affected by AFM tip artefacts and it was not considered to surface analysis [2,23].
PSD spectra in Figure 5 b) at low frequencies ( 3 107 m-1) have showed large
changes probably due to the presence of some aggregates of DPPG vesicles that have been attached on surface during liposome injection. Analyzing the first region of frequencies, we can detect a small increase of the PSD magnitude at 3 and 5 min, followed by an enhanced growth at 10 min revealing that some liposomes have aggregated. At a later stage (t=60 min) one can notice the typical behavior with the roll-off corner related to vesicles disruption promoted by electrostatic interactions between the anionic DPPG vesicles and the cationic PAH surface, leading to a decay of the power law. However, at the region II the PSD spectra of PAH and PAH/DPPG are quite similar leading us to conclude that the formation of the lipid bilayer has occurred after 3 min of DPPG liposomes injection. The region III ( 3108 m-1) was not considered to
15 a) b) I II III b a a III I II b
16
Figure 5. Evolution of the power spectra density of a) Au/DPPG, b) Au/PAH/DPPG and c) Au/PEI/(PSS/PAH)4 LbL films.
The conventional mode to calculate the correlation length ( ) involves determining the transition spatial frequency ( of the intersection point between two fitted curves of two distinct regions of the PSD spectra. However, both PSD spectra (figures 5 a) and b)) showed that this medium-frequencies region is governed by two growth regimes which must be treated individually. The transition frequencies, marked with arrows in figures 5 a) and b), correspond to correlation lengths that define transitions between physical processes responsible for surface development. The first correlation length ( is defined by the inverse of the transition frequency ( between the high-frequency and the self-affine intermediate high-frequency regions (transition between subregions IIa and IIb) and the second correlation length ( by the inverse of among the low-frequency random roughness plateau and the intermediate-frequency self-affine region (transition between the section I and the subregion IIb). The first ( and second ( correlation lengths of the PSD spectra for DPPG adsorption onto Au and PAH at different adsorption times were calculated and are listed in table II.
I II III
17
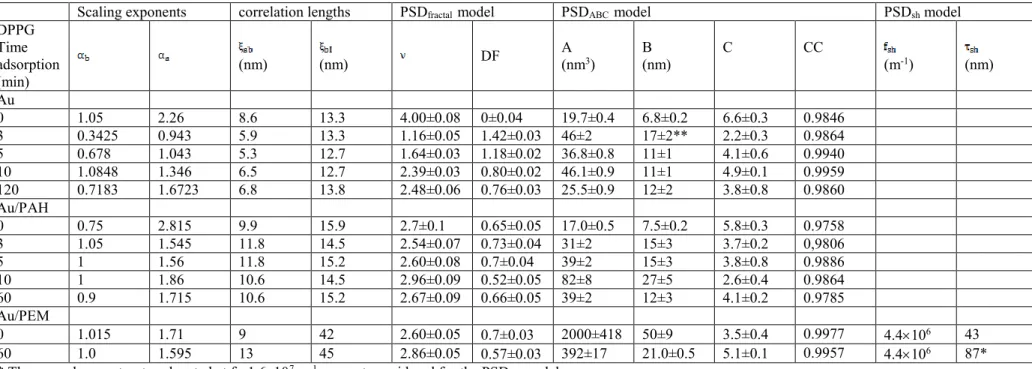
Table II: AFM Fractal analysis parameters calculated from topographic data of Au, Au/PAH and Au/PEI(PSS/PAH)4 surfaces (t=0) and DPPG
deposition at t = 3, 5, 10, 60 and 120 min. Scaling exponents ( ) acquired from the subregions a and b and the correlation lengths ( ) attained for the transition of the ab and bI zones of the PSD curves of figure 5 a), b) and c). Spectral index ( ) obtained by fitting the PSD curves of figure 5 and the respective fractal dimension calculated using the equation 4. PSDABC model parameters given by equation 5 applied to the region II of the
PSD curves of Figure 5. Superstructure contribution components (PSDsh) given by equation 6. Parameter describes the mean size of
aggregates (superstructures). The correlation coefficient (CC) values were obtained from the fit of experimental data.
Scaling exponents correlation lengths PSDfractal model PSDABC model PSDsh model
DPPG Time adsorption (min) (nm) (nm) DF A (nm3) B (nm) C CC (m-1) (nm) Au 0 1.05 2.26 8.6 13.3 4.00±0.08 0±0.04 19.7±0.4 6.8±0.2 6.6±0.3 0.9846 3 0.3425 0.943 5.9 13.3 1.16±0.05 1.42±0.03 46±2 17±2** 2.2±0.3 0.9864 5 0.678 1.043 5.3 12.7 1.64±0.03 1.18±0.02 36.8±0.8 11±1 4.1±0.6 0.9940 10 1.0848 1.346 6.5 12.7 2.39±0.03 0.80±0.02 46.1±0.9 11±1 4.9±0.1 0.9959 120 0.7183 1.6723 6.8 13.8 2.48±0.06 0.76±0.03 25.5±0.9 12±2 3.8±0.8 0.9860 Au/PAH 0 0.75 2.815 9.9 15.9 2.7±0.1 0.65±0.05 17.0±0.5 7.5±0.2 5.8±0.3 0.9758 3 1.05 1.545 11.8 14.5 2.54±0.07 0.73±0.04 31±2 15±3 3.7±0.2 0,9806 5 1 1.56 11.8 15.2 2.60±0.08 0.7±0.04 39±2 15±3 3.8±0.8 0.9886 10 1 1.86 10.6 14.5 2.96±0.09 0.52±0.05 82±8 27±5 2.6±0.4 0.9864 60 0.9 1.715 10.6 15.2 2.67±0.09 0.66±0.05 39±2 12±3 4.1±0.2 0.9785 Au/PEM 0 1.015 1.71 9 42 2.60±0.05 0.7±0.03 2000±418 50±9 3.5±0.4 0.9977 4.4106 43 60 1.0 1.595 13 45 2.86±0.05 0.57±0.03 392±17 21.0±0.5 5.1±0.1 0.9957 4.4106 87*
* The second superstructure located at f= 1.6x10⁷ m-1 was not considered for the PSD
19
The first ( and second ( correlation lengths estimated for the gold-quartz crystal show values of ~13 nm and ~9 nm, respectively, related to the mean grain diameter of the surface resonator and are depicted in table II. Probably the presence of two different values is related with the fact that the quartz crystal resonator is coated with an under layer of chromium and an upper layer of gold. Therefore, the fact that these correlation length values are maintained during DPPG adsorption, lead us to conclude that the rupture of the vesicles on the Au surface arises. Similar correlation length values can be found in this table for the DPPG vesicles deposition onto PAH. However, the first and second correlation lengths have a higher mean value which can be attributed to the PAH layer onto the quartz crystal sensor.
To better analyze the surface of the films, the roughness exponents were determined by the relation,
where is the value of slope of the fitted PSD at two separate establishments and the obtained results are presented in table II. The and roughness exponents describe a combination of two processes that control the surface morphologies during growth and the mechanism responsible for the particles deposition [22].
The scaling exponent value, = 0.68, for DPPG liposomes adsorbed onto Au surface at 5 minutes is consistent with Villain model [24 and references therein]. This model predicts that the deposition of particles is preferentially driven by interactions with neighboring particles. This rough exponent shows the balance between random fluctuations and diffusion processes, i.e. the mechanism is far-from-equilibrium. At 10 min of liposomes adsorption takes a value of 1, meaning that the stabilization of the process has occurred and a presence of a smooth DPPG lipid bilayer covering the surface is formed.
Roughness exponents estimated from region IIb for the deposition of DPPG onto PAH show values close to unit, signifying that the surface is totally covered by a lipid bilayer after 3 min of phospholipid adsorption, i.e. the solid-liquid interface reached the steadiness. This fast adsorption and rupture of the liposomes is due to a strong interaction between the liposome and the completely charged PAH surface [25]. The explanation for this behavior has been reported in literature, whereby the spread of the lipid membrane over a planar surface is favored at low pH, regardless to the net charge of the bilayer, a process that it is driven by van der Waals forces[26].
Although it proven that the DPPG adsorption mechanism and consequent formation of a lipid bilayer reached its balance before t=3 min [8], afterwards (t=10 min) the rough exponent increased, due to the accumulation of aggregates of liposomes onto the Au/PAH/DPPG-bilayer surface; being which implies a locally rough surface and
20
a decrease of the fractal dimension. After 3 min of DPPG adsorption the rough exponent, , is close to the unit, which is in good agreement with the linear growth equation of the diffusion Villain model [4,24].
Scaling exponents calculated from region IIa for both (Au and PAH) surfaces have a similar anomalous dynamic behavior, shown by the increase of rough exponent as time passes; it became , which is more evident in the Au/PAH/DPPG film. In this last situation, the roughening fluctuations and the smoothing effects cannot reach a balance, and the local surface slope increases and changes with time, as it is possible to observe by the large error of the Sq at 10 min of DPPG adsorption.
By plotting the Sq roughness evolution of Au/PAH/DPPG surface films as a function of time and fitting the power law behavior to the Sq roughness as Sq (L,t)∝tβ, we can
obtain the growth exponent . However, as described above, at 3 min of DPPG adsorption onto PAH layer a lipid bilayer has already been formed and thus the growth exponent cannot be estimated.
More valuable information can be extracted from PSD spectra, e.g. mean grain diameter and fractal dimensions, by applying PSD models, such as the Fractal model (PSDfractal)
and the ABC or K-correlation model (PSDABC)[27]. Generally, for high spatial
frequencies PSD function reflects the roughness contribution from all features of the surface which can be described by the inverse power law decay as follows [27]:
where f is the spatial frequency, K is the spectral strength and is the spectral index. This index allows to determine the fractal dimension, , which in turn can be used to quantify the surface morphology. The values can be calculated, in the case of PSD at one dimension, by the equation [28,29]:
The dimension value determines the relative amounts of the surface irregularities at different distance scales. To determine surface fractal components the medium-frequency region (region II) of the PSD of Figures 5 a), b) and c) were fitted with the PSDfractal model given by equation 3. The spectral index found ( ) and the fractal
dimensions (Df) obtained by the equation 4 are listed in table II. Initially, the Au/DPPG surface has stronger fractal components than the Au/PAH/DPPG film. But as time passes, fractal components of the Au/DPPG surface decrease and the final Df reaches a value close to the Au/PAH/DPPG surface. Both films have a Df nearly 1; so the surfaces can be described as marginal fractal or smooth.
21
Another model can be applied to extract information retained in these PSD curves. For medium spatial frequencies, PSD plots can be characterize by the k-correlation or ABC model (PSDABC), which is a generalization of the fractal model presenting a flat
response below a cut-off frequency followed by a decrease of the PSD values with the increase of spatial frequency, and is represented by the equation [30-34]:
where A, B and C are the functional parameters. A parameter describes the low frequency limit of the spectrum meaning there is no significant deviation in the height value across these dimensions in real space. B parameter determines the transition between the low-frequency plateau and the sloped part of PSD indicating the position of the curve “knee” which is related to the correlation length and represents the mean grain size. C parameter is the inverse slope at high spatial frequency range, which gives the nature of roughness and is related to different growth mechanisms; it is a constant greater than 2. This parameter explains film growth in terms of: viscous flow (C = 1), evaporation and condensation (C = 2), bulk diffusion (C = 3) and surface diffusion (C = 4) [33,35].
Table II also presents the PSDABC model parameters obtained by fitting the region II of
the PSD curves of figures 5 a) and b) with the equation 5. In this model, the correlation length is given by the parameter B, which is related to the mean grain diameter of the surface. The results showed values like those obtained by the frequency inverse mode ( ). The exception falls on the Au/PAH/DPPG at 10 min where the correlation length shows a value close to the mean vesicle diameter, ~27 nm. Probably the real value is masked by some vesicles that have been stuck on the Au/PAH/DPPG surface after formation of the DPPG bilayer. The magnitude at low spatial frequencies (A parameter) is related to the height of the rough surfaces. It is possible to observe that the A parameter generally remains constant in 1D PSD at low frequencies for Au/DPPG and Au/PAH/DPPG LbL films, however and because of the formation of vesicles aggregated on both surfaces at 3 and 10 min, for the first and second films respectively, there is an increase of the A parameter. The C parameter, corresponding to the inverse slop of the PSD curve, gives the nature of the roughness and is associated to growth mechanisms. Looking at the major periods of DPPG adsorption, both samples present a C~3, revealing that the film growth corresponds to bulk diffusion.
The final fractal dimension (Df) values for DPPG liposomes immobilization on both surfaces were also attained by the K-correlation or ABC model and the obtained values are close of the values obtained by using the equation 4.
22
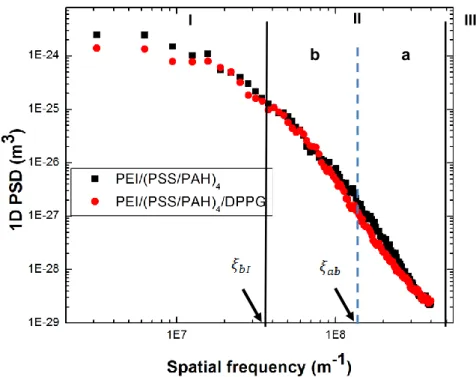
Figure 5 c) presents the PSD spectra of Au/PEI/(PSS/PAH)4 and
Au/PEI/(PSS/PAH)4/DPPG surfaces profiles. The plateau at low spatial frequencies
(region I) 2.2107 m-1 of the PSD spectra reveals an absence of any characteristic
length beyond ca. 45 nm. This region can also give information about height profiles deviations of the surface. Thus, a rather decrease of the magnitude of the power spectra at low frequencies, after DPPG liposomes assembly onto the PEM, means that vesicles have contributed to a small reduction of the surface roughness. The region II of PSD spectra obeys to two regimes that are frequency dependent and have a constant slope (sub-regions IIa and IIb). This region characterizes the surface self-affine behavior and involves intermediate frequencies at 2.2107 m-1 3.1108 m-1, representative of a
combination of two mechanisms during the surface growth. The region III ( 3.1108
m-1) of the PSD spectra was not considered for surface analysis. At subregion IIb, these
PSD spectra have a smoother corner than the one obtained for DPPG vesicles immobilization on Au or Au/PAH (see figure 5 a) and b)) meaning a surface with a higher thickness.
The first ( and second correlation length ( each having a specific transition frequency and marked with arrows in figure 5 c), can express the mean grain diameter of a self-affine surface, in this case containing two different arrangements. Table II shows the values found for the two correlation lengths, 9 and 42 nm for Au/PEM, and 13 and 45 nm for Au/PEM/DPPG assigned to the mean grain diameter of gold and PEM surfaces, respectively, but this model does not allow the calculation of the mean grain diameter of the DPPG vesicles attached to the PEM.
The roughness exponents ( ) of the fitted PSD spectra were estimated by equation 2 in the two regimes and the found parameters are listed in table II. For both systems, the is equal to one, meaning that the growth surface as reached the equilibrium following the diffusion Villain model and the grain morphology approaches to the ideal circular shape. The fact that decreased after the deposition of the DPPG vesicles reveals a reduction of the number of the aggregates on the surface.
The region II of the PSD spectra was also fitted with the PSDfractal model which
considers the substrate influence and provides the information about the relative amounts of the surface irregularities at different scales. The spectral parameters and Df values were estimated using equations 3 and 4, respectively, and the found values are listed in table II. The spectral indices ( ) for both films are similar. This is also evident in the high-frequency region where the slope of the PSD curves is almost the same. However, the spectral strength (K) is higher for the surface with DPPG liposomes. This outcome suggests that this heterostructure has stronger fractal components. Both films have a Df of almost 1 which indicates that they belong to the category of marginal fractal, being the PEM/DPPG surface smoother and with less irregularities on its topography than the PEM cushion.
23
Conventional PSD analysis method reveals the correlation lengths for PEM and gold surfaces, but it does not allow the detection of DPPG vesicles on surface. So, a further examination using the ABC or k-correlation model was applied to medium frequencies of the PSD plots of figure 5 c). The PSD plots feature of the samples Au/PEM and Au/PEM/DPPG were characterized using the ABC model and the computed A, B and C parameters are shown in table II. The A parameter which is the magnitude at low spatial frequency, has shown to decrease after the DPPG vesicles deposition onto PEM indicating a diminution of the height of the rough surface. The B parameter determines the position of the ‘knee’, which is defined as the slope of a line connecting two points of the surface and corresponds to the mean grain diameter of the features of a rough surface. The obtained values for this parameter were 50±9 nm and 21.0±0.5 nm corresponding to the mean grain size of PEM and of PEM/DPPG, respectively. It is interesting to observe that the attained mean grain size value for PEM is approximately equal to the parameter (42 and 45 nm) calculated by the conventional correlation length method and it is assigned to the PAH polymer domains. The mean grain size of 21.0±0.5 nm found for PEM/DPPG surface is similar to the mean grain hydrodynamic diameter of the DPPG liposomes measured by DLS [8]. Thus strengthening the idea that DPPG vesicles immobilize onto PEM surface maintain its own structure, i.e. without being flattened. Besides, this is a proof of consistence of the ABC analysis method, since it is able to separate correctly the DPPG vesicles component from the total roughness of the sample, in this case the PEM domains. The results attained from this method allow to access information that would not be possible from the conventional PSD interpretation. The intrinsic contribution obtained from C parameter outlines the growth mechanisms of the surface under analysis. The value found for the PEM LbL was 3.5±0.4 which lies between the condensation mechanism and the bulk diffusion, and for the PEM/DPPG was 5.1±0.1 referring to a surface diffusion. Finally, taking into the roughness nature one can conclude that the PEM cushion has a more irregular structure than the PEM/DPPG surface, which is composed by an organized layer of close-packed DPPG vesicles.
Although the ABC model has proved to be a good tool to apply to the plateau of medium frequencies (subregion IIb of figure 5 c)), the PSD spectra is not adapted to this model at the low frequency region (I). It is well known that the low frequency components of the PSD spectra represent the aggregates or superstructures. The presence of such superstructures (or grain clusters) can be extracted from the PSD spectra of these films using the PSDsh model, represented by the following equation
[26]:
where stands for the lateral size of the features on the surfaces, is associated to the volume of the features and is the spatial frequency of the superstructures of the surface.
24
This model was applied to the region I of the PSD plots of figure 5 c) and the found values are listed in table II. The lateral size of the superstructures is given by the parameter. The results showed values of 43 nm and 87 nm for the parameter of the PEM and PEM/DPPG surfaces, respectively. This observation leads us to assume that if vesicles with 21 nm of mean hydrodynamic diameter are densely immobilized onto PEM surface, comprising 43 nm of length size, a final value of 87 nm for the superstructures is reliable. This is also a proof that DPPG vesicles are disposed onto PEM domains. However, another superstructure located in the PSD curve at 1.6x10⁷ m-1
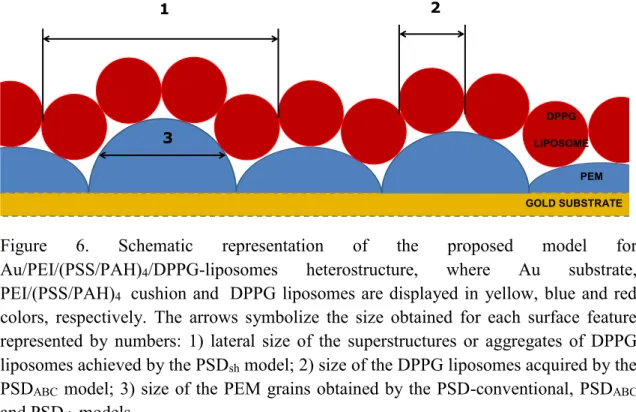
frequency (63 nm) could not be fitted due to the reduced number of points.Concluding, after diffusion processes the DPPG vesicles joined the PEM leading to a duplication of the length size of the PEM mounds and the surface morphology becomes more regular with a lower fractal dimension. Figure 6 outlines the schematic model obtained for the Au/PEI/(PSS/PAH)4/DPPG heterostructures.
Figure 6. Schematic representation of the proposed model for Au/PEI/(PSS/PAH)4/DPPG-liposomes heterostructure, where Au substrate,
PEI/(PSS/PAH)4 cushion and DPPG liposomes are displayed in yellow, blue and red
colors, respectively. The arrows symbolize the size obtained for each surface feature represented by numbers: 1) lateral size of the superstructures or aggregates of DPPG liposomes achieved by the PSDsh model; 2) size of the DPPG liposomes acquired by the
PSDABC model; 3) size of the PEM grains obtained by the PSD-conventional, PSDABC
and PSDsh models.
Conclusions
In this study we characterized and analyzed the evolution of surface morphology of Au, Au/PAH and Au/ PEI/(PSS/PAH)4 surfaces by in situ AFM as DPPG liposomes are
being adsorbed on it.
Surface topographies obtained by in situ AFM of DPPG liposomes deposited onto two different smooth surfaces, such as Au-quartz crystal resonator and PAH polyelectrolyte layer, have proved that vesicles break, unfold and spread throughout the surfaces, creating a DPPG lipid bilayer. Amplitude parameters comparison between both
2 GOLD SUBSTRATE PEM DPPG LIPOSOME 3 1
25
experiments showed that the formation of a lipid bilayer is faster when a more ionized surface is used, such as PAH. Kinetic adsorption curves obtained by QCM for DPPG liposomes adsorption onto this highly charged surface allowed to confirm this assumption. Also, the amplitude analysis showed that DPPG vesicles remain intact when adsorbed onto a rough cushion (Au/PEI/(PSS/PAH)4) filling the valleys and
consequently minimizing the surface acuity.
The PSD spectra of surface topographies were analyzed by conventional correlation length method and by fractal, ABC or k-correlation models and superstructure. Two types of correlation lengths for Au/DPPG and Au/PAH/DPPG LbL films were found and assigned to the grain size of Au/Cr quartz crystal coverage and to the Au/PAH, respectively. The scaling exponents revealed that DPPG-liposomes adsorbed onto Au and Au/PAH surfaces follow, respectively, the non-linear and linear Villain self-affine model. The ABC nonlinear parametrical model was well adapted to all PSD spectra allowing extracting the mean grain size of the surfaces and the roughness behavior thus validating the amplitude analysis. Both PSD models achieved Df values nearly 12, which means that both samples have fractal smooth or marginal surfaces.
For the rough surfaces the conventional correlation length method revealed to be inefficient because it find the grain size assigned to the PEM cushion and to the gold surface. The PSD analysis using the ABC model have shown that: i) surface roughness decreases after DPPG vesicles adsorption; ii) the attained grain size values of 50±9 and 21.0±0.5 nm are attributed to PAH cushion domains and to closed vesicles immobilized on cushion, respectively; iii) the adsorption of DPPG liposomes onto PEM revealed to be caused by diffusion. The PSD superstructure model allowed obtaining the lateral sizes of the grain clusters, showing a value close to the size of the grain cushion, although for DPPG surface a much higher value was achieved, proving the hexagonal packing of the DPPG liposomes onto PEM. The fractal and ABC PSD models have shown Df close to 1, being the Df of the PEM/DPPG surface smaller, manifesting less irregularities on its topography. The roughness exponents set forth that DPPG vesicles deposition is ruled by the diffusion Villain model.
Finally, it should be remarked that all these methods complement each other providing an exhaustive description not only of the accessible surface of the sample but also of its inner structural properties. So, the information that can be achieved from experimental AFM images can be integrated by using different complementary method of image analysis.
Acknowledgments
The authors acknowledge funding from the Portuguese National Funding Agency FCT-MEC through CEFITEC Research Grant UID/FIS/00068/2013 and PEst-OE/CTM/LA0024/2013, UID/Multi/00612/2013 e IF/00808/2013 (POPH, UE-FSE), Portugal, A.A.D. acknowledges the fellowship SFRH/BD/62229/2009, FCT, Portugal
26
and M.R. the financial support from the project PTDC/FIS-NAN/0909/2014, FCT, Portugal.
References
1 F. Pires, A. A. Duarte, Q. Ferreira, G. Magalhães-Mota, Paulo A. Ribeiro and M. Raposo,
“Imaging of liposomal drug delivery systems by atomic force microscopy”, in “Microscopy and imaging science: practical approaches to applied research and education”, edited by A. Méndez-Vilas, Formatex Research Center, http://www.microscopy7.org/, ISBN-13: 978-84-942134-9-6, 183-194, February 2017.
2 M. Iazykov, Growth of pentacene on parylene and on BCB for organic transistors application,
and DNA-based nanostructures studied by Amplitude: Modulation Atomic Force Microscopy in air and in liquids, in, Ecole Centrale de Lyon, 2011.
3 Marco Salerno, Luca Giacomelli, Giacomo Derchi, Niranjan Patra, Alberto Diaspro, Atomic
force microscopy in vitro study of surface roughness and fractal character of a dental restoration composite after air-polishing, BioMedical Engineering OnLine (2010) 9:59.
4 A.-L. Barabási, Fractal concepts in surface growth, Cambridge university press, 1995. 5 D.G. Lee, J.S. Bonner, L.S. Garton, A.N.S. Ernest, R.L. Autenrieth, Modeling coagulation
kinetics incorporating fractal theories: comparison with observed data, Water Research, 36 (2002) 1056-1066.
6 D.H. Li, J. Ganczarczyk, Fractal geometry of particle aggregates generated in water and
wastewater treatment processes, Environmental science & technology, 23 (1989) 1385-1389.
7 X. Li, B.E. Logan, Size distributions and fractal properties of particles during a simulated
phytoplankton bloom in a mesocosm, Deep Sea Research Part II: Topical Studies in Oceanography, 42 (1995) 125-138.
8 Duarte AA, Filipe SL, Abegão LM, Gomes PG. Ribeiro PA, Raposo M Adsorption Kinetics of
DPPG Liposome Layers: A Quantitative Analysis of Surface Roughness. Microscopy and Microanalysis,7:1-9. (2013).
9 Duarte, Andreia A., et al. "DPPG Liposomes Adsorbed on Polymer Cushions: Effect of
Roughness on Amount, Surface Composition and Topography." The Journal of Physical Chemistry B 119.27 (2015): 8544-8552.
10 G. Decher, Fuzzy nanoassemblies: Toward layered polymeric multicomposites, Science, 277
(5330), 1232-1237 (1997).
11 A.A. Duarte, M. Raposo, Growth analysis of PEI/DPPG self-assembled films by Quartz
Crystal Microbalance, Bioengineering (ENBENG), 2012 IEEE 2nd Portuguese Meeting in, (Feb. 2012) 1-6.
12 J. T. Marquês, A. S. Viana, R. F.M. De Almeida, Ethanol effects on binary and ternary
supported lipid bilayers with gel/fluid domains and lipid rafts, Biochimica et Biophysica Acta 1808, 405–414 (2011).
13 A. A. Duarte; L. M. G. Abegão, J. H. F. Ribeiro, J. P. Lourenço, P. A. Ribeiro, M. Raposo,
27
microbalance: Influence of experimental layout, Review of Scientific Instruments 86, 063901 (2015).
14 G.Z. Sauerbrey, Use of the vibrating quartz for thin film weighing and microweighing, Phys,
155 (1959) 206-222.
15 D.E. King, Oxidation of gold by ultraviolet light and ozone at 25 C, Journal of Vacuum Science
& Technology A, 13 (1995) 1247-1253.
16 T.H. Anderson, Y. Min, K.L. Weirich, H. Zeng, D. Fygenson, J.N. Israelachvili, Formation of
supported bilayers on silica substrates, Langmuir, 25 (2009) 6997-7005.
17 J. Choi, M.F. Rubner, Influence of the degree of ionization on weak polyelectrolyte multilayer
assembly, Macromolecules, 38 (2005) 116-124.
18 Q. Ferreira, P. J. Gomes, P. A. Ribeiro, N. C. Jones, S. V. Hoffmann, N. J. Mason, O. N.
Oliveira, Jr. and M. Raposo, Determination of Degree of Ionization of Poly(allylamine hydrochloride) (PAH) and Poly[1-[4-(3-carboxy-4 hydroxyphenylazo)benzene sulfonamido]-1,2-ethanediyl, sodium salt] (PAZO) in Layer-by-Layer Films using Vacuum Photoabsorption Spectroscopy, Langmuir, 29 (1), 448–455, 2013.
19 A.A. Duarte, M. Raposo, Growth analysis of PEI/DPPG self-assembled films by quartz crystal
microbalance, in: Bioengineering (ENBENG), 2012 IEEE 2nd Portuguese Meeting in, 2012, pp. 1-6.
20 A.A. Duarte, P.J. Gomes, J.H.F. Ribeiro, P.A. Ribeiro, S.V. Hoffmann, N.J. Mason, O.N.
Oliveira Jr., M. Raposo, The European Physical Journal E-Soft matter, “Characterization of PAH/DPPG layer-by-layer films by VUV spectroscopy”, 36( 9), 9912, 2013.
21 M.W. Mitchell, D.A. Bonnell, Quantitative topographic analysis of fractal surfaces by scanning
tunneling microscopy, Journal of Materials Research, 5 (1990) 2244-2254.
22 Q. Ferreira, G. Bernardo, A. Charas, L.s. Alcácer, J. Morgado, Polymer Light-Emitting Diode
Interlayers. Formation Studied by Current-Sensing Atomic Force Microscopy and Scaling Laws., J Phys Chem C Nanomater Interfaces, 114 (2009) 572-579.
23 P. Dash, P. Mallick, H. Rath, A. Tripathi, J. Prakash, D. Avasthi, S. Mazumder, S. Varma, P.
Satyam, N. Mishra, Surface roughness and power spectral density study of SHI irradiated ultra-thin gold films, Applied Surface Science, 256 (2009) 558-561.
24 Q. Ferreira, P. A. Ribeiro, M. Raposo, Villain's fractal growth of
poly[1-[4-(3-carboxy-4-hydroxyphenylazo) benzenesulfonamido]-1,2-ethanediyl, sodium salt] J-aggregates onto layer-by-layer films and its effect on film absorbance spectrum”, Journal of Applied Physics, 113, 243508, 2013.
25 J.M. Lourenço, P.A. Ribeiro, A.M. Botelho do Rego, M. Raposo, Counterions in layer-by-layer
films-influence of the drying process, J Colloid Interface Sci, 313 (2007) 26-33.
26 P.S. Cremer, S.G. Boxer, Formation and Spreading of Lipid Bilayers on Planar Glass
Supports, J Phys Chem B, 103 (1999) 2554-2559.
27 J. Ferre´ -Borrull, A. Duparre´, E. Quesnel, Procedure to characterize microroughness of
optical thin films: application to ion-beam-sputtered vacuum-ultraviolet coatings, Appl. Opt. 40(13), (2001) 2190-2199.
28 K. Ohmiya, Fractal Dimensions of Terrain Profiles, Journal of Terramechanics, Vol. 28, No.
28
29 X. Cui, J.F. Hetke, J.A. Wiler, D.A. Anderson, D.C. Matice, Electrochemical deposition and
characterization of conducting polymer polypyrrole/PSS on multichannel neural probes, Sensors and Actuators, A93 (2001), 8-18.
30 E.L. Church, P.Z. Takacs, “The optimal estimation of finish parameters,” SPIE Vol. 1530,
(1991) 71-85.
31 E.L. Church, P.Z. Takacs, T.A. Leonard, “The prediction of BRDFs from surface profile
measurements,” SPIE Vol. 1165, (1989) 136-150.
32 M. G. Dittman, K-correlation power spectral density and surface scatter model, Proc. SPIE
6291, Optical Systems Degradation, Contamination, and Stray Light: Effects, Measurements, and Control II, (2006) 62910R.
33 R. Gavrila, A. Dinescu, D. Mardare, A Power Spectral Density Study of Thin Films
Morphology based on AFM Profiling. Rom. J. Inf. Sci. Technol., 10 (3), (2007) 291−300.
34 T. Itoh, N. Yamauchi, Surface morphology characterization of pentacene thin film and its
substrate with under-layers by power spectral density using fast Fourier transform algorithms, Appl Surf Sci, 253 (2007) 6196-6202.