MASTERS
ACCOUNTING, TAXATION AND CORPORATE
FINANCE
MASTER THESIS
DISSERTATION
Power and trust as determinants of tax compliance. The
slippery slope framework applied to Portugal and
Switzerland
MARCELO JOSÉ SILVA RODRIGUES
MASTERS
ACCOUNTING, TAXATION AND CORPORATE
FINANCE
MASTER THESIS
DISSERTATION
Power and trust as determinants of tax compliance. The
slippery slope framework applied to Portugal and
Switzerland
MARCELO JOSÉ SILVA RODRIGUES
SUPERVISOR:
PhD TIAGO RODRIGO ANDRADE DIOGO
i
Abstract
The “slippery slope” framework assumes that economic determinants of tax behavior represent authorities’ power, which leads to enforced tax compliance. On the other hand, psychological determinants lead to trust in authorities and also to voluntary tax compliance. This research work aims to assess the perception of Portuguese and Swiss individual taxpayers in relation to various aspects of their relationship with tax authorities and the respective impact on tax evasion. The data set was obtained from two surveys applied during 2019, one applied to Portuguese taxpayers and another to Swiss taxpayers, that filed personal tax returns at least once during the previous five fiscal years. The sample consists of 179 questionnaires. Eight dimensions were identified: tax evasion, voluntary tax compliance, enforced tax compliance, trust; legitimate power; coercive power; power and legitimacy. The empirical work was carried out through a series of tests of mean differences (t test) and multiple comparisons (Scheffé test) for the investigation of significant differences. It was found that trust presented the greatest number of significant differences, taking into account the control variables sex, age, country, tax return submission, tax education, conjugality, Current Feeling of Belonging to a Religion (CFBR), religion and degree of comfort with the income (DCI). In relation to these, country was the control variable that most contributed to the differences in means, in relation to certain tax matters.
We also estimated an econometric model for tax evasion. We found that voluntary tax compliance, trust and legitimate power, are statistically significant and negatively correlated with tax evasion. In addition, we also found that there is a positive and statistically significant correlation between tax evasion and the dimensions enforced tax compliance and coercive power.
JEL Classification: H20, H24 and H26.
ii
Resumo
O conceito de "slippery slope" pressupõe que os determinantes económicos do comportamento fiscal representem o poder das autoridades, o que por sua vez leva ao cumprimento fiscal coercivo. Por outro lado, os determinantes psicológicos levam à confiança nas autoridades e também ao cumprimento fiscal voluntário. Este trabalho de pesquisa tem como objetivo avaliar a percepção de contribuintes individuais portugueses e suíços em relação a vários aspectos de seu relacionamento com as autoridades fiscais e o respectivo impacto na evasão fiscal. O conjunto de dados foi obtido de duas pesquisas aplicadas em 2019, uma aplicada a contribuintes portugueses e outra a contribuintes suíços, que apresentaram declarações de impostos pessoais pelo menos uma vez nos cinco exercícios fiscais anteriores. A amostra é composta por 179 questionários. Foram identificadas oito dimensões: incumprimento fiscal, cumprimento fiscal voluntário, cumprimento fiscal coercivo, confiança; poder legítimo; poder coercivo; poder e legitimidade.
O trabalho empírico foi realizado através de uma série de testes de diferenças médias (teste T) e comparações múltiplas (teste de Scheffé) para a investigação de diferenças estatisticamente significativas. Constatou-se que a confiança apresentou o maior número de diferenças significativas, considerando as variáveis de controlo: sexo, idade, país, submissão de declaração fiscal, educação tributária, conjugalidade, Sentimento Atual de Pertença a uma Religião (CFBR), religião e grau de conforto com a renda (DCI). Em relação a estes, país foi a variável de controle que mais contribuiu para as diferenças de médias em relação a certas questões tributárias.
Também estimamos um modelo econométrico para o incumprimento fiscal. Constatamos que o cumprimento fiscal voluntário, a confiança e o poder legítimo são estatisticamente significativos e correlacionados negativamente com o incumprimento fiscal. Além disso, também descobrimos que existe uma correlação positiva e estatisticamente significativa entre o incuprimento discal e as dimensões do cumprimento fiscal coercivo e do poder coercivo.
Classificação JEL: H20, H24 and H26.
iii
Acknowledgments
To professor Tiago Diogo, supervisor of this dissertation, for the wisdom and fundamental help provided throughout the process. I am grateful for the time available and the clarification of doubts, as well as all the advice and experience that made this work possible.
To my parents, who have always been a crucial pillar of support and encouragement during my academic career and life. Thank you so much for the opportunity you gave me to study and for the sacrifice you made to make this possible.
To all my friends and colleagues who, directly or indirectly, contributed, encouraged or helped throughout the academic path and in the preparation of this dissertation.
My deep and sincere thanks to all these people who contributed to the realization of this dissertation.
iv
List of Abbreviations
CPI – Corruption Perceptions Index
CFBR – Current Feeling of Belonging to a Religion DCI – Degree of comfort with the income
HNWT – High Net Worth Taxpayers
IRS – Imposto sobre Rendimento das Pessoas Singulares SSF – Slippery slope framework
v
List of Tables
Table of Contents 1 INTRODUCTION ... 1 2 LITERATURE REVIEW ... 3 2.1 TAX COMPLIANCE ... 32.2 MAJOR TRENDS RELATED TO TAX COMPLIANCE ... 4
2.3 THE TAX GAME AND THE INTERACTION BETWEEN TAXPAYERS AND TAX AUTHORITIES .... 5
2.4 PARADIGMS ON THE INTERACTION BETWEEN TAXPAYERS AND TAX AUTHORITIES ... 5
2.4.1. Cops and Robbers ... 6
2.4.2. Service provider and customer ... 7
2.5 TRUST ... 9
2.6 POWER ... 10
2.7 THE “SLIPPERY SLOPE” FRAMEWORK (SSF) ... 11
2.8 EMPIRICAL STUDIES RELATED TO THE SSF ... 13
3 RESEARCH QUESTION AND HYPOTHESES ... 14
4 METHODOLOGY AND DATA ... 15
4.1 DATA COLLECTION ... 15
4.2 TARGET POPULATION AND SAMPLE CHARACTERIZATION ... 16
5 RESULTS AND DISCUSSION ... 18
5.1 DESCRIPTIVE ANALYSIS OF THE QUESTIONNAIRE AND THE CREATION OF DIMENSIONS .. 18
5.2 TAX EVASION ... 18 5.3 ENFORCED TAX COMPLIANCE ... 20 5.4 VOLUNTARY TAX COMPLIANCE ... 22 5.5 TRUST ... 23 5.6 LEGITIMATE POWER ... 25 5.7 COERCIVE POWER ... 27
5.8 KEY TAKEAWAYS FROM OF THE RESULTS OBTAINED ... 28
5.9 ECONOMETRIC MODEL ANALYSIS ... 29
6 CONCLUSIONS, LIMITATIONS AND TOPICS FOR FUTURE RESEARCH ... 31
6.1 CONCLUSIONS ... 31
6.2 LIMITATION AND FUTURE RESEARCH ... 33
7 REFERENCES... 34
8 APPENDICES ... 42
I. APPENDIX A – ENGLISH QUESTIONNAIRE ... 43
1
1 Introduction
Countries use taxes for financing public services and goods. Taxpayers perceive taxes as a burden and are usually sceptical about how governments manage and spend their taxes and often hold negative attitudes towards taxpaying (Hofmann et al., 2008; Benk & Budak, 2011). This scepticism is increased when there is a common belief that corruption is spread across government institutions. Furthermore, during periods of fiscal imbalances where there is an increased pressure to reduce public debt, most governments take measures to increase tax collection. Taxpayers may be reluctant to comply under pressure of tight personal and domestic budgets. Consequently, tax revenues diminish due to noncompliance and often governments rely on increased tax rates to make up for such loss.
Tax authorities influence taxpayer’s behaviour to comply with tax law through displaying power and/or establishing a trust relationship. Therefore, it is crucial to understand what influences taxpayers’ attitudes towards tax compliance. Trust, perceptions of fairness and corruption have consistently been identified as playing a crucial role in tax compliance (Torgler, 2003, 2004; Wenzel, 2003; Sonnur et al., 2019). Where governments are seen to be fair, not corrupt and treat citizens with respect, taxpayers are likely to trust them and show more willingness to comply and honestly pay their fair share in taxes (Feld & Frey, 2007). Concurrently, power displayed by authorities has also been identified as a main contributor to compliance namely the sanctions used to enforce tax compliance.
According to the Slippery Slope Framework (SSF) (Kirchler, 2007; Kirchler & Wahl, 2010; Muehlbacher & Kirchler, 2010) the effectiveness of economic and non-economic factors depends on the relationship between taxpayers and tax authorities. In a trustful climate, trust-building measures may be more important than in a relationship that is based primarily on the power of authorities, where deterrence may be the right policy (Muehlbacher et al., 2011). In the SSF, two different forms of tax compliance are assumed: (i) voluntary tax compliance and (ii) enforced tax compliance (Kirchler, 2007).
Based on these definitions, we test the relationship between tax evasion and enforced tax compliance, voluntary tax compliance, trust, legitimate power and coercive power in Portugal and Switzerland. Switzerland has been chosen by two main reasons, first, the central government takes a low share of total tax revenues when compared to other OECD countries,
2
(e.g., in 2018, 27.9 percent, OECD average countries, 34.3 percent). Secondly, Switzerland had the lowest average size, 7.2 percent of GDP of shadow economy1 from a set of 158 countries over the period 1991 to 2015 (e.g., the average of the 158 countries was 31.9 percent of GDP while in Portugal was 21.9 percent of GDP (Medina & Schneider, 2018).
This research work aims to assess the perception of Portuguese and Swiss individual taxpayers in relation to various aspects of their relationship with tax authorities and the respective impact on tax evasion, as well as to ascertain whether there are statistically significant differences in the scope of sociodemographic variables as well as religion. It is important to note that there are several relationships that can be tested, tax evasion, our dependent variable. The independent variables will be the dimensions defined for the study of the interaction between taxpayers and tax authorities (voluntary tax compliance, enforced tax compliance, trust; legitimate power; coercive power; power and legitimacy). The primary research question is “What are the determinant dimensions in tax evasion?”.
In addition, we considered secondary research questions based on nine control variables (sociodemographic and religion) which are widely used by other authors (McKerchar, 2003; Torgler, 2007; Devos, 2014). The secondary research question is “Which control variable(s) lead to statistically significant differences in relation to the defined dimensions”.
In order to test the main hypotheses, the data set was obtained through questionnaire survey. This survey was based on questions (indicators) previously elaborated and tested by other authors in other countries. The questionnaire form was derived from (Kastlunger et al., 2013) study with Italian taxpayers. The questionnaire was applied to individuals tax residents in Portugal that had submitted at least once a tax return in Portugal for personal income tax purposes during the last five previous fiscal years, the same principle was applied for Switzerland. The questionnaire was made available online using the google forms platform and was shared across multiple social media platforms. The questionnaire was administered in 2019.
1 The shadow economy includes all economic activities which are hidden from official authorities for monetary,
regulatory, and institutional reasons. Monetary reasons include avoiding paying taxes and all social security contributions, regulatory reasons include avoiding governmental bureaucracy or the burden of regulatory framework, while institutional reasons include corruption law, the quality of political institutions and weak rule of law.
3
We conducted two quantitative surveys, Switzerland (N = 97) and Portugal (N = 82). The results obtained point to country as the variable with more dimensions that have statistically significant differences in means (7 out of 8). Thus, the differences between Swiss and Portuguese taxpayers in relation to certain matters of a tax nature were remarkable.
We also estimated an econometric model for tax evasion. We found that voluntary tax compliance, trust and legitimate power, are statistically significant and negatively correlated with tax evasion. In addition, we also found that there is a positive and statistically significant correlation between tax evasion and the dimensions enforced tax compliance and coercive power.
2 Literature Review
2.1 Tax compliance
One of the first approaches to the concept of tax compliance is that tax compliance is verified when taxpayers timely declare income earned and expenses incurred in a timely manner so that the income tax settlement amount is accurate, respecting the tax rules in force and the prevailing jurisprudence at each moment in time (Roth et al., 1989). (Devos, 2014) completes this definition by introducing the definition of tax non-compliance (which does not include tax planning situations (legal tax invoice reduction within the terms of the law) or tax avoidance (when tax invoice reduction is performed through use of loopholes which can create ambiguity in the tax law). The author understands that tax non-compliance includes situations of excess of deductible expenses in tax reporting or even of underreporting earned income. The latter may occur intentionally - a sanctioned situation - or involuntarily, for lack of information, lack of understanding of the applicable tax law, negligence, among other reasons.
The topic of tax (non) compliance was also studied from a macro perspective, using the tax gap2 concept by (James & Alley 1999; 2002). This definition was also used in the works of (Devos, 2005; 2014; Kirchler, 2007; Kirchler & Wahl, 2010), among others. Still, there is no definition of tax compliance that is unanimously accepted by all researchers due to the
2 It is the difference between the amount of tax that should have been legally paid by taxpayers and the
4
diversity of their background and the diverse scope of their work Devos (2005; 2014), Diogo (2018).
The OECD also has its own definition of tax compliance, according to which tax compliance consists of cumulatively fulfilling the following conditions: 1) being duly registered with the tax authorities; 2) submit the income statements in a timely manner; 3) declare the correct amounts of income and expenses and 4) pay the taxes due within the stipulated deadlines. It is understood that if one of these conditions is not met, the taxpayer will be in a non-compliant scenario.
2.2 Major trends related to Tax Compliance
There are two major trends in the field of study of tax compliance or tax avoidance/tax evasion. The first trend is associated with models based on economic theory. The models based on economic theory assume that taxpayers are rational and aim to maximize their expected utility by guiding their strategic decisions with this goal in mind. If the probability of detection or audit is not too high and the fines or penalties are not too severe, taxpayers will tend to under-report income and / or over-declare expenses, thus entering intentionally in tax non-compliance. The same is to say that intentional tax non-compliance will occur in situations where the respective benefits exceed the costs (Becker, 1968).
The second trend for the study of tax compliance and / or tax evasion and fraud is associated with models of social and tax psychology whose pioneering work was (Schmölders, 1959). Furthermore, other authors reinforced the relevance of behavioural aspects to the study of the theme in question (Pickhardt & Prinz, 2014). From their perspective, tax (non) compliance, is a process in which individuals relate directly or indirectly to each other.
With tax payments being a duty of all citizens, tax authorities have the primary function of ensuring that taxpayers pay taxes due to meet the state's financial needs and for a fair redistribution of income and wealth. Tax authorities will safeguard tax compliance in two ways: (i) taxpayers voluntarily pay their taxes because they understand that it is their moral duty or (ii) taxpayers pay their taxes because they are obliged through enforced power of the tax authorities (Braithwaite, 2003 and Kogler et al., 2013). The first situation corresponds to voluntary tax compliance and the second to enforced tax compliance (Kogler et al., 2013).
5
Considering models based on economic theory and models of social and tax psychology for the study of tax compliance, tax authorities may apply measures based on both economic and psychosociological factors.
2.3 The tax game and the interaction between taxpayers and tax authorities
From (Pickhardt & Prinz, 2014) perspective, tax (non) compliance, as well as tax evasion, are processes in which individuals relate, directly or indirectly, to each other. The authors present the “tax game” identifying the various players: taxpayers, tax legislators (law makers), tax practitioners (accountants) and tax authorities. The authors imply that there can exist four types of subgames within the tax game. Taxpayers vs Tax Authorities – one of the subgames is considered to be the most important game, the authors highlight three aspects: power, the level of service provided and trust. The power is linked to the of an audit and detection of evidence of tax evasion / fraud and the fines imposed for such behaviour. The level of service provided refers to taxpayer assistance with regard to tax information (doubts / aid in interpreting tax law and other services available). In turn, trust, together with the two aspects mentioned earlier, is crucial for assessing the degree of cooperation between taxpayers and the tax authorities.
2.4 Paradigms on the interaction between taxpayers and tax authorities
Tax non-compliance is operationalized in two major forms: income under-declaration (e.g. sales suppression) and over-declaration of expenses (e.g. false invoices or inclusion of ineligible personal expenses, in countries where such expenses allow deductions or rebates) (OECD, 2017). These two forms of tax non-compliance are detrimental to the public accounts of any country and contribute to widening the tax gap. Reducing the tax gap by promoting tax compliance in order to ensure a fair distribution of income and tax effort becomes a preferable approach than: 1) increasing the tax burden; 2) the reduction of public expenditure and 3) the conditioning of the quality of public services and social benefits provided by the State (Devos, 2014 and Governo de Portugal, 2018). The relationship between taxpayers and tax authorities - one of the tax games identified by (Pickhardt & Prinz, 2014) - is a function of the perception of the other party's objectives and strategies (Kirchler, 2007 and Alm et al., 2010), and three paradigms are proposed to study this relationship: 1) “cops and robbers” and 2) service providers and clients and 3) trust. The first involves maximizing the utility
6
expected by taxpayers, while tax authorities will execute strategies acting as "cops" to catch the "robbers", in this scenario there is no cooperation between taxpayers and the tax authorities. The second, in turn, assumes the promotion of voluntary tax compliance and cooperation between taxpayers and the tax authorities through relationship model in which taxpayers are treated as clients, providing them with a certain level of service. There is also the suggestion of a third paradigm, that of trust (Alm et al., 2010; Alm & Torgler, 2011; Alm, 2012). Nothing precludes the coexistence of these approaches at the same time in a given tax jurisdiction, especially if we consider that there are multiple types of taxpayers.
2.4.1. Cops and Robbers
This paradigm postulates that tax authorities act as “cops” and view taxpayers as potential offenders’ "robbers" and is somehow aligned with economic deterrence models. Tax non-compliance will thus be curbed by resorting to tax audits and by the imposition of fines and penalties (Alm et al., 2010; Allingham & Sandmo, 1972; Srinivasan, 1973; Yitzhaki, 1974; Kirchler, 2007 and Diogo, 2018).
Assuming that taxpayers are rational human beings and maximize their expected utility, if taxpayers feel indicted as potential defaulters, they can in fact take that stance and lower the amount of taxes payable through recourse to tax loopholes or risk if the benefits of tax default outweigh the associated costs (Kirchler, 2007).
Tax authorities will resource to various methods in their fight against tax evasion and fraud, highlighting the audits and enforcement of the respective penalties (Kirchler, 2007). In order to carry out tax audits it is necessary to take into account that these generate administrative costs (Collins & Plumlee, 1991).
The task of promoting voluntary tax compliance is arduous due to the range of opportunities that economic globalization and e-commerce provide for tax evasion and fraud which is one of the main causes of tax non-compliance (Kirchler, 2007). Tax authorities have to ensure that taxes are received by implementing strategies and policies that impact on a country's economy through the tax compliance decisions of economic agents. The Swiss taxpayers
7
rank as second worst payers3 on the European continent, just behind Greece. Tax claims4 are cited as the main reason for late payments in Switzerland.
The management style of tax authorities is often traditional and focused on command and control, with automatic fines and penalties on non-compliant taxpayers (Kirchler, 2007). However, automatisms may create situations of overzealous or improper and inappropriate punishment (James & Alley, 2002 and Payne, 1993). In addition, (Braithwaite 2003) notes that tax authorities’ power is not always used efficiently, which ultimately affects the relationship between tax authorities and taxpayers. This is reflected in a climate of distrust and a lower willingness for voluntary tax compliance.
Ultimately, the interaction between taxpayers and tax authorities will depend on tax authorities' dominant perception of taxpayers. That is, if taxpayers are mostly perceived as potential defaulters or as potential customers, as well as the style resulting from this perception, that is, if they adopt a style of a “cop” or of a “service provider” (Kirchler, 2007). The style used by tax authorities is important, as it is this that determines the level of tax morale and voluntary tax compliance by taxpayers (Kirchler, 2007).
2.4.2. Service provider and customer
The purpose of tax collection is to ultimately achieve a fair distribution of income and wealth as well as to meet the financial needs of the State (and other public entities). (James & Alley, 2002) argue that in order to ensure the proper functioning of the tax system, tax authorities should reconsider their approach towards taxpayers, moving from a style of command and control to a style of responsive regulation. The style of responsive regulation is based in the theory of regulation. This theory implies that regulation exists for the purpose of benefiting those who are regulated5 (Stigler, 1971 and Pelzman, 1976).
3 https://www.swissinfo.ch/eng/withholding-tax_switzerland-likes-to-tax-differently-from-europe/44591156 4 Since January 1, 2019, Switzerland is the only country in Europe where employees’ taxes are not deducted
directly from their wages.
5 Aside from the unique feature that the Confederation, the cantons and the communes all levy taxes, the
Swiss tax system also sets itself apart by letting citizens decide for themselves which taxes may be levied on them. This is because the state can impose only those obligations on them – including taxes – that are provided for in the Constitution and laws, and constitutional amendments automatically have to be subject to a popular vote (mandatory referendum) at both the federal and cantonal level.
8
By reconsidering their approach style, tax authorities treat taxpayers as clients, taking their needs into account in order to promote voluntary tax compliance. In this regard tax authorities’ officials do have a pivotal role in achieving a high level of tax compliance (Kirchler, 2007 and Alm et al., 2010). The officials act as intermediary agents for tax compliance, dissuading their clients (the taxpayers) from any problems with the tax authorities. Tax authorities’ officials should have communication skills, a high level of tax literacy and consistency in advice and the application of fines and / or penalties to non-complying taxpayers (Hansford & Hasseldine, 2002). Therefore, the level of taxpayers' cooperation with the tax authorities will depend on their rules and / or regulations (Kirchler, 2007). This paradigm on the interaction between tax authorities and taxpayers aims to design a relationship based on trust, empathy and other values (e.g. communication and reputation) with a view of achieving a high level of voluntary tax compliance.
In the Swiss case, the FTA is keen to maintain close contact with its customers and sees itself as the partner of Swiss taxpayers. It takes a responsible approach to the resources of taxpayers and staff alike and seeks to minimise the administrative costs not only for taxpayers themselves but also for the staff of the FTA. The electronic processing of tax transactions has been expanded in phases to deliver shorter processing times for tax dossiers. As well as moving away from paper and conventional mail, printed and electronic forms of communication are being linked. FTA publications now have a code that gives the user direct access to the document on the FTA website (Swiss Confederation, 2017).
As the Portuguese taxpayer's standard is of voluntary compliance, the tax authorities’ focus, on simplifying compliance, supporting the compliance for those who, wishing to comply, have difficulties to comply, and to punish those who deliberately do not want to comply. To improve the relationship with taxpayers several initiatives were made, in particular in simplifying tax compliance, e.g the submission of (IRS) declarations are now made exclusively by electronic means, the scope of taxpayers to whom the “Automatic IRS” is available has also been extended, the introduction of direct debit payment mechanisms, the introduction of the first phase of the “Automatic VAT” project and also the implementation of the “E-Tax Free” (Government of Portugal, 2018).
9
In both jurisdictions the approach will then be to treat all taxpayers as clients. However, the actual success of the tax authorities or other state organizations will depend on their legitimacy (Easton, 1965; Karakus, 2017 and Robins & Kiser, 2017) and the level of procedural justice (Gobena & Dijke, 2017; Murphy, Bradford & Jackson, 2016 and Murphy, Tyler & Curtis, 2009).
Legitimacy consists in the belief that the authorities are able to abide by the rules imposed by them (French & Raven, 1959). Perception of legitimacy is important for fostering law enforcement and promoting cooperation between institutions and citizens and encouraging reporting of practices that go against the spirit of the law (Jackson et al., 2012; Karakus, 2017; Murphy & Cherney, 2012; Murphy, Tyler & Curtis, 2009; Sunshine & Tyler, 2003; Tyler, 1997, 2006; Tyler, Schulhofe & Huq, 2010).
Procedural justice means that taxpayers comply with their tax obligations even if the likelihood of being found to be non-compliant is low or very low (Murphy & Jackson, 2016). If the authorities treat citizens fairly, with dignity, respect and if they “listen” to citizens by acting neutrally in their decisions, they promote a policy of encouraging compliance (Tyler, 2006 and Murphy, 2004).
2.5 Trust
The concept of trust can be divided into two types: 1) reason-based trust (also called calculated, rational or knowledge-based trust) and 2) implicit trust (also called identification-based trust, habitual trust, social trust or affective trust). The first type of trust arises as a result of a deliberate rational decision of the trustor based on four factors: 1) objectives to be achieved; 2) degree of dependence; 3) internal factors and 4) external factors. The second type is defined as an automatic, involuntary and unconscious reaction to a stimulus (Castelfranchi & Falcone, 2010 and Gangl, Hofmann & Kirchler, 2015). These two types of trust are related, either in parallel or sequentially (Evans, 2008).
In general, evidence shows that trust in tax authorities is positively correlated with tax payments (Hammar et al., 2009; Torgler, 2003). Trust in authorities exists if taxpayers perceive authorities’ treatment as respectful, fair and transparent (Kirchler, 2007; Kirchler et al., 2008). Additional findings of (Feld & Frey 2002, 2007) show that trust in authorities and perceived treatment by tax authorities positively influences the relationship between
10
authorities and taxpayers, thus enhancing tax compliance levels. As a result, we formulate the following hypothesis:
In this regard, a study conducted in Switzerland which aimed to examine whether the relationship between tax authorities and taxpayers influenced the level of tax compliance and tax morale. Results concluded that in the cantons where citizens’ participation rights are higher, the tax authorities have a more respectful and less suspicious outlook on taxpayers who report lower incomes. Accordingly, the willingness to comply with tax authorities is related to the degree of satisfaction with public services. An intrinsic motivation to pay taxes (“tax morale”) has been advanced as a possible explanation for high rates of compliance (Torgler, 2002; Wenzel, 2003). In this scenario, citizens pay taxes out of a sense of social responsibility and respect for the law. When taxpayers are treated as trustworthy, they reciprocate by way of compliance (Feld & Frey, 2002). Similarly, attitudes towards taxation and politics can be seen as determinants of trust and perceived fairness of the tax burden and measures applied by the authorities are determinants of trust and crucial determinants of tax compliance (Kirchler, Kogler & Muehlbacher, 2014). Furthermore, when authorities display accountability, transparency and low corruption levels, taxpayers perceive them as trustworthy. Trust in tax authorities thus appears to foster tax compliance and is positively related to tax compliance (e.g., Torgler, 2003). In the SSF (Kirchler, 2007; Kirchler et al., 2008), trust stimulates a synergistic interaction climate, in which taxpayers and authorities interact in a respectful manner and taxpayers voluntary cooperate with authorities.
2.6 Power
Power can be defined as the potential and perceived ability of one party to influence another's behaviour (Gangl, Hofmann & Kirchler, 2015). The power of the tax authorities is linked, on one hand, to tax law and the funding it obtains from the state budget for the exercise of its functions and, on the other hand, to the information it provides, for example through the data it provides about defaulting tax payers (Kirchler, Hoelzl & Wahl, 2008).
There are two fundamental theories about the exercise of power: enforced power as conceived in the work of (Becker, 1968), which points to the control of citizens and their punishment as tools for shaping their behaviour towards authorities' goals and legitimate power concept based on the works of (Turner, 2005) and (Tyler, 2006), in which authorities
11
are “accepted” by citizens (through information provided, charisma, legitimacy and level of experience), arguing their advocates that is a more effective and appropriate way to influence and shape the behaviour of individuals (Gangl, Hofmann & Kirchler, 2015). These authors also point out that legitimate power and enforced power are independent, since the latter may exist without the presence of legitimate power and vice versa, just as enforced power may coexist with legitimate power (Hofmann et al, 2014). (Hofmann et al., 2014) study these two types of power, as well as their individual and joint impact on tax compliance, finding that if enforced power is applied in conjunction with legitimate power, the latter is the one that has a relevant impact on voluntary tax compliance. Furthermore, corroborating (Tyler, 2006), the authors conclude that legitimate power will have more relevance than enforced power. Based on the studies by (Kogler et al., 2013) and (Wahl et al., 2010 and Gangl, Hofmann & Kirchler 2015) also conclude that the variables power and trust are not independent in the study of tax compliance. However, they emphasize the relevance of their interaction, adding that it will depend on the types of trust and power.
2.7 The “slippery slope” framework (SSF)
The concept of slippery slope was firstly introduced by Henk Elffers at a conference in Leiden (The Netherlands), “Managing and Maintaining Tax Compliance”, in 2006 (Kirchler, Hoelzl & Wahl, 2008). The concept of the SSF assumes that tax compliance can be achieved by two means: 1) economic deterrent measures, such as tax audits and fines / penalties, and 2) fostering a trust-based relationship with providing assistance to taxpayers. promote voluntary tax compliance (Prinz et al., 2014). The first is associated with the "cops and robbers" paradigm, with greater social distance, greater (coercive) power exercised by the tax authorities, and the predominant type of tax compliance being enforced, as the taxpayer’s cooperation is achieved by threatening to apply punishment to non-compliant taxpayers. The second, the synergistic environment, is associated with the service provider and client paradigm, where there is a greater social approximation between taxpayers and tax authorities, as well as a higher level of trust between both parties, predominating voluntary tax compliance, the tax authorities exercises greater legitimate and non-enforced power, leading taxpayers to recognize the competence and role of the tax authorities by cooperating voluntarily with it (Tyler, 2006).
12
The level and type of tax compliance will depend on tax authorities’ power levels: enforced tax compliance with increasing tax authorities’ power and voluntary tax cooperation with increasing authorities trust (Kirchler, Hoelzl & Wahl., 2008). Following the reasoning, (Kirchler, Hoelzl & Wahl., 2008) assume that the impact of changing the level of one variable will depend on the level of the other variable. It is also assumed that the variables power and trust regulate each other, that is, the impact of increasing the tax authorities’ level of trust will be greater for lower levels of tax power. Similarly, the impact of increasing tax authorities’ level of power will be greater for lower trust levels. The SSF is shown in Figure I below.
Figure 1 SSF graphical representation
(Source: Kirchler, Hoelzl & Wahl, 2008)
Figure 1 may be interpreted with points A to D below:
A. The level of trust in the tax authorities is low, so is its level of power. In this scenario, taxpayers will try to maximize their expected utility by resorting to tax defaults, the level of tax compliance is therefore reduced;
B. Starting from A and if the level of trust in the tax authorities remains low, if the tax authorities increases its level of power through greater use of tax audits and severe penalties in case of non-compliance, taxpayers will have fewer viable opportunities for non-tax compliance and thus tax compliance will be of the enforced type. Point B can be related to the “cops and robbers” paradigm;
13
C. Starting from A and if the tax authorities’ power level remains low, when gradually increasing the level of trust in tax authorities, taxpayers will tend to cooperate voluntarily with tax authorities. Point C can be related to the “Service provider and customer” paradigm; D. Represents the maximum level of tax compliance that can be achieved with high levels of tax authorities’ power and trust in it.
In conclusion, the power of and trust in tax authorities will determine the type of interaction environment between tax authorities and taxpayers (Gangl et al., 2013; 2015).
2.8 Empirical Studies related to the SSF
The relationship between power and enforced compliance and between trust and voluntary cooperation and some of the previously mentioned assumptions of the SSF are partially supported by empirical tests. These assumptions received empirical support through experiments conducted with taxpayers showing that high in contrast to low legitimate power leads to a perceived service climate and voluntary cooperation (Hofmann et al. 2014). An Austrian sample of self-employed taxpayers (Kogler et al., 2011; Muehlbacher & Kirchler., 2010) showed that if taxpayers perceived that power or trust was high, tax compliance was also high. Furthermore, additional backing for tax payments being determined by both perceived power and trust in authorities is shown in a survey with citizens from Austria, the UK and the Czech Republic that assessed authorities’ power, trust in authorities, enforced and voluntary tax compliance. The survey showed that voluntary tax compliance is positively associated with trust, power, and their interaction. Trust, however, had the largest effect. Power of authorities was found to be significantly positively associated with enforced compliance (Muehlbacher et al., 2011). These conclusions were also confirmed for a sample of self-employed Italian taxpayers by (Kastlunger et al., 2013). Furthermore, it was found that trust is positively related to legitimate, but negatively related to enforced power. Even if legitimate power is correlated to enforced compliance, the perception of the latter led to increased tax evasion. Another survey, (Kogler et al., 2015) also confirmed trust as being the driver of voluntary compliance and power as the main driver of enforced compliance. The authors identified social norms, an additional influencing factor for tax compliance, which, however, was not mediated by trust or power. The SSF assumptions were also tested in the context of fare avoidance through a sample of Austrian
14
users of public transport which stated their perception towards power, trust and degree of enforced compliance or voluntary cooperation in regard to the respective public transportation company (Wahl et al., 2011). The results indicated that perceived power was correlated with enforced compliance and that trust was correlated with voluntary cooperation. Hence, in both contexts the relationship between power and enforced compliance, and between trust and voluntary cooperation in the SSF were empirically confirmed using samples from different countries. The SSF indicates that both trust and power and their relationship influence the level of tax compliance (Kirchler et al., 2008).
3 Research question and hypotheses
This research work aims to assess the perception of Portuguese and Swiss individual taxpayers in relation to various aspects of their relationship with tax authorities and the respective impact on tax evasion, as well as to ascertain whether there are statistically significant differences in the scope of sociodemographic variables as well as religion. It is important to note that there are several relationships that can be tested, tax evasion (1), voluntary tax compliance (2) enforced tax compliance (3), our dependent variables. Variables (2) and (3) may also be considered as independent variables in relation to variable (1). The independent variables in this work will be the dimensions defined for the study of the interaction between taxpayers and tax authorities (voluntary tax compliance, enforced tax compliance, trust; legitimate power; coercive power; power and legitimacy).
Next, the primary research question and respective hypotheses is presented, according to the objective of this research work.
– What are the determinant dimensions in tax evasion? As a result, we formulate the following hypotheses:
o H1: There is a relationship between taxpayers’ perception of enforced tax compliance and tax evasion;
o H2: There is a relationship between taxpayers’ perception of voluntary tax compliance and tax evasion;
15
o H4: There is a relationship between taxpayers’ perception of legitimate power of tax authorities and tax evasion;
o H5: There is a relationship between taxpayers’ perception of coercive power of tax authorities and tax evasion;
In addition to the primary question, secondary research questions, are intended to provide a better understanding of the previously mentioned primary question (McKerchar., 2003 and Devos., 2014). Thus, we considered nine control variables (sociodemographic and religion): sex, age, conjugality, religion, CFBR, tax education, type of employment relationship, degree of comfort with earned income and the usage of services of a tax agent to submit the tax return which are widely used by other authors (McKerchar., 2003; Torgler., 2007; Devos., 2014).
After defining eight dimensions and nine control variables, we will then have 72 hypotheses. For example: is there a relationship between sex and trust in tax authorities? The respective hypothesis would be: there is a relationship between sex and trust in tax authorities. Thus, the secondary research question is presented below, according to the objective of this research work.
– What control variable (s) lead to statistically significant differences in relation to the defined dimensions
4 Methodology and Data
4.1 Data collection
In this chapter we present the methodology followed, with details regarding the data collection technique, the statistical instruments chosen for the respective analysis and the testing of the defined hypotheses.
In order to test the main hypotheses, the data set was obtained through two questionnaires. The first step was to draft a questionnaire based on questions (indicators) previously elaborated and tested by other authors in other countries. The questionnaire survey is one of the data collection processes suggested by (Saunders, Lewis & Thornhill., 2009 and Sekaran & Bougie., 2010). In the present case, the questionnaire consists of closed-answer questions, taking into account that this type of question enables the coding of responses and facilitates
16
the analysis of the data obtained. The questionnaire form was derived from (Kastlunger et al 2013) study with Italian taxpayers. To ensure that all questions were properly understood by the respondents, as well as to ensure that there were no problems with the writing or the scale, the second step consisted of pre-testing the questionnaire (suggested by Sekaran & Bougie, 2010), therefore was applied to a handful of volunteers.
The questionnaire was applied to individuals tax residents in Portugal that had submitted at least one tax return in Portugal in the five previous fiscal years, the same principle was used for Switzerland. The questionnaire was made available online using the google forms platform and was shared across multiple social media platforms. The questionnaire was administered in 2019.
Participation in the study was voluntary and the participants were assured that their answers would be kept confidential. The questionnaire was translated from English into Portuguese for the Portuguese sample and used in English for the Swiss sample. In this study, nine variables of interest were measured. The participants were asked to indicate their degree of agreement with certain statements.
With the intention of achieving the proposed objectives, the questionnaire was designed taking into account the type of questions, the nature of the variables and the scales of attitudes (Hill & Hill, 2008). In view of the literature review carried out it is expected that the taxpayer's attitudes, perceptions, as well as the interaction with tax authorities, are influenced by a set of variables, the influence of which should be verified through a direct effect. Additionally, there could be an influence of sociodemographic and religion variables on the variables under study.
4.2 Target population and sample characterization
The target population for this research work is made up of single taxpayers’ that had submitted a tax return in Portugal or Switzerland for personal income at least once during the previous five years. With regard to the sample, 179 responses were collected (97 in Switzerland and 82 in Portugal). The sample include individuals aged 18 years or over, with different professions and different levels of education. In terms of characterization of the sample, about 50.3% are male and 49.7% female.
17
The majority of the respondents 141 (80.1%) affirm to have submitted a tax return by themselves while the remaining 35 (19.9%) submitted their tax return with the support of an accountant or a similar situation. Note that of the 3 respondents affirmed that they should have submitted a tax return but did not. Thus, they were excluded from the analysis.
As for age, respondents are between 18 and 64 years old, with an average age of 33 years. In terms of age groups, due to the sample size two age groups were formed one from 18 up to 32 years old and another from 33 to 64 years old. About 53.1% of respondents are aged up to 32 years; 46.9% are aged between 33 and 64 years old.
Regarding conjugality status, the largest group of respondents affirms to not live in conjugality (59.8%) while the remaining respondents (40.2%) affirms to live in conjugality. Regarding the level of education, 90.5% of the respondents affirm to have a university degree while the remaining 9.5% not. In relation to tax education, 56.4% of the respondents affirm to have a had some type of tax training while the remaining 43.6% had no tax training. In professional terms, more than 89.4% affirm to be employed while the remainder respondents affirm to be in a different situation. With regard to the current or past professional situation, most respondents work / worked for others (91.6%) with the remainder respondents worked for themselves (8.4%).
In the characterization of the sample, an important point concerns to the income of the household. However, given the reluctance of many respondents to answer questions of this nature, the question about household income has been replaced by another question about the degree of comfort provided by the income, according to the European Values Survey (EVS). In these terms, almost half of the respondents (49.7%) answered that the household income is enough for them to live. The others replied that it is possible for them to live comfortably (27.4%), that it is difficult or very difficult to live on the income they have (22.9%).
With regard to questions of a religious nature, 110 respondents (61.5%) have a current positive feeling of belonging to a religion. The remaining 69 respondents, say they didn’t feel of belonging to a religion. The respondents were further scrutinized about their religion, 30 as very religious (16.8%), 83 as somewhat religious (46.4%) and 66 as not belonging to any religion/atheists (36.8%).
18
5 Results and discussion
5.1 Descriptive analysis of the questionnaire and the creation of dimensions
This chapter aims to analyse and discuss results. It integrates a descriptive analysis of the administered questionnaires (composed of a set of indicators, organized by sections linked to the variables under study). The indicators, components of each dimension, will be those that maximize Cronbach's alpha. In order to highlight the robustness of the analysis - taking into account both the sample size and the thematic nature of the present research work - we will not consider dimensions whose Cronbach's alpha is less than 0.60 [value suggested by Marôco & Garcia -Marques (2006), Stephenson (2010) and Silva (2015)]. For, if this happened, the dimension's validity would be questioned (Marôco & Garcia-Marques, 2006). The constituent indicators for dimension mentioned in “5.2” is subject to a five-point Likert scale, where 1 = highly unlikely and 5 = very likely, while from “5.3 to 5.9” 1 = Strongly disagree and 5 = Strongly agree.
5.2 Tax Evasion
For the analysis of tax evasion, the indicators of the two administered questionnaires were measured, which are presented in the following table, with their descriptive statistics.
Table 5.1. “Tax Evasion”
Indicator N Min Max Avg SD
1
A customer paid in cash and did not require an invoice. You could intentionally omit this income on your income tax return. How likely is it that you would omit this income?
179 1 5 2.21 1.44
2
You bought some of your goods privately. You could resell those goods later to established customer and omit the profit from this sale on your income tax return. How likely would you be to omit the profit from this sale on your income tax return?
179 1 5 2.06 1.34
3
You could intentionally declare restaurant bills for meals you had with your friends as business meals. How likely would you be to declare those restaurant bills as business meals?
179 1 5 2.75 1.54
4
You have been abroad to meet relatives and to have a short meeting with one of your suppliers. Regardless of this you could declare your expenses for the hotel and for the meals you invited your relatives to, as business travel and a business meal. How likely would you be to declare your expenses as business travel or a business meal?
179 1 5 3.07 1.45
5
Recently you took part in a project in an acquaintance's company. Now you could conceal this taxable additional income on your income tax return. How likely is it that you would conceal this additional income?
179 1 5 2.77 1.54
19
As we can see from the table 5.1, from the set of 5 indicators related to people who would not declare all their income, only indicator number four (4) presents an average higher than the centre of the scale, which appears to indicate that there is a low tendency for evading taxation in both countries.
The “Tax Compliance” index was then created using the arithmetic mean of the indicators relating to the likelihood of tax avoidance (1 to 5), obtaining a Cronbach's Alpha of 0.905, considered excellent reliability (George & Mallery, 2003 and Stephenson, 2010).
The results obtained show that “Tax Evasion” presents an average lower than the centre of the scale (3), revealing a favourable tax attitude of taxpayers towards their tax obligations. In comparative terms, we will evaluate “Tax Evasion” according to several variables: country, tax return submission, gender, tax education level, conjugality, the current feeling of belonging to a religion (CFBR), age and degree of comfort with the income earned by the household. The results obtained are shown in the tables below.
Table 5.2 “Tax Evasion” – T Test
Variables Descriptive Statistics T Test
Cronbach's Alpha
Designation Groups Average Standard
Deviation Obs. x y Country Switzerland Portugal 2.42 2.75 1.14 1.34 97 82 -1.78* 0.905 Tax Return Submission Self W/support 2.39 3.40 1.16 1.24 141 35 -4.36*** Sex Female Male 2.58 2.56 1.17 1.32 89 90 0.08 Tax Education No Yes 2.75 2.43 1.14 1.30 78 101 1.76* Conjugality No Yes 2.46 2.74 1.18 1.32 107 72 -1.49 CFBR No Yes 2.95 2.34 1.32 1.14 69 110 3.18*** Age 18-32 33-64 2.51 2.64 1.31 1.17 95 84 -0.72 * p < 0,10; ** p < 0,05; *** p < 0,01
Table 5.3 “Tax Evasion” – Scheffé Test by Religion
Groups Descriptive Statistics ANOVA Test Scheffé Test
Average Standard Deviation Obs. Teste F Bartlett Very Somewhat
Very 2.64 1.25 30 3.65** 3.31 - - Somewhat 2.32 1.10 83 -0.32 - Not +Atheist 2.86 1.36 66 0.22 0.54** * p < 0,10; ** p < 0,05; *** p < 0,01
20
Table 5.4 “Tax Evasion” – Scheffé Test by Degree of comfort with the income
Groups Descriptive Statistics ANOVA Test Scheffé Test
Average Standard Deviation Obs. Teste F Bartlett Confortable Ok
Confortable 2.27 1.13 49 7.89*** 0.97 - - Ok 2.45 1.26 89 0.18 - Dif or V.Dif 3.21 1.14 41 0.94*** 0.76*** * p < 0,10; ** p < 0,05; *** p < 0,01
The results shown through tables 5.1-5.4, that “Tax Evasion” is higher in Portugal than in Switzerland. In relation to the other variables, “Tax Evasion” is higher among those who do not submit a tax return by themselves, the female gender, do not have tax training, those who live in conjugality, those who are not religious and those who have more than 32 years old. There is a statistically significant difference in the variable tax return submissions and religion. Note that in the Scheffé test by religion, the hypothesis of inequality of variances is rejected for a significance level of 0.01.
5.3 Enforced Tax Compliance
For the analysis of tax compliance, the indicators of the two administered questionnaires were measured, which are presented in the following table, with their descriptive statistics.
Table 5.5 “Enforced Tax Compliance”
Indicator N Min Max Avg SD
1 When I pay my taxes as required by the regulations, I do
so because a great many tax audits are carried out. 179 1 5 3.48 1.27
2 When I pay my taxes as required by the regulations, I do
so because the tax office often carries out audits. 179 1 5 3.45 1.29
3
When I pay my taxes as required by the regulations, I do so because I know that I
will be audited.
179 1 5 2.88 1.30
4
When I pay my taxes as required by the regulations, I do so because the punishments for tax evasion are very severe.
179 1 5 3.89 1.17
5
When I pay my taxes as required by the regulations, I do so because I do not know exactly how to evade taxes without attracting attention.
179 1 5 3.13 1.47
Enforced Tax Compliance 179 1 5 3.37 1.04
The data in table 5.5 allows us to conclude that, on average, the enforced tax compliance is higher than the centre of the scale. When we take a closer look at the individual indicators, we can see that indicator number four “When I pay my taxes as required by the regulations, I do so because the punishments for tax evasion are very severe.” presents the higher average in both countries, which indicates that the severity of the punishments from tax authorities in case of tax noncompliance seems to be the strongest factor for enforcing tax compliance.
21
As with the other subsections of the questionnaire previously analysed, a new dimension was created - “Enforced Tax Compliance”. The dimension in question was calculated based on the arithmetic mean of the five indicators present in table 5.5, whose Cronbach's alpha is 0.857, indicating an excellent reliability. The results are listed in the bottom row of table 5.6. From its analysis we can conclude that this dimension presents an average above the centre of the scale for Switzerland and at the centre for Portugal, revealing a high degree of enforced tax compliance in the Swiss case and average degree of tax compliance in the Portuguese case.
Table 5.6 “Enforced Tax Compliance” – T Test
Variables Descriptive Statistics T Test
Cronbach's Alpha
Designation Groups Average Standard
Deviation Obs. x y Country Switzerland Portugal 3.68 3.00 0.89 1.09 97 82 4.50*** 0.857 Tax Return Submissions Self W/support 3.27 3.69 1.07 0.88 141 35 -2.43** Sex Female Male 3.29 3.44 1.01 1.07 89 90 -1.01 Tax Education No Yes 3.50 3.26 0.90 1.13 78 101 1.59 Conjugality No Yes 3.20 3.61 1.03 1.01 107 72 -2.61** CFBR No Yes 3.12 3.52 1.14 0.94 69 110 -2.49** Age 18-32 33-64 3.24 3.50 1.00 1.07 95 84 -1.68* * p < 0,10; ** p < 0,05; *** p < 0,01
Table 5.7 “Enforced Tax Compliance” – Scheffé Test by Religion
Groups Descriptive Statistics ANOVA Test Scheffé Test
Average Standard Deviation Obs. Teste F Bartlett Very Somewhat
Very 3.75 0.93 30 7.21*** 7.39** - - Somewhat 3.51 0.87 83 -0.24 - Not +Atheist 3.01 1.18 66 -0.74*** 0.50** * p < 0,10; ** p < 0,05; *** p < 0,01
Table 5.8 “Enforced Tax Compliance” – Scheffé Test by Degree of comfort with the income
Groups Descriptive Statistics ANOVA Test Scheffé Test
Average Standard Deviation Obs. Teste F Bartlett Comfortable Ok
Confortable 3.27 1.13 49 1.04 2.70 - - Ok 3.33 1.05 89 0.06 - Dif or V.Dif 3.57 0.88 41 0.30 0.24 * p < 0,10; ** p < 0,05; *** p < 0,01
The results shown through tables 5.5-5.8, that “enforced tax compliance” is higher in Switzerland than in Portugal. In relation to the other variables, “Enforced Tax Compliance”
22
is higher among those who do not submit a tax return by themselves, the male sex, do not have tax training, those who live in conjugality, those who are religious and those who have more than 32 years old. There is a statistically significant difference in the variable country. Note that in the Scheffé test by religion, the hypothesis of inequality of variances is rejected for a significance level of 0.01.
5.4 Voluntary Tax Compliance
For the analysis of Voluntary tax compliance, the indicators of the two administered questionnaires were measured, which are presented in the following table, with their descriptive statistics.
Table 5.9 “Voluntary Tax Compliance”
Indicator N Min Max Avg SD
1 When I pay my taxes as required by the regulations, I do so
because, to me, it's obvious that this is what you do. 179 1 5 3.80 1.23
2 When I pay my taxes as required by the regulations, I do so to
support the state and other citizens. 179 1 5 3.81 1.24
3 When I pay my taxes as required by the regulations, I do so
because I like to contribute to everyone's good. 179 1 5 3.64 1.27
4 When I pay my taxes as required by the regulations, I do so because, for me, it's the natural thing to do. 179 1 5 4.15 1.13
5 When I pay my taxes as required by the regulations, I do so
because I regard it as my duty as a citizen. 179 1 5 4.25 1.06
Voluntary Tax Compliance 1 5 3.93 1.01
The data in table 5.9 allows us to conclude that, on average, the respondents tend to cooperate with tax authorities with averages above the centre of the scale.
As with the other subsections of the questionnaire previously analysed, a new dimension was created - “Voluntary Tax Compliance”. The dimension in question was calculated based on the arithmetic mean of the five indicators present in table 5.9, whose Cronbach's alpha is 0.91, indicating an excellent reliability. The results are listed in the bottom row of table 5.9. From its analysis we can conclude that this dimension presents an average above the centre of the scale for both countries, explicitly revealing the high cooperation by taxpayers with the tax authorities.
23
Table 5.10 “Voluntary Tax Compliance” – T Test
Variables Descriptive Statistics T Test
Cronbach's Alpha
Designation Groups Average Standard
Deviation Obs. x y Country Switzerland Portugal 4.19 3.61 0.94 1.01 97 82 3.94*** 0.905 Tax Return Submissions Self W/support 3.92 3.89 1.02 1.02 141 35 0.17 Sex Female Male 3.93 3.93 1.11 0.92 89 90 -0.01 Tax Education No Yes 4.13 3.78 0.93 1.05 78 101 2.35** Conjugality No Yes 3.88 4.00 1.08 0.91 107 72 -0.83 CFBR No Yes 3.77 4.03 1.07 0.97 69 110 -1.68* Age 18-32 33-64 3.99 3.85 1.02 1.00 95 84 0.92 * p < 0,10; ** p < 0,05; *** p < 0,01
Table 5.11 “Voluntary Tax Compliance” – Scheffé Test by Religion
Groups Descriptive Statistics ANOVA Test Scheffé Test
Average Standard Deviation Obs. Teste F Bartlett Very Somewhat
Very 3.94 1.01 30 0.35 0.02 - - Somewhat 3.99 1.01 83 0.05 - Not +Atheist 3.85 1.03 66 -0.09 -0.14 * p < 0,10; ** p < 0,05; *** p < 0,01
Table 5.12 “Voluntary Tax Compliance” – Scheffé Test by Degree of comfort with the income
Groups Descriptive Statistics ANOVA Test Scheffé Test
Average Standard Deviation Obs. Teste F Bartlett Comfortable Ok
Confortable 4.09 0.94 49 14.97*** 18.43*** - - Ok 4.16 0.74 89 0.07 - Dif or V.Dif 3.22 1.28 41 -0.87*** -0.94*** * p < 0,10; ** p < 0,05; *** p < 0,01
The results shown through tables 5.9-5.12, that “voluntary tax compliance” is higher in Switzerland than in Portugal. Swiss taxpayers have an especially high voluntary tax cooperation (4.19) while Portuguese Taxpayers have a slightly lower value (3.61). In relation to the other variables, “voluntary Tax Compliance” is higher among those who do submit a tax return by themselves, do not have tax training, those who live in conjugality, those who are religious and those who have less than 33 years old. There is a statistically significant difference in the variable country.
5.5 Trust
For the analysis of trust, the indicators of the two administered questionnaires were measured, which are presented in the following table, with their descriptive statistics.
24
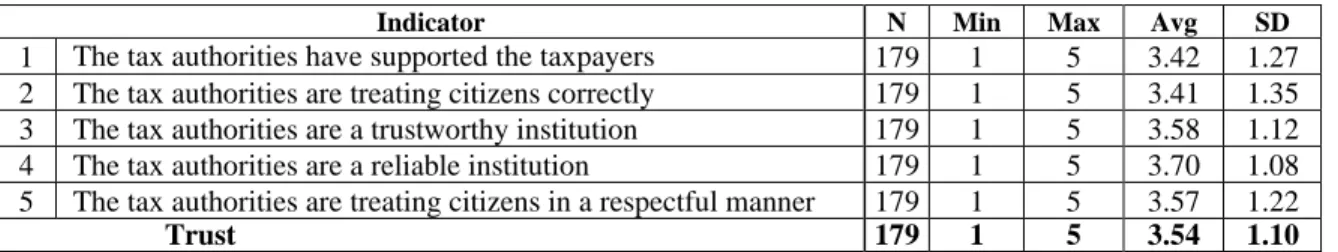
Table 5.13 “Trust”
Indicator N Min Max Avg SD
1 The tax authorities have supported the taxpayers 179 1 5 3.42 1.27
2 The tax authorities are treating citizens correctly 179 1 5 3.41 1.35
3 The tax authorities are a trustworthy institution 179 1 5 3.58 1.12
4 The tax authorities are a reliable institution 179 1 5 3.70 1.08
5 The tax authorities are treating citizens in a respectful manner 179 1 5 3.57 1.22
Trust 179 1 5 3.54 1.10
The results obtained in the table above related to the trust in tax authorities show that the respondents, on average, have trust in TA. The fourth dimension “Trust” was created, based on the eleven indicators analysed in table above. With the aggregation of these indicators, through their arithmetic mean, a Cronbach's alpha of 0.946 was obtained, considered as excellent (Marôco & Garcia-Marques, 2006 and Stephenson, 2010). The results linked to the descriptive statistics are presented in the last line of table 5.13 The “Trust” dimension is evaluated, in comparative terms, through the various variables, the results of which are presented below.
Table 5.14 “Trust” – T Test
Variables Descriptive Statistics T Test
Cronbach's Alpha
Designation Groups Average Standard
Deviation Obs. x y Country Switzerland Portugal 4.20 2.75 0.63 1.01 97 82 11.22*** 0.946 Tax Return Submissions Self W/support 3.45 3.79 1.11 0.99 141 35 -1.81* Sex Female Male 3.47 3.60 1.03 1.16 89 90 -0.77 Tax Education No Yes 3.75 3.37 0.94 1.19 78 101 2.42** Conjugality No Yes 3.34 3.83 1.06 1.09 107 72 -3.01*** CFBR No Yes 3.23 3.73 1.26 0.94 69 110 -2.85*** Age 18-32 33-64 3.38 3.72 1.14 1.03 95 84 -2.09** * p < 0,10; ** p < 0,05; *** p < 0,01
Table 5.15 “Trust” – Scheffé Test by Religion
Groups Descriptive Statistics ANOVA Test Scheffé Test
Average Standard Deviation Obs. Teste F Bartlett Very Somewhat
Very 3.41 1.10 30 3.97** 8.16** - - Somewhat 3.78 0.90 83 0.37 - Not +Atheist 3.29 1.26 66 -0.11 -0.49** * p < 0,10; ** p < 0,05; *** p < 0,01
25
Table 5.16 “Trust” – Scheffé Test by Degree of comfort with the income
Groups Descriptive Statistics ANOVA Test Scheffé Test
Average Standard Deviation Obs. Teste F Bartlett Comfortable Ok
Confortable 3.69 1.21 49 2.39* 4.80* - - Ok 3.60 0.95 89 -0.09 - Dif or V.Dif 3.22 1.21 41 -0.47 -0.42 * p < 0,10; ** p < 0,05; *** p < 0,01
The results shown through tables 5.13-5.16, that “trust” is higher in Switzerland than in Portugal. In relation to the other variables, “trust” is higher among those who do submit a tax return with support, the male sex, do not have tax training, those who live in conjugality, those who are religious and those who have more than 32 years old. There are statistically significant differences in the variable’s country, conjugality and religion. Note that in the Scheffé test by religion and Degree of comfort with the income, the hypothesis of inequality of variances is rejected for a significance level of 0.01.
5.6 Legitimate Power
For the analysis of legitimate power, the indicators of the two administered questionnaires were measured, which are presented in the following table, with their descriptive statistics.
Table 5.17 “Legitimate Power”
Indicator N Min Max Avg SD
1 Tax Evasion is detected in a high percentage of the cases 179 1 5 2.70 1.05
2 Tax authorities combat tax crimes in an efficient way 179 1 5 2.92 1.08
3 Tax evasion is likely to be detected 179 1 5 3.19 0.90
4 Tax authorities control frequently and profoundly 179 1 5 3.23 1.05
5 Due to their knowledge and competence, tax authorities are able to
detect every act of tax evasion 179 1 5 2.38 1.17
Legitimate Power 179 1 5 2.88 0.76
The data in table 5.17 allows us to conclude that, on average, the respondents perceive that the tax authorities legitimate power is moderately low. However, indicator number 4 presents an average value of 3.23 which appears to indicate that taxpayers admit that tax authorities control frequently and profoundly.
As with the other subsections of the questionnaire previously analysed, a new dimension was created “Legitimate Power. The dimension in question was calculated based on the arithmetic mean of the five indicators present in table 5.17, whose Cronbach's alpha is 0.769, indicating an acceptable reliability. The results are listed in the bottom row of table 5.18. From its analysis we can conclude that this dimension presents an average above the centre of the
26
scale for Switzerland, while for Portugal it indicates an average below the centre of the scale, explicitly revealing the low perception by Portuguese taxpayers on tax authorities’ “Legitimate Power”.
Table 5.18 “Legitimate Power” – T Test
Variables Descriptive Statistics T Test
Cronbach's Alpha
Designation Groups Average Standard
Deviation Obs. x y Country Switzerland Portugal 3.05 2.69 0.75 0.73 97 82 3.19*** 0.769 Tax Return Submissions Self W/support 2.85 2.98 0.78 0.68 141 35 -0.98 Sex Female Male 2.69 3.08 0.76 0.71 89 90 -3.51*** Tax Education No Yes 2.94 2.84 0.68 0.81 78 101 0.95 Conjugality No Yes 2.72 3.12 0.73 0.74 107 72 -3.55*** CFBR No Yes 2.86 2.90 0.82 0.72 69 110 -0.39 Age 18-32 33-64 2.88 2.89 0.71 0.81 95 84 -0.07 * p < 0,10; ** p < 0,05; *** p < 0,01
Table 5.19 “Legitimate Power” – Scheffé Test by Religion
Groups Descriptive Statistics ANOVA Test Scheffé Test
Average Standard Deviation Obs. Teste F Bartlett Very Somewhat
Very 2.93 0.72 30 0.16 0.22 - - Somewhat 2.90 0.77 83 -0.03 - Not +Atheist 2.85 0.77 66 -0.08 -0.05 * p < 0,10; ** p < 0,05; *** p < 0,01
Table 5.20 “Legitimate Power” – Scheffé Test by Degree of comfort with the income
Groups Descriptive Statistics ANOVA Test Scheffé Test
Average Standard Deviation Obs. Teste F Bartlett Comfortable Ok
Confortable 3.14 0.77 49 5.32*** 0.21 - - Ok 2.85 0.73 89 -0.29* - Dif or V.Dif 2.64 0.74 41 -0.50*** -0.21 * p < 0,10; ** p < 0,05; *** p < 0,01
The results shown through tables 5.17-5.20, that “Legitimate Power” is higher in Switzerland than in Portugal. In relation to the other variables, “Legitimate Power” is higher among those who do submit a tax return with support, the male sex, do not have tax training, those who live in conjugality, those who are religious and those who have more than 32 years old. There are statistically significant differences in the variable’s country, sex and conjugality.