A Work Project, presented as part of the requirements for the Award of a Masters Degree in Economics from the NOVA – School of Business and Economics.
Competition Policy Costs to Firms
André Demmich Barbosa Agostinho Student number - 438
A Project carried out on Applied Policy Analysis, under the supervision of: Professor Pedro Pita Barros
1
Abstract
The existence of competition policy forces companies to adjust their behaviour. This is also costly. Using a database from a company on contracts, I will try to estimate if a specific competition policy disposition, supply contracts cannot be longer than 60 months, has costs for the coffee suppliers operating in the Portuguese “on-trade” coffee market. The estimation method used in this paper will be OLS. The results suggest that limiting the duration of exclusivity contracts to 60 months can be harmful to the coffee suppliers and it can even seriously affect the market functioning.
Key words: Vertical restraints, exclusive contracts, specific investments, competition policy
2
1. Introduction
According to the International Coffee Organization (ICO) the Portuguese market for roasted coffee was worth about two billion Euros in 2009. Although the country is not among the largest consumers of coffee in Europe, according to the “Associação Industrial e Comercial do Café” (AICC), 80% of the Portuguese population drinks coffee, showing that coffee is a very popular drink in Portugal. Looking at the structure of the sector, another study, the Kantar WorldPanel, indicates that in 2009 the coffee sector was mainly controlled by the coffee manufacturer brands in the coffee sector, representing 77% of the total quantity sold in that year. The remaining 23% belong to distribution brands. Also, contrary to what happens in most countries in Europe, still 78% of the coffee consumption happened outside home at the sale point and only 22% at home, being this feature transverse to the whole population and constant throughout the week. This is why despite of the rise of new forms of consuming coffee, the coffee suppliers still invest strongly in the HORECA channel (hotels, restaurants and coffee shops). In Portugal the number of establishments (retailers) operating in this channel is huge, around 84000, which, as a rule, sell only one coffee brand, either due to a voluntary decision or due to the existence of exclusivity contracts.
In 2006 the Portuguese Competition Authority (CA) has decided to condemn and fine one major coffee supplier operating in the Portuguese coffee market for signing exclusivity contracts with their retailers that did not impose a limit for the duration of the vertical restraint. This practise is forbidden and punished by the Portuguese competition law, where, in general, exclusive dealing/contracts are only allowed when the market share of the companies does not overcome 30% and the duration1 of these
1 The exclusivity contracts might last longer than 60 months when renewal beyond this limit has the approval of both parties
3
contracts is limited to 60 months or less. Thus, the CA concluded that the exclusivity contracts investigated were restricting the competition in at least part of the national coffee market and were therefore illegal. However, from the economic literature we know that the use of vertical restraints, like exclusivity contracts, especially in the presence specific investments, in business relationships between upstream and downstream firms can create positive externalities that increase both the producer (the coffee supplier) and the consumer (the retailer) welfare.
The central goal of the present paper is to show whether the decision of the CA to limit the duration of the exclusivity contracts between coffee suppliers and retailers to 60 months does disturb the correct functioning of the Portuguese “on-trade” coffee market, whether the Portuguese coffee sector is being penalized by a too strict competition law, which may actually undervalue the positive externalities created by the existence of exclusivity contracts between coffee suppliers and retailers harming the competition, increasing the costs for the firms operating in the coffee market and eventually decrease the consumers’ wellbeing. The organization of this paper is the following: Section 2 presents a literature review, followed by a description of the Portuguese “on-trade” coffee market in Section 3. Then, in Section 4 I use data provided by one coffee supplier about the “on-trade” coffee market to retrieve some testable hypotheses about which variables could influence the duration of the exclusivity contracts. In Section 5, I will test these hypotheses and discover which variables might in fact influence the duration of an exclusivity contract. I will then test whether the legal imposition of limiting the duration of these contracts to 60 months may increase costs to firms and even decrease the social welfare. Finally in Section 6 I will conclude by reviewing the basic insights, while focusing on possible limitations and further improvements to the analysis.
4
2. Literature review
In the economic literature about vertical restraints, contractual transactions are often not distinguished by the authors from spot-market interactions, leading to empirical analyses and conclusions that do not consider the use or effects of specific contract clauses. However there are some exceptions. In fact the literature presents three theories that are normally used for the study of contractual restrictions. The first one is transaction cost economics (TCE), where the work of Oliver Williamson has played a major role in the study of contractual clauses that restrict one or both parties in a transaction. The second theory used to address this type of problems is the property rights theory. The TCE traditionally has emphasized the governance of contractual relationships ex post (Williamson, 2002), whereas the assumption of costless bargaining in most of the property rights literature has meant that the action occurs ex ante at the incentive alignment stage (Whinston, 2003). Finally the last theory used is the agency theory (Lafontaine and Slade, 2009, 2010). In several empirical studies the TCE has helped explain some aspects of contractual agreements, such as contract duration by predicting that the choice of contract terms is influenced by uncertainty, complexity, and specificity (Joskow, 1985, 1987; Crocker and Masten, 1988). Williamson (2002) states that: “transactions, which differ in their attributes, are aligned with governance structures, which differ in their cost and competencies, in an economizing way.” Thus, an important contribution of TCE is that firms’ choices of how to organize their transactions are usually based on efficiency enhancing rather than market-power strengthening considerations, unless they occur in concentrated markets with strong entry barriers (tight oligopolies or dominant firms) (Williamson, 1979). TCE implies that contracts will be longer when firms have more specific investments at stake, since
5
the need to protect those investments is greater. They will be shorter, in contrast, when environments are more uncertain, since flexibility assumes greater importance in that case. Lyons (2002) finds evidence that firms can support specific investments through the establishment of partnership agreements, by agreeing to work together in the future, or by preferred supplier agreements. However, both imply longer-term relationships. This supports again Williamson’s notion of contracting with safeguards, as discussed in his 1985 article: “The protective safeguards to which I refer normally take on one or more of three forms. The first is to realign incentives, which commonly involves some type of severance payment or penalty for premature termination. A second is to create and employ a specialized governance structure for referring and resolving disputes. The use of arbitration, rather than litigation in the courts, is thus characteristic [….]. A third is to introduce trading regularities which support and signal continuity intentions.” In modern economies, a very large fraction of retail sales are subject to some form of exclusive dealing clauses. New-automobile sales dominate, however other activities, such as gasoline, fast food, beer distribution, and business services, are also important. Most of the empirical studies that have studied the effects of vertical restraints on the consumer welfare are concentrated in these activities (Lafontaine and Slade, 2005). Looking at the results of the empirical literature, they support Williamson’s argument that contractual constraints often serve legitimate economic purposes. One should not stop questioning the use of vertical restraints however one should not presume that they are harmful to consumers (Williamson, 1979). However most of these exclusive agreements can be grouped under the umbrella of franchising (Slade 2000). This is not the case of exclusive dealing in the Portuguese “on-trade” coffee market, the issue that I will address in this paper and that has not yet been handled in the literature.
6
3. The Portuguese “on-trade” coffee market - Economic theory
The Portuguese coffee sector can be divided in two distinct and independent markets: (1) The “on-trade” market and (2) the “off-trade” market2. The main characteristic of the “on-trade” coffee market that differentiates it from the “off-trade” coffee market is that, in the first one, the demand for coffee drink is normally satisfied by consuming the coffee in the place where it was sold. It includes the coffee drink sold in bars, cafeterias, restaurants and vending machines (HORECA channel). In Portugal the number of establishments operating in this market is huge, around 84000, which, as a rule, sell only one coffee brand, either due to a voluntary decision or due to the existence of exclusivity contracts.
From this section on I am only going to consider the Portuguese “on-trade” coffee market, in particular the share of the market where retailers operate under an exclusive clause. First it is important to describe and identify the characteristics of this market. This can be highlighted by a small survey held in 2006 in 25 coffee establishments in Lisbon3, where both owners and consumers were interviewed. There are immediately two characteristics that emerge: (1) All establishments sell only one brand of coffee; (2) they all present brand advertisement in diverse equipments (cups, awnings and so on). It was also verified the existence of an almost complete price uniformity, around 0,5 Euros for a cup of coffee. Moreover the set of 25 establishments were supplied by 10 different coffee brands. Thus, it seems that the price of a cup of coffee results from a competitive environment and consumers choose between the different coffee suppliers by choosing the establishment. Therefore we can argue that the existence of supply
2 Definitions used by the European Commission in similar cases.
3 The survey has been done in the zone de S. Sebastião da Pedreira in Lisbon. The establishments had to be located in the same geographical area, within a radius of 1 km/15 minutes walking distance between the two establishments further apart. Some of the establishments are located on the same street.
7
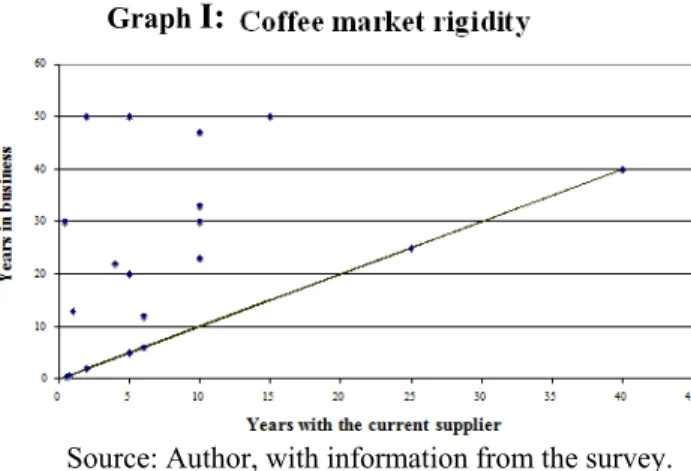
exclusivity, either voluntary, or by contract, does not prevent the final consumers from having a vast choice of consumption options. Also interesting is the fact that 6 establishments were open for less than 5 years and that another 6 had a business relationship with the current coffee supplier for less than 5 years. Thus almost 50% of the establishments considered in the survey had been in the market to choose their coffee supplier in the last five years. This can hardly be considered a market where the existence of exclusivity contracts lasting more than the 60 months create entry barriers.
This figure shows the capacity of the establishments to change their coffee suppliers. Only the establishments over the line have never changed to another supplier, what is more likely to happen in more recent establishments. The next table shows the answers of the consumers to the questions in the survey.
Table I: Survey answers
Question Answer Number Can you correctly identify the coffee brand sold in this
establishment?
Yes 72
No 28
Do you have a favourite coffee brand? Yes 77 No 23
Is your favourite coffee brand sold in this establishment?
Yes 24
No 53
Indifferent 23
Why did you choose this establishment? Proximity 74
Random 11 Brand 7 Environment 6 Price 4 Other 9 Graph I:
Source: Author, with information from the survey.
8
Looking at the results of the survey, we can state that although the brands are well-known by the consumers and most of them has even a preferred one, contrary to what would be expected, the choice of the local of consumption is driven much more due to proximity and opportunity factors than due to brand and investment related factors, meaning that although being informed and having preferences, the consumers seem to treat coffee as an homogeneous good. The small importance given by the retailer and the consumer to the brand name makes the supplier have to spend more on specific investments in order to conquer the preference of the retailers. However it is important to remember that the sample used in this survey is very small and may not be representative. Nevertheless, a broader survey would have the same essential features: (1) coffee brand exclusivity, either voluntary or imposed by contract, (2) competition between retailer establishments, (3) competition between suppliers and no entry barriers, even in the presence of exclusivity contracts, due to entry of new establishments or due to changes in suppliers. The last statements can be reinforced by looking at the next graph. It shows the Company’s contract evolution, in particular the number of exclusivity contracts won and lost in 2005 and 2006, dividing them in three categories: Changed supplier, Changed owner, Closed/Opened.
0 200 400 600 800 1000 1200 1400 1600 1800
Clients lost Clients won Clients lost Clients won
Number of contracts 2005
Graph II: Contract evolution
Changed supplier Changed owner Closed/Opened 2006 59% 25% 75% 49% 45% 22% 77% 41%9
The graph shows two important features. First, behind a relatively stable global market share there are important dynamics in terms of winning and losing clients and contracts. Second, competition between suppliers is largely present, since losing and winning clients to the competition is part of the coffee market activity. Thus, although the existence of minimum quantity purchase agreements (with exclusivity clause) can reduce the margin of competition by new clients in the market, the dynamics of contract creation and termination, means that the reduction of the share of clients without exclusivity contracts does not necessarily imply a lack of contract mobility and competition in the coffee sector. Each year, a substantial number of clients will be active in the market, namely clients without a contract, new clients entering the market and clients with a contract that are available for changing supplier (almost 20% each year). Therefore it appears that there is no evidence of foreclosure in the coffee market, due to the existence of exclusivity contracts with acquisition of a minimum quantity. Now it is important to describe how and why exclusivity contracts arise and what do they imply for the market. It is important to determine if the exclusivity contracts are originated by the needs of demand (clients) or by the market power of supply (coffee suppliers). The retailers are normally contacted directly by suppliers’ representatives. However larger retailers choose their coffee suppliers through auction processes, where the potential suppliers present their contract portfolios. The contracts are based on an economic model where the key element is the requirement to purchase a minimum quantity associated to an exclusivity clause, where the contract duration is seen as a nonessential aspect, being adjustable, if necessary, until the total quantity of acquired coffee is reached. In turn, as part of the exclusivity contract, the retailers receive on the other hand specific investments done by the supplier, which may include advertisement,
10
machines, equipment, know how and technical support. These investments are sometimes crucial for the improvement of the retailers’ establishments and without them some retailers would not even enter the market4. Thus, for a proper understanding of the functioning of the market it is crucial to know the negotiating process that determines the minimum quantity. The determination of the quantity in the contract depends on several factors: i) clients have an incentive to predict future consumption levels above the actual consumption, when they feel an association between the rate of specific investments, equipment and provision of complementary services, and the amount of coffee contracted; ii) the suppliers have an interest to overvalue the demand as a way to sell more, since the commercial agents are awarded according to the sales they make. Since the quantity acquired by the clients depends on their realized consumption levels, the adjustment of the contract duration exists in both directions, either in the anticipation of the contract end if the stipulated quantity has been acquired more quickly than what was expected, either in the extension of the contract duration if the stipulated quantity is not being acquired at the expected rate. Thus, the concern underlying the use of contracts is not to hold clients during the period of time in which the contract is active, but to allow the suppliers to recover the specific investments made through the sale of the agreed quantity of coffee. The payments made by the client to the supplier should cover: i) the cost of acquired coffee for consumption; ii) the value of specific investments made by the supplier. When there is uncertainty about the quantity of coffee sold at each moment in the coffee shops, the way to ensure the return of the specific investment, is to ensure that the required quantity is in fact sold, thus allowing the contract duration to vary.
4 The specific investments help the owners of the establishments to avoid having to finance their activity through bank loans.
11
Exclusivity contracts are vertical restraints. In general these restraints are agreements between vertically related firms, which may be aimed at reducing transactions costs, guaranteeing availability and security of supply, and to solve coordination problems. Different types of vertical restraints may have different impacts on welfare depending typically on whether they are intra-brand5 or inter-brand. In the Portuguese “on-trade” coffee market both types of competition are present. Vertical restraints affecting intra-brand competition allow, in general, a better coordination of the vertical chain and do not harm competition. As to inter-brand competition, vertical restrictions may raise the costs of rivals and lead to market foreclosure.
Thus, exclusive dealing may exist due to efficiency reasons or due to anti-competitive reasons. Let’s start by pointing out important efficiency reasons for using this type of vertical restraint. Suppliers doing specific investments in their clients/retailers establishments, like improving the sale point, promoting retail products, investing in equipment or training the staff to work with the coffee machine may worry that retailers will free ride on those investments by switching to a competing coffee supplier with a higher retail profit margin. In this case the use of exclusivity contracts enables the supplier to protect its investments against potential retailer opportunism. Furthermore, in its absence, potentially profitable investments might not be undertaken. Now, on the other hand let’s point out anticompetitive reasons. Exclusive dealing can inhibit entry of new coffee suppliers in the market. This is the main worry of competition authorities in the U.S. and the E.U. when it comes to vertical restraints. If the coffee suppliers establish exclusivity contracts with most retailers in the market, they might either prevent potential competitors from gaining access to the clients, in this case the owners
12
of the establishments, at a reasonable cost, or even lead to the exit of rivals from the upstream market industry (suppliers) (see, e.g., Krattenmaker and Salop (1986), Aghion and Bolton (1987) and Comanor and Rey (2000)). As I have shown throughout this section, there seems not to be market foreclosure in the Portuguese “on-trade” coffee market. In the end, if the exclusivity contracts were used to lessen competition at some level of the vertical chain through foreclosing or disadvantaging rivals, the prices to consumers should be higher and quantities sold smaller than in the absence of such restraints and this seems not to be the case in the Portuguese “on-trade” coffee market. Limiting exclusive contracts duration in the “on-trade” coffee market to a maximum of 60 months may have a negative impact on the well-being of coffee suppliers and consumers and as such on the social welfare. In order to understand how social welfare is affected by this measure it is necessary to identify the potential effects that it has on suppliers, on points of sale (clients), on consumers and on the market competition.
13
4. Descriptive statistics
In order to see if the market functioning might be seriously affected by the time constraint imposed to the exclusive contracts duration we have to look first at some descriptive statistics from the “on-trade” coffee market. In this section I am going to look at data provided by one of the main coffee suppliers in the “on-trade” coffee market (called from now on the Company). My main focus will be the data related to business relationships were exclusivity contracts are active. Although not dominant, this supplier has a market share between 20% and 25% and is therefore a representative supplier for the whole “on-trade” coffee market. Most of the available data concerns the period between 2000 and 2004.
4.1 Global analysis:
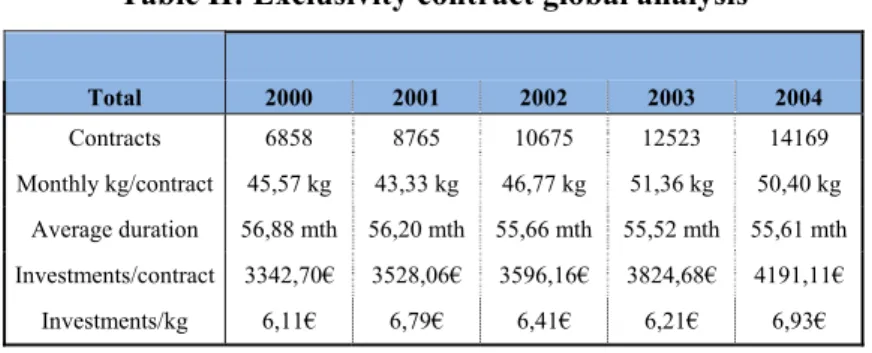
Table II: Exclusivity contract global analysis
Total 2000 2001 2002 2003 2004 Contracts 6858 8765 10675 12523 14169 Monthly kg/contract 45,57 kg 43,33 kg 46,77 kg 51,36 kg 50,40 kg Average duration 56,88 mth 56,20 mth 55,66 mth 55,52 mth 55,61 mth Investments/contract 3342,70€ 3528,06€ 3596,16€ 3824,68€ 4191,11€ Investments/kg 6,11€ 6,79€ 6,41€ 6,21€ 6,93€
According to table I, between 2000 and 2004, the number of exclusivity contracts signed by the Company has increased. In this period the number of exclusivity contracts has more than doubled, rising from only 6858 exclusivity contracts (5606 clients6) in 2000 to 14169 (10917 clients) in 2004. Since the total number of clients held by the Company was in this period almost constant, this means that the percentage of clients with exclusivity contracts has increased from 27% in 2000 to 53% in 2004. In the same period the monthly quantity of coffee acquired per contract has also increased, from
6 A client may have more than one exclusivity contract.
14
45,57 kg per contract to 50,4 kg per contract. However, the average duration of the exclusivity contracts has remained more or less constant between 55 and 56 months. It is also important to look at the behaviour of the specific investments done by the Company in the retailers’ sale points (HORECA channel). In fact, in the period under analyse the variables of investments per contract and investments per kg also increased. Between 2000 and 2004 there was a 25% increase in the suppliers investments per contract (3342,70 Euros Æ 4191,11 Euros) and a 13% increase in the suppliers investments per kilo of coffee (6,11 Euros Æ 6,93 Euros).
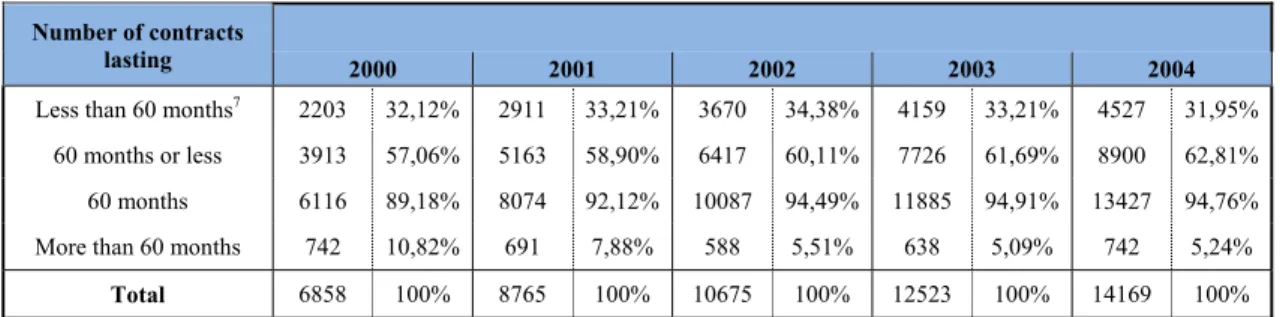
Table III: Evolution of exclusivity contract duration between 2000 and 2004
Number of contracts
lasting 2000 2001 2002 2003 2004
Less than 60 months7 2203 32,12% 2911 33,21% 3670 34,38% 4159 33,21% 4527 31,95%
60 months or less 3913 57,06% 5163 58,90% 6417 60,11% 7726 61,69% 8900 62,81% 60 months 6116 89,18% 8074 92,12% 10087 94,49% 11885 94,91% 13427 94,76% More than 60 months 742 10,82% 691 7,88% 588 5,51% 638 5,09% 742 5,24%
Total 6858 100% 8765 100% 10675 100% 12523 100% 14169 100%
In the table above, the exclusivity contracts were divided in four groups according to their duration. It is interesting to notice that most of the exclusivity contracts last exactly 60 months and that in 2004 only 5,24% of them lasted longer than 60 months, half of the value registered in 2000. Thus, looking at the table, we see that the increase in the number of contracts lasting 60 months or less is entirely responsible for the overall growth in the number of exclusivity contracts registered between 2000 and 2004.
4.2 Comparison analysis:
Now the exclusivity contracts will be grouped according to their duration. Thus, there will be two groups: (1) contracts with duration equal to 60 months or less, (2) contracts lasting longer than 60 months.
7 Between 2000 and 2004 the average duration of contracts lasting 60 months or less was almost constant over 54 months, meaning a concentration of exclusivity contracts near the 60 months duration limit.
15
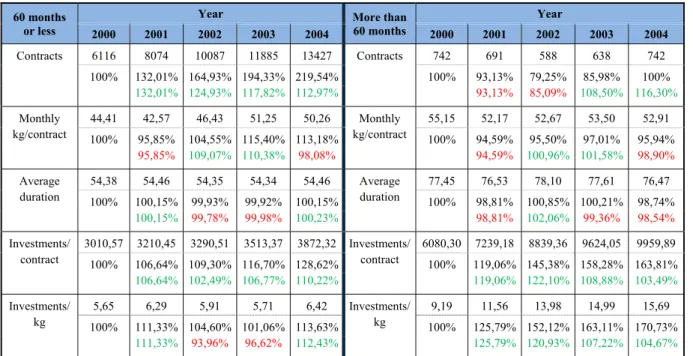
Table IV: Comparison and evolution of key variables in contracts above and under the limit
60 months or less
Year More than 60 months Year 2000 2001 2002 2003 2004 2000 2001 2002 2003 2004 Contracts 6116 8074 10087 11885 13427 Contracts 742 691 588 638 742 100% 132,01% 164,93% 194,33% 219,54% 100% 93,13% 79,25% 85,98% 100% 132,01% 124,93% 117,82% 112,97% 93,13% 85,09% 108,50% 116,30% Monthly kg/contract 44,41 42,57 46,43 51,25 50,26 Monthly kg/contract 55,15 52,17 52,67 53,50 52,91 100% 95,85% 104,55% 115,40% 113,18% 100% 94,59% 95,50% 97,01% 95,94% 95,85% 109,07% 110,38% 98,08% 94,59% 100,96% 101,58% 98,90% Average duration 54,38 54,46 54,35 54,34 54,46 Average duration 77,45 76,53 78,10 77,61 76,47 100% 100,15% 99,93% 99,92% 100,15% 100% 98,81% 100,85% 100,21% 98,74% 100,15% 99,78% 99,98% 100,23% 98,81% 102,06% 99,36% 98,54% Investments/ contract 3010,57 3210,45 3290,51 3513,37 3872,32 Investments/ contract 6080,30 7239,18 8839,36 9624,05 9959,89 100% 106,64% 109,30% 116,70% 128,62% 100% 119,06% 145,38% 158,28% 163,81% 106,64% 102,49% 106,77% 110,22% 119,06% 122,10% 108,88% 103,49% Investments/ kg 5,65 6,29 5,91 5,71 6,42 Investments/ kg 9,19 11,56 13,98 14,99 15,69 100% 111,33% 104,60% 101,06% 113,63% 100% 125,79% 152,12% 163,11% 170,73% 111,33% 93,96% 96,62% 112,43% 125,79% 120,93% 107,22% 104,67%
Looking at the table we can verify an approximation of the monthly average quantity of coffee acquired per exclusivity contract in the two groups. Between 2000 and 2004 there was an increase of 13% in the value of this variable in exclusivity contracts lasting 60 months or less. On the other hand, over the same period, this same variable decreased 4% in exclusivity contracts lasting more than 60 months. Another important variable to look at is the average duration of the exclusivity contracts that exceed 60 months. It should be noted that the value of this variable has been more or less constant over 76 months, a value significantly above the duration limit of 60 months. Finally, comparing the two groups, it is easy to observe that either the investments per contract, either the investments per kg, are significantly higher in the contracts lasting more than 60 months. Although the values of these variables in both groups have generally increased over the years, the gap between them has been increasing, since the value of the specific investments made by the supplier per contract and per kg is growing faster in contracts lasting more than 60 months. This may mean that the duration of an
16
exclusivity contract is in fact an important variable to ensure the return of the specific investments made by the supplier, since it enables him to share the investment risk with the retailer, by giving enough time for the supplier to recover the specific investment made, important when investments per contract and per kg are significant.
1st test hypothesis: The level of specific investment per contract and per kg may influence the exclusivity contract duration.
4.3 First time contracts versus not first time contracts:
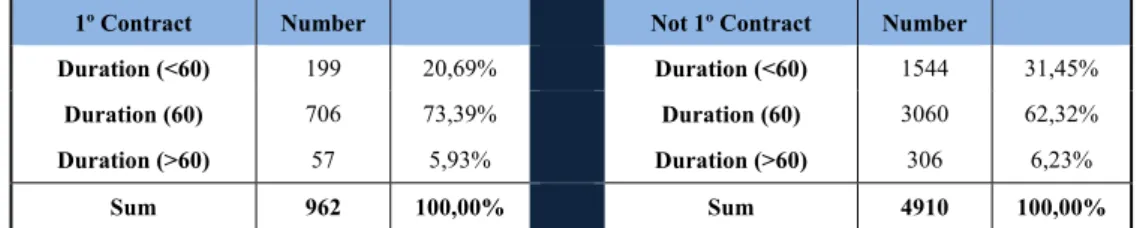
The next table shows that exclusivity contracts signed for the first time account for almost one-sixth of the total number of exclusivity contracts existing in 2004 and tend to have a higher duration. However this does not mean that a higher percentage of this type of contracts lasts more than 60 months. Indeed the percentage of exclusivity contracts signed for more than 60 months in 2004 is almost the same, around 6%, in the two groups considered in the table. But more important is the fact that almost three quarters of first time contracts are signed for a period of exactly 60 months.
Table V: Comparison of the number of exclusivity contracts distributed by duration
1º Contract Number Not 1º Contract Number
Duration (<60) 199 20,69% Duration (<60) 1544 31,45%
Duration (60) 706 73,39% Duration (60) 3060 62,32%
Duration (>60) 57 5,93% Duration (>60) 306 6,23%
Sum 962 100,00% Sum 4910 100,00%
2nd test hypothesis: Year in which exclusivity contract was sign influences its duration
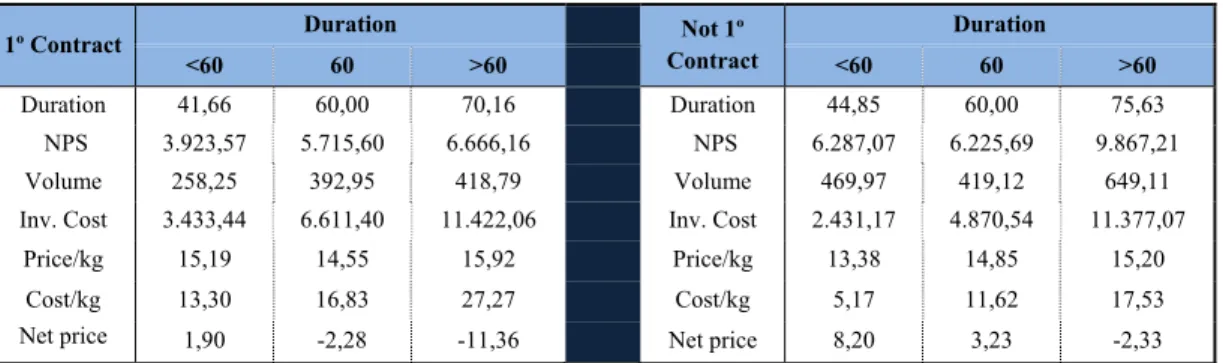
The next table shows the average value per contract of several determinant variables. Again, there is evidence that the average duration of contracts in new business relationships tend to last less, in all duration categories. Moreover, due to the high level of competition in the coffee supply market, it is interesting to verify that in 2004, the average price per kilo of coffee for retailers signing an exclusivity contract for the first
17
time was only around 10% higher if the contract duration was above 60 months compared to the case where the contract lasts 60 months (lowest value in this variable). This small price difference is, although higher, still small in contracts of older business relationships. In this case the average price per kilo differs 13,6%. However the same pattern is not verified in the average value of specific investments per kilo. In this case the average cost per kilo of coffee is proportional to the contract duration. Also, contracts sign for the first time have on average higher investment costs per kilo of coffee. This happens due to the lower quantity of coffee sold per contract and due to the higher value of the specific investments done in first time exclusivity contracts. Finally it is easy to conclude that the average net price, the financial gain of the exclusivity contract for the supplier, is much lower in contracts sign for the first time.
Table VI: Comparison of key variables in contracts above, under and on the limit
1º Contract Duration Not 1º Contract Duration <60 60 >60 <60 60 >60 Duration 41,66 60,00 70,16 Duration 44,85 60,00 75,63 NPS 3.923,57 5.715,60 6.666,16 NPS 6.287,07 6.225,69 9.867,21 Volume 258,25 392,95 418,79 Volume 469,97 419,12 649,11 Inv. Cost 3.433,44 6.611,40 11.422,06 Inv. Cost 2.431,17 4.870,54 11.377,07
Price/kg 15,19 14,55 15,92 Price/kg 13,38 14,85 15,20
Cost/kg 13,30 16,83 27,27 Cost/kg 5,17 11,62 17,53
Net price 1,90 -2,28 -11,36 Net price 8,20 3,23 -2,33
3rd test hypothesis: First time contracts may increase the exclusivity contract duration.
4.4 Specific investment analysis
The tables used in this section are in annex 1. According to the information in table XIII, more than half of the value spent by suppliers in specific investments goes to advertisement cost sharing. Also interesting is the fact that suppliers tend to borrow equipment rather than selling it (30% versus 5%), preferring in both cases the use of new equipment (29% versus 6%). When supplier and retailer are bounded by an exclusivity contract the risk of free-riding is much lower. Reinforcing this statement is
18
the fact that the third component where suppliers allocate more investment is in sale point material (13%). Looking at table XIV it is important to keep in mind that the quantity of coffee acquired is lower in exclusivity contracts signed for the first time than in older business relationships. Thus, table XIV shows that, as mentioned before, specific investments are on average significantly higher in contracts sign with new clients. Dividing the specific investment according to the exclusivity contracts duration, we see that in contracts lasting more than 60 months the investment in advertisement is much higher than in contracts with duration equal to or less than 60 months. Moreover, in new contracts, this behaviour is also true for other components of investment like borrowed equipment and sale point material. Finally it is also interesting to observe that almost all specific investment done through sold equipment by suppliers is allocated to exclusivity contracts lasting less than 60 months. This may be explained, due to the negative relation that exists between contract duration and supplier investment risk.
4th test hypothesis: The level of investment spent on advertisement and borrowed
equipment may influence the exclusivity contract duration.
5. Model
In this section I am going to construct an empirical model that allows me to: (1) test whether the four hypotheses derived from the descriptive statistical analysis done in the previous section do in fact influence the duration of an exclusivity contract; (2) see if the determinant factors and their magnitudes are different according to whether the duration of the exclusivity contract is above or below 60 months; (3) test whether limiting the exclusivity contract duration to 60 months has costs for the firms. For this purpose I will use two separate regressions, one for the first two points and another for the last one. The estimation process used in both regressions will be the ordinary least
19
square (OLS) method (Sass (2005)), being individual statistical significance tests based on robust standard deviations to allow for heteroskedasticity. All the information used to estimate the parameters has been provided by the company. The data used in the
regressions is from 2004, the last year with available information. The first regression used in
this section will be aimed at analysing which variables are relevant for determining the duration of an exclusivity contract. Thus, the regression is the following:
2
The dependent variable in this regression is the duration of the exclusivity contracts and its value is given in months. Since the estimation method used, is OLS, the estimated constant term will represent the expected arithmetic mean of the exclusivity contract duration when all other variables are equal to zero. A one unit increase in one of the explanatory variables represents a variation of months in the contract duration. The results of the regression are presented in the next table:
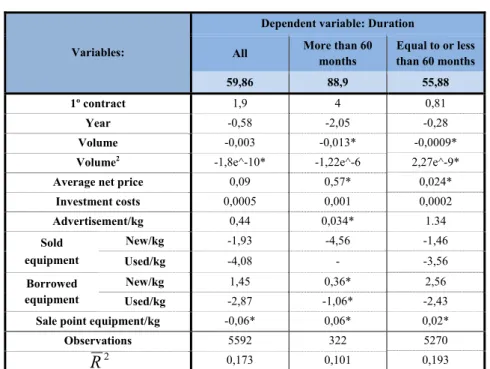
Table VII: OLS estimation results
Variables:
Dependent variable: Duration All More than 60
months Equal to or less than 60 months 59,86 88,9 55,88 1º contract 1,9 4 0,81 Year -0,58 -2,05 -0,28 Volume -0,003 -0,013* -0,0009*
Volume2 -1,8e^-10* -1,22e^-6 2,27e^-9*
Average net price 0,09 0,57* 0,024*
Investment costs 0,0005 0,001 0,0002 Advertisement/kg 0,44 0,034* 1.34 Sold equipment New/kg -1,93 -4,56 -1,46 Used/kg -4,08 - -3,56 Borrowed equipment New/kg 1,45 0,36* 2,56 Used/kg -2,87 -1,06* -2,43
Sale point equipment/kg -0,06* 0,06* 0,02*
Observations 5592 322 5270 0,173 0,101 0,193
2
R
Source: Author, based in information provided by the Company; * Parameter is not statistically significant; - Omitted because of collinearity.
20
The Goodness of fit of the regressions is low, since in all three cases the R-squared value is below 20%8. The estimated value of the constant term in all three regressions
shows what the data had already predicted in the previous section. The expected average duration of contracts lasting more than 60 months is well above the limit. The variable
"dcontract" is a dummy variable, assuming the value one when an exclusivity contract
has been signed for the first time and the value zero otherwise. It has a positive effect on the contract duration, meaning that contract signed for the first time may eventually increase the contract duration. This effect is even more important in the exclusivity contracts lasting more than 60 months. The variable "Volume" represents the minimum quantity of coffee acquired during the duration of the exclusivity contract and
"Volume2" is the square of the previous variable and is used to capture the existence of
non-linearity relations9. These variables are economically insignificant. Thus, it can be
concluded that the acquisition of a greater or lesser quantity of coffee does not have a clear influence in the determination of the duration of the exclusivity contract. The variable "Year" corresponds to the year when the contract has been signed. Having a negative effect on the contract duration means that everything else constant more recent exclusivity contracts have had a shorter duration. However, this effect is only economically significant for exclusivity contracts lasting more than 60 months. This means that over the years the duration of the contracts lasting longer has been decreasing and the duration of the contracts lasting 60 months or less has been almost constant. The variable "avgnetPrice". The variable “Invcosts” represents the specific investments done during the duration of a given exclusivity contract. Although statistically significant, its economic value is ridiculous. Thus, to capture the effect of
8 The value of R2 is interpreted as the fraction of the dependent variable explained by the regression. 9 The nonlinear transformation increases the linear relationship between the variables.
21
specific investments on the contract duration, other variables are needed, "Advertkg",
"SoldEqNewkg", "SoldEqUsedkg", "BorrowEqNewkg", "BorrowEqUsedkg", "SPEkg",
which were included in relative terms to the total minimum quantity to be acquired under the contract. In the case of advertisement per kg of coffee, there is a positive effect which is statistically significant in the samples that consider all exclusivity contracts or only contracts lasting 60 months or less. This indicates that, all else constant, the contracts with more investment in advertisement per kg of coffee tend to last longer. This is a natural effect, given that it is necessary, for the same amount of coffee sold, more time to recover the realized investment. On the other hand, an increase in the investment in sold equipment, either new or used, leads in general to a decrease in the duration of the contract. This may be explained by the increased risk involved, leading to a desire of more rapidly recover the investment made. Finally, according to the results presented in the table, the investment in sale point equipment is not statistically significant in all samples considered. Thus, it seems that the contract duration has been reduced over the last years, particularly in contracts that last longer, that the quantity sold shows no relationship with the contract duration and that the specific investments lead generally to a shorter duration, possibly capturing risk effects that are not explained by the other variables. The determinant factors and their magnitudes are different according to the duration of the exclusivity contract is above or below 60 months.
After looking at the variables that affect duration, it is time to evaluate if the policy of restricting the duration limit of exclusivity contracts bares costs to the upstream market, in this case the coffee suppliers. The first step to evaluate this impact is to discover what value has exclusivity contracts for the coffee suppliers. Since the available data does not
22
give directly that information there is the need to use proxies. The net price per Kg will be used as proxy for the contract value for the coffee suppliers. It represents the difference between the price paid by a retailer per kg of coffee and the value of specific investment received by him10. This proxy has however some limitations, since it does not capture the suppliers gains with positive externalities created by specific investments made in retailers establishments: 1) Improvement of suppliers image; 2) Service externality, which means that other retailers, with or without exclusivity contract, selling the same brand will benefit from the improvement in quality and image; 3) Security of supply (Lower risk). The suppliers can better predict the quantity of coffee they will sell in a given year. Now, we can evaluate the costs for the coffee suppliers of limiting the duration of exclusivity contracts. First let’s start the analysis by doing a price significance test:
Table VIII: Data for significance test Table IX: Price significance test
2004: Duration(≤60) (1), Duration(>60) (2) Mean net price x1 4,09 x2 -3,29
Standard deviations s1 53,41 s2 28,07
Number of contracts n1 5509 n2 363
Source: Author Source: Author
The price significance test shows that the null hypothesis is rejected, meaning that the net prices are different when the exclusivity contracts last more than 60 months. The value of the contracts for the suppliers is affected by their duration. To analyse this and other effects on the net price it is time to run a second regression:
2 60 2 2 60 60 60 2 60 60
10 The variable "avgnetPrice" represents the financial gain of an exclusivity contract for the supplier.
2004 Net price Duration(≤60) x1 4,09 -180,50% Duration(>60) x2 -3,29 s1 53,41 n1 5509 0,06 s2 28,07 n2 363
4,51 Reject the null hypotheses that average net prices are equal
23
2 60
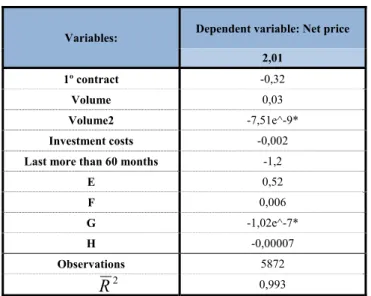
Where “netprice” is the dependent variable and stands for the net price per kg of coffee of each contract. The value of this variable is given in Euros. The estimation method is again OLS, thus the way how to interpret the parameters is the same as before. The parameters reflect the effect of each variable in the contract net price, while the parameters describe the additional effect if the contract duration is equal to 60 month. The sign of the parameters and linked to the variables and 2 will depend on the existence of quantity discounts. This means that in the presence of discounts it is expected that the parameters bound to these variables are negative, which would mean that a higher amount of coffee involved in the contract, lowers the final price. The results of the regression are observed in the next table:
Table X: OLS estimation results
Variables: Dependent variable: Net price 2,01
1º contract -0,32
Volume 0,03
Volume2 -7,51e^-9*
Investment costs -0,002
Last more than 60 months -1,2
E 0,52 F 0,006 G -1,02e^-7* H -0,00007 Observations 5872 0,993
Source: Author, based in information provided by the Company; * Parameter is not statistically significant.
The variables “dcontract”, “Volume”, “Volume2” and “InvCosts” are the same as in the first regression. The variable “ddurmore60” is also a dummy variable stating whether an exclusivity contract lasts more than 60 month (1) or not (0). The variables
“E”, “F”, “G” and “H” are the first four variables multiplied by the dummy variable
2
24
“ddurmore60”. The regression gives us some interesting results. First of all it is
interesting to notice the fact that retailers signing exclusivity contracts with the supplier for the first time have a negative impact over the net price, meaning that exclusivity contracts sign for the first time have less value for the supplier than contract relations that are renovated. This may have to do with the need to spend more in specific investments in new business relations. The next graph supports this last statement:
Graph III: Evolution of average price, cost and net price per kg of coffee
As we can see in the graph above, the average price (per kg of coffee) of exclusivity contracts does not seem to be influenced by the antiquity of the business relation. The same is not true for average costs incurred by the supplier with specific investments. The graph shows that although the average costs of the contracts have been increasing between 2001 and 2004, the amount of specific investment spend by the supplier with new clients is much higher. Thus the average net price, the value of exclusivity contracts for the supplier, is much lower in new contracts. In 2004 this value was even negative, meaning that the average cost per kilo of coffee in new contracts was higher than the average price per kilo of coffee paid by the retailers to their supplier. The next two tables show the variables needed to do a significance test and the result of that test:
‐5 0 5 10 15 20 2001 2002 2003 2004 Euros Years First vs. Not first contract 1 Cont. Avg P 1 Cont avg C 1 Cont. Avg NetP N 1 Cont. Avg P N 1 Cont. Avg C N 1 Cont. Avg NetP
25
Table XI: Information for significance test Table XII: Price significance test
2004: Not 1º Contract (1), 1º Contract (2) Mean net price x1 4,37
x2 -2,29
Standard deviations s1 47,80 s2 71,89
Number of contracts n1 4910 n2 962
Source: Author Source: Author
Thus, the price significance test shows that the null hypothesis is rejected, meaning that the net price is different (lower) in exclusivity contracts sign for the first time.
The variable Volume has to be analysed very carefully, since there could be some endogeneity between the variable Volume and InvCosts. The variable InvCosts has been calculated by dividing the investment made by the variable Volume. As expected the investment has a negative impact over the net price and the quantity contracted has a positive effect. However these variables have are economically significant, but that does not mean that there cannot be quantity discounts. We have to look at the marginal price. If it decreases when the quantity increases then there are quantity discounts. Finally the fact that exclusivity contracts have a duration that exceeds the legal limit of 60 months has a negative impact over the net price (ddurmore60 = -1,2). Also interesting is the sign of the variable that combines first time contracts that last more than 60 months. The value of the parameter is 0,52, meaning that exclusivity contracts signed for the first time and that last more than 60 months increase the value of the suppliers. These last two statements are very important, because they prove that the duration of the exclusivity contracts is determined by the needs of demand (clients/retailers), since the need for higher specific investments makes it necessary a longer period for the supplier to recover the investments made. This happens especially with new clients.
2004 Net price Not 1º contract x1 4,37 -152% 1º Contract x2 -2,29 s1 47,80 n1 4910 0,16 s2 71,89 n2 962
2,75 Reject the null hypotheses that average net prices are equal
26
6. Conclusions
After the statistical analysis done in section 4 and after the empirical analysis done in section 5, it is clear that limiting the duration of the exclusivity contracts to 60 months has costs for the coffee suppliers. As it has been shown, the number of exclusivity contracts lasting more than 60 months is small and over the years their duration and number has been declining. Thus, as it has been concluded in the previous section, the duration of the exclusivity contracts is determined by the needs of demand (clients/retailers), since the need for higher specific investments increases the necessary time for the supplier to recover the value spent on specific investments. This happens especially with new clients, which normally need more investments in advertisement and equipment. It is at this point that the importance of the minimum quantity acquisition clause plays an important role in recovering the investment made. The quantity of coffee acquired by the retailers over the period that the contract is active will depend on the level of specific investments received and on the expected demand11. Thus exclusivity contracts that exceed 60 months are contracts where the minimum quantity of coffee acquired by the retailer is either above the realized demand for coffee in the period where the exclusivity contract is active, or used to recover specific investment. With the imposition of the CA to limit the duration of the exclusivity contract to 60 months, if the clients want to continue to benefit from specific investments made by the suppliers, the suppliers would have to establish fixed quantities to be sold in each period of the exclusivity contract, so that at the end of its duration the minimum quantity specified in the contract would actually have been acquired and the investments recovered. Thus the amount of coffee purchased by the
27
retailers would have to be independent of consumption levels. This means that the clients would have to bear most of the risk and costs associated with demand fluctuations, which eventually would lead to market exit by some retailers decreasing the suppliers’ sales volume, both in value and in quantity. This would not occur if the demand uncertainty risk would be shared between suppliers and clients through the possibility of automatically extend the contracts duration beyond five years. Alternatively, if the clients are the ones to bear all the uncertainty risk of the consumption level, then they try to protect themselves from possible costs associated with over estimation. Thus they start to be more cautious regarding forecasts of expected consumption levels, leading to a decrease in the quantities of coffee sold by the suppliers. The reduction of coffee shops competing in the market decreases the number of existing contracts between suppliers and retailers, decreasing therefore also the quantity of coffee sold. Finally the suppliers brand image could also be negatively affected, since with the reduction in specific investments, the atmosphere and the service quality in the establishments would deteriorate. Limiting the contract duration to five years may also have costs for the final consumers, since they are adversely affected by the reduction of coffee shops and by the increase in the coffee price, consequence of less competition in the retail market. From the above follows that the market functioning might be seriously affected by the time constraint imposed to the exclusive contracts duration.
However, further research should be done on this issue, especially with more recent and complete databases in order to compare the market behaviour before and after the limit imposed by the CA to the duration of exclusivity contracts in the Portuguese “on-trade” coffee market.
28
References
Crocker, Keith J. & Masten, Scott E. 1988. “Mitigating Contractual Hazards: Unilateral Options and Contract Length.” RAND J. OF ECON, 19: 327;
Joskow, Paul L. 1985. “Vertical Integration and Long Term Contracts: The Case of Coal-burning Electric Generating Stations.” J. L. ECON. & ORG., 1: 33;
Joskow, Paul L. 1987. “Contract Duration and Relationship Specific Investments.” AM.
ECON. REV., 77: 168;
Lafontaine, Francine & Slade, Margaret E. “Vertical Integration and Firm Boundaries: The Evidence.” J. OF ECON. LIT., 45: 629;
Lafontaine, Francine & Slade, Margaret E. 2010. “Transaction Cost Economics and Vertical Market Restrictions: The Evidence.” ANTITRUST BULLETIN;
Lyons, Bruce R. 2002. “Are Contracts Used Strategically To Frame Renegotiation? An Empirical Study of Inter-Firm Contracts.” University of East Anglia mimeo;
Sass, Tim R. 2005. “The Competitive Effects of Exclusive Dealing: An Empirical Investigation of the Malt Beverage Industry.” INTERNATIONAL JOURNAL OF
INDUSTRIAL ORGANIZATION, 23: 203;
Slade, Margaret E. 2000. “Regulating Manufacturers and their Exclusive Retailers.” In
FOUNDATONS OF COMPETITION POLICY, ed. Morten Berg & Einar Hope;
Whinston, Michael. 2003. “On Transaction Cost Determinants of Vertical Integration.”
JOURNAL OF LAW, ECONOMICS, & ORGANIZATION, 19: 1;
Williamson, Oliver E. 1979. “Assessing Vertical Market Restrictions: Antitrust Ramifications of the Transaction Cost Approach.” UNIVERSITY OF PENNSYLVANIA
LAW REVIEW, 127: 953, 992, 993;
Williamson, Oliver E. 1983. “Credible Commitments: Using Hostages to Support Exchange.” AMERIKAN ECONOMIC REVIEW, 73: 519;
Williamson, Oliver E. 1985. “Assessing Contract.” J. L. ECON. & ORG., 1: 177;
Williamson, Oliver E. 1985. “The Economic Institutions of Capitalism.” or more recent overview: Williamson, Oliver E. 2002. “The Theory of the Firm as Governance Structure: From Choice to Contract.” JOURNAL OF ECONOMIC PERSPECTIVES, 16: 171, 186, 188, 191;
29
Annex 1: Specific investments
Table XIII: Specific investment components in total value and per contract
All Total Contract
Advertisement 14.799.996,84 2.520,44 52,59% Sold equip. (New) 1.125.492,50 191,67 4,00%
Sold equip. (Used) 183.632,31 31,27 0,65% Equip. on loan (New) 6.943.710,02 1.182,51 24,67% Equip. on loan (Used) 1.422.514,61 242,25 5,05%
MPV 3.665.576,96 624,25 13,03%
Sum 28.140.923,24 4.792,39 100,00%
Table XIV: Specific investment components in first time contracts
1º Contract Total Contract Not 1º Contract Total Contract
Advertisement 3.454.848,43 3.591,32 57,56% 23,34% Advertisement 11.345.148,41 2.310,62 51,25% 76,66% Sold equip. (New) 64.150,32 66,68 1,07% 5,70% Sold equip. (New) 1.061.342,18 216,16 4,79% 94,30% Sold equip. (Used) 12.756,73 13,26 0,21% 6,95% Sold equip. (Used) 170.875,58 34,8 0,77% 93,05% Equip. on loan (New) 1.271.202,82 1.321,42 21,18% 18,31% Equip. on loan (New) 5.672.507,20 1.155,30 25,62% 81,69% Equip. on loan (Used) 396.661,23 412,33 6,61% 27,88% Equip. on loan (Used) 1.025.853,38 208,93 4,63% 72,12%
MPV 802.342,33 834,04 13,37% 21,89% MPV 2.863.234,63 583,14 12,93% 78,11% Sum 6.001.961,86 6.239,05 100,00% 21,33% Sum 22.138.961,38 4.508,95 100,00% 78,67%
1º Contract,
Dur.(<60) Total Contract
Not 1º Contract,
Dur.(<60) Total Contract
Advertisement 247.539,06 1.243,91 36,23% 7,16% Advertisement 856.796,40 554,92 22,83% 7,55% Sold equip. (New) 61.678,02 309,94 9,03% 96,15% Sold equip. (New) 1.051.603,16 681,09 28,01% 99,08% Sold equip. (Used) 12.756,73 64,1 1,87% 100,00% Sold equip. (Used) 170.875,58 110,67 4,55% 100,00% Equip. on loan (New) 59.883,00 300,92 8,76% 4,71% Equip. on loan (New) 691.831,57 448,08 18,43% 12,20% Equip. on loan (Used) 169.802,06 853,28 24,85% 42,81% Equip. on loan (Used) 532.251,82 344,72 14,18% 51,88%
MPV 131.594,97 661,28 19,26% 16,40% MPV 450.374,46 291,69 12,00% 15,73% Sum 683.253,84 3.433,43 100,00% 11,38% Sum 3.753.732,99 2.431,17 100,00% 16,96%
1º Contract, Dur.(60) Total Contract Not 1º Contract, Dur.(60) Total Contract
Advertisement 2.752.848,13 3.899,22 58,98% 79,68% Advertisement 7.755.359,94 2.534,43 52,04% 68,36% Sold equip. (New) 0 0 0,00% 0,00% Sold equip. (New) 1.346,75 0,44 0,01% 0,13% Sold equip. (Used) 0 0 0,00% 0,00% Sold equip. (Used) 0 0 0,00% 0,00% Equip. on loan (New) 1.116.050,41 1.580,81 23,91% 87,79% Equip. on loan (New) 4.514.871,88 1.475,45 30,29% 79,59% Equip. on loan (Used) 198.077,32 280,56 4,24% 49,94% Equip. on loan (Used) 407.116,34 133,04 2,73% 39,69%
MPV 600.674,59 850,81 12,87% 74,87% MPV 2.225.150,71 727,17 14,93% 77,71% Sum 4.667.650,45 6.611,40 100,00% 77,77% Sum 14.903.845,62 4.870,53 100,00% 67,32%
1º Contract,
Dur.(>60) Total Contract
Not 1º Contract,
Dur.(>60) Total Contract
Advertisement 454.461,24 7.973,00 69,80% 13,15% Advertisement 2.732.992,07 8.931,35 78,50% 24,09% Sold equip. (New) 2.472,30 43,37 0,38% 3,85% Sold equip. (New) 8.392,27 27,43 0,24% 0,79% Sold equip. (Used) 0 0 0,00% 0,00% Sold equip. (Used) 0 0 0,00% 0,00% Equip. on loan (New) 95.269,41 1.671,39 14,63% 7,49% Equip. on loan (New) 465.803,75 1.522,23 13,38% 8,21% Equip. on loan (Used) 28.781,85 504,94 4,42% 7,26% Equip. on loan (Used) 86.485,22 282,63 2,48% 8,43%
MPV 70.072,77 1.229,35 10,76% 8,73% MPV 187.709,46 613,43 5,39% 6,56% Sum 651.057,57 11.422,05 100,00% 10,85% Sum 3.481.382,77 11.377,07 100,00% 15,73%
Source: Author, with information from the Company; Data from 2004.