TASTER RESPONSES TO ASTRINGENCY IN RED WINES
ENRICO PIGNONE
Dissertation to obtain a Master's Degree in
VITICULTURE AND ENOLOGY DOUBLE - DEGREE
Advisor: MANUEL José de Carvalho Pimenta MALFEITO FERREIRA
Assistant: MARIANA da Silva Gomes MOTA
Jury:
President: Jorge Manuel Rodrigues Ricardo da Silva (Phd), Full Professor, at Instituto Superior de Agronomia, Universidade de Lisboa.
Members: Manuel José de Carvalho Pimenta Malfeito Ferreira (Phd), Assistant Professor, with habilitation at Instituto Superior de Agronomia, Universidade de Lisboa; Sofia Cristina Gomes Catarino (Phd), Invited Assistant Professor at Instituto Superior de Agronomia, Universidade de Lisboa.
“
Live, also drink, eat well, is think and
weigh the qualities and separate
the beautiful from the ugly,
the good from the bad,
the true from the false”
ACKNOWLEDGMENTS
I want to thank all the Professors from DISAFA, University of Turin.
Professors Ricardo da Silva, Sofia Catarino and Carlos Lopes for theirteachings and assistance.
My gratitude also goes to Dona Manuela and Dona Helena and who’ve spent hourscleaning and drying thousands of glasses, and who’ve helped to prepare the tasting rooms thusallowing us to be always on schedule and to offer the best tasting conditions for our study.
A special thank goes to Professor Malfeito Ferreira, for allowing me to work with him, teach more about wine and friendly, with the special complicity of Professor Virgilio Loureiro, that gave me a new incentives and perspective about wines.
This goal is for my family!
Abstract
The present work aimed to evaluate the responses of a panel tasters to astringency in red wines. The panel was trained on the tastes of the mouth in relation to the acidity, sweetness, bitterness and in particular to astringency.
Twenty-one subjects were selected through identification of basic tastes and binary taste mixtures. Tasters were introduced first to the theory of astringency and extensively trained to differentiate astringency from bitterness and sourness using 3.0 g/L tannic acid, 0.25 g/L caffeine and 4 g/L tartaric acid to first in water then in white wine. Tasters were segmented according to gender, 6-n-propyltiouracil (PROP) status, saliva flow and Vinotype.
The tests determined the detection and recognition thresholds of commercial seed grape tannin (CT) in white wine (0.95 g/L and 1.21 g/L, respectively). These thresholds were not related with response to PROP or saliva flow.
Astringency and persistency of 5 commercial red wines showed a positive correlation (r=0.71, p<0.0001). One sample was used as control wine (WC) composed by Arinto base wine (ISA) spiked with supra-threshold concentrations of seeds commercial tannins (1.5 g/L) and tartaric acid (1.2 g/L). Significant differences were observed between the most and least astringent/persistent wines. These mouthfeel properties were not related with wine preference.
When comparing the evaluations of astringency and persistency of all wines, PROP status and Vinotype segments did not produce different responses. On the contrary, males and higher salivators gave higher ratings than females or low salivators, respectively. However, this gender or saliva flow based differences were dependent on the tasted wines.
The overall results showed that astringency is a mouthfeel sensation difficult to establish because of the different individual responses. In addition, wine preference was similar across a wide range of astringency indicates that this sensation could play a small part in wine liking when considering alone.
Key-words: Astringency, Sensorial Analysis, Taste Phenotype, Sensory Threshold, LMS (labeled
Resumo
O presente trabalho teve como objetivo avaliar as respostas de um painel de provadores à adstringência em vinhos tintos. O painel foi treinado sobre os gostos da boca em relação à acidez, doçura, amargor e em particular à adstringência.
Vinte e um indivíduos foram escolhidos, as prova incluiam gostos básico, misturas binárias e classificação de intensidade de sabor. Familiarizado em cada dez sessão de treino de uma hora, incluindo: introdução à teoria de adstringência e extensivamente treinados para diferenciar de adstringência amargura e acidez com 3,0 g/L tânico ácido, 0,25 g/L cafeína e 4 g/L ácido tartárico para localizar os diferentes estímulos (ácido, adstringentes doce, azedo e) em misturas binárias na água primeiro e depois no vinho branco. Os degustadores foram segmentados de acordo com o sexo, status de 6-n-propiltiouracil (PROP), fluxo salivar e Vinotype.
Os testes determinaram os limiares de detecção e reconhecimento de taninos comerciais de grainha de uva (CT) em vinho branco (0,95 g / L e 1,21 g / L, respectivamente). Esses limiares não foram relacionados com a resposta ao PROP ou fluxo de saliva.
Astringência e persistência de 5 vinhos tintos comerciais apresentaram correlação positiva (r = 0,71, p <0,0001). Uma amostra foi usada como vinho padrão (WC) Arinto (ISA), adicionado com concentrações supralimiares de taninos comerciais de grainha de uva (1,5 g / l) e de ácido tartárico (1,2 g / L). Observaram-se diferenças significativas entre os vinhos mais e menos adstringentes/persistentes. Estas propriedades na boca não estavam relacionadas com a preferência do vinho
Na comparação das avaliações de adstringência e persistência de todos os vinhos, o estado de PROP e os segmentos Vinotype não produziram respostas diferentes. Pelo contrário, os homens e os salivadores maior deram avaliações mais elevadas do que as mulheras ou salivadores menor, respectivamente. Estas diferenças de sexo ou de fluxo de saliva são os resultados dos vinhos provados.
Os resultados gerais mostraram que a adstringência é uma sensação difícil de determinar devido aos diferentes respostas individuais. Também, a preferência para o vinho foi semelhante dentro o diferente nevel de adstringência mostrando que essa sensação só joga uma pequena parte no gosto do vinho quando considerado isolatamente.
Palavras-chaves: Adstringência, Análise Sensorial, PROP status, BET (best estimate threshold),
Resumo Alargado
O presente trabalho pretendeu avaliar a aceitação, percepção e preferêcia por adstringência no vinho tinto, de acordo com a segmentação de consumidores em idade, género, sensibilidade gustativa e nível de experiência de consumo de vinho.
De acordo com a definição da Sociedade Americana de Testes e Materiais, adstringência refere-se ao "complexo de sensações devido ao encolhimento, desenho ou rugas do epitélio como uma resultado da exposição a substâncias como o ex-alunos ou taninos "(ASTM, 2004). A adstringência pode ser considerada como um atributo negativo pelo consumidor se vinhos foram percebidos como dura e áspera, porque o equilíbrio gustativo é deslocada para o componente tânico, mas não é fácil, também para os técnicos do vinho, distinguir com toda a sensação do vinho tinto, em particular com a amargura.
No vinho, que contém uma grande quantidade de polifenóis, o sabor de amargura é desencadeada principalmente por flavan-3-ols e seus polímeros embora também seja capaz de ser provocada por alguns flavonóides hydroxycinnamates e benzóico derivados do ácido.
Não há um vocabulário comum para definir e descrever adstringência do vinho, por causa do diferenças culturais, percepção e prazer desta sensação. Este estudo foi realizado para restringir e investigar todas as variáveis e relação entre os sujeitos, que foram escolhidos, o compete do trabalho incluíu o sabor básico e as misturas binárias e sabor de classificação de intensidade. Familiarizado em cada dez sessão de formação de uma hora, incluindo: introdução à teoria de adstringência e extensivamente treinados para diferenciar adstringência de amargura e acidez com 3,0 g / L tânico ácido, 0,25 g / L cafeína e 4g / L ácido tartárico.
Eles foram convidados a identificados os diferentes estímulos (ácido, doce, azedo e adstringente) em misturas binárias de água em primeiro lugar, em seguida, no vinho branco. Painelistas estavam familiarizados classificação com adstringência, avaliando adstringência geral de concentrações diferentes: de 0,1 a 5 g / L de CT (tanino comercial) em uma escala de 9 pontos (ausente, muito fraco, fraco, fraco a moderado, moderado, moderado forte, forte, muito forte, muito forte), primeiro em água e depois em vinho branco. Em cada sessão de cinco amostras desconhecidas (10 ml) foram apresentados em uma ordem aleatória equilibrada à temperatura ambiente em copos em forma de tulipa negra codificados com números aleatórios de 3 dígitos.
Os avaliadores foram instruídos a pour toda a amostra na boca, mantê-lo para oito segundos, expectorar e avalie a adstringência percebida geral usando uma escala de 9 pontos.
Os provadores esperaram durante 4 minutos antes de enxaguar com água deionizada por 10 segundo, duas vezes, e então esperou na menos trinta segundos antes da próxima amostra, cinco minutos para cada amostra. No início de cada sessão, os participantes provaram a selecção padrão de referência para a adstringência: 3 solução CT (0,1 muito fraco, 2,5 moderada, extremamente 5).
A formação tem permitido avaliar a BET (melhor estimativa avaliação) de todos os componentes, mostrando uma relação com o PROP. A utilização das escalas de medição suprathreshold pode aumentar a probabilidade de detectar diferenças nestes sensações induzidas por vinhos tintos em indivíduos de diferentes grupos provador PROP, reavaliados pelo tendo os participantes avaliar a amargura PROP três soluções (0032, 0:32, e 3,2 mm) que foram provadas por ordem de concentração. Os participantes receberam 20 ml de solução e instruído para mover a amostra de lado a lado na boca durante 5-10 s e depois para expectorar. Depois de esperar por 10-15 s, eles usaram o LMS para avaliar a amargura da amostra. Posteriormente, foi registada am quantidade de saliva para cada um dos provadores, a fim de comparar com o parâmetro os resultados obtidos anteriormente
Em fim usando o LMS (labeled magnitude scale), foram convidados para avaliar o nivel de adstringência, persistência e preferência na prova de seis vinhos comercial de cinco região diferente de Portugal, expressões de diferentes terroirs e estilos de vinho.
Após as provas, foram realizados testes estatísticos aos dados, nomeadamente análises de variância a cada fator para cada concentração de CT (tanino comercial). Os resultados foram tratados de acordo com uma análise à sua variância.
Relativamente ao Gender e saliva flow houve uma directa significatividade intra os non-taster, taster e supertasters, de acordo com uma melhor sensibilidade em funcao do flusso de saliva. O BET mostrou diferenças significativas na concentração de 0,4 mg/L CT (tanino comercial).
Index
List of Figures………..……….………...10 List of Tables………..……….………...12 List of Annex……….……….………...…….13 List of Abbreviation………...……….….……….…14 Introduction………..…………...……....15 1.1. Sensory analysis...151.1.1. From the numbers to the emotions….…..………..………..16
1.2. Astringency………….…….……….…………..17
1.2.1. Tannins…….……..………...……….…….……….17
1.3. Mechanism of perception………..………...……….…….19
1.4. Aims of the study……...………...…...…….……….………..21
2. Material and Methods……….………..…....22
2.1. Taster selection…………..………...22
2.1.1. Training session………..…………...……….……….22
2.1.2. Selected panel………..…………..….……….24
2.1.3. Sensory astringency session……..…………...………..24
2.2. Taster characterization……….………..25
2.3. Detection and Recognition best estimate thresholds….………..….…...………25
2.4. Determination of astringency, persistency and preference……...………..26
2.4.1. Scale utilization………..……….….26
2.4.2. Wines……….…...………..………27
2.5. Statistical analysis……….……… 27
3. Results and discussion……….…….………..………..28
3.1. Taster function…...……….………….…28
3.2. Sensory thresholds of commercial grape seed tannin……….………...…………..29
3.3. Relation among the taste functions……….…………..………32
3.3.1. Relation between PROP response and Saliva flow…..……….………….……32
3.3.2. Relation between detection and recognition threshold………..…………..…33
3.4. Evaluation of astringency, persistency and preference in commercial red wine.33
3.5. Taster responses according to segmentation………...……...……….35
3.5.1. PROP status………….………...……….35
3.5.2. Vinotype……….…...…...……...…………...……….36
3.5.3. Saliva flow .….…..………..……….…37
3.5.4. Gender………..……….…38
3.6. Wine evaluation according to segmentation……….………..…………..39
3.6.1. Saliva flow………..………..………39
3.6.2. Gender………..……….39
4. Discussion………..……….………..…………..40
5. Conclusion and future prospects…...………...…………...41
REFERENCES...………..…..……….………...……..42
WEB SOURCES.………...………...……47
LIST OF FIGURES
Figure 1.1. Structure of phloroglucinol (a), the phlorotannin unit and a tetrameric phlorotannin (b) consisting of four phloroglucinol units……….18 Figure 1.2. Common monomeric units of condensed tannins……….………...18 Figure 1.3. Mechanism of astringency perception (from Ma, W., et al., 2014)...……….……20 Figure 3.2. Geometric trend of Detection Threshold of Commercial Tannin. Number of tasters (♦) able to detect the respective added sample at each concentration. Dotted line (n = 12) represents minimum agreeing judgments necessary to establish preference using α=0.05 for triangular comparison tests (total number of tasters N=21)………....….…30 Figure 3.3. Geometric trend of Detection Threshold of Commercial Tannin. Number of tasters (♦) able to detect the respective added sample at each concentration. Dotted line (n = 12) represents minimum agreeing judgments necessary to establish preference using α=0.05 for triangular comparison tests (total number of tasters N=21)……….31 Figure 3.4 Geometric trend of Detection Threshold of Commercial Tannin. Number of tasters (♦) able to detect the respective added sample at each concentration. Dotted line (n = 12) represents minimum agreeing judgments necessary to establish preference using α=0.05 for triangular comparison tests (total number of tasters N=21)………....…….31
Figure 3.5. Geometric trend of Detection Threshold of Commercial Tannin. Number of tasters (♦) able to detect the respective added sample at each concentration. Dotted line (n = 12) represents minimum agreeing judgments necessary to establish preference using α=0.05 for triangular comparison tests (total number of tasters N=21………..………...………...….32
Figure 3.6 Individual responses to PROP and saliva flow for the tasting panel...32 Figure 3.7. Relation between the detection and recognition thresholds for the 21 tasters (symbols overlap and do not show all responses)……..……….………...…….…33 Figure 3.8. Relation between the astringency and persistency of commercial red …………...…..34 Figure 3.9. Intensity of astringency (white bar) and persistency (black bar) of each tasted wine....35 Figure 3.10. Intensity of astringency (white bar) and persistency (black bar) of all tasted wines according to PROP status (NT, Non-taster, T, Taster, ST, Supertaster). Vertical bars indicate standard error………...………..36 Figure 3.11. Intensity of astringency (open bar) and persistency (black bar) of all tasted wines according to Vinotype (T, Tolerant; S, Sensitive; HS, Hypersensitve). Vertical bars indicate standard error……….……….…36 Figure 3.12. Intensity of astringency (open bar) and persistency (black bar) of all tasted wines according to Saliva flow (L, low; H, high). Different letters for the same attribute indicate significant differences (p<0.05). Vertical bars indicate standard error…….………....37
Figure 3.13. Intensity of astringency (open bar) and persistency (black bar) of all tasted wines according to Gender (M, Male; F, female). Different letters for the same attribute indicate significant differences (p<0.05). Vertical bars indicate standard error……….………38
LIST OF TABLES
Table 1. Composition of skin, seeds and stems tannins (from Souquet et al., 2000)…….…...…19
Table 2.1. Reagents and concentrations of aqueous solutions for the first training session..…...22
Table 2.2. Reagents and Concentrations of aqueous solutions for the second tasting……….…….23
Table 2.3. Reagents and Concentrations for the third and fourth tasting……….…..…..23
Table 2.4. Reagents and Concentrations for the fifth tasting………..…...24
Table 2.5 Wines used in the study………....……..27
Table 3.1. Taster characterization according to the segment………..………..….……28
Table 3.2. Best estimated threshold (BET) calculation for the Detection and Recognition thresholds of commercial tannin (g/L). Correct choice indicated by 1 and incorrect by 0; highlighted gray cells indicate recognition of astringent taste………..………...…….29
Table 3.3. Best estimated threshold (BET) calculation for the Detection and Recognition thresholds of commercial tannin (g/L). Correct choice indicated by 1 and incorrect by 0; highlighted gray cells indicate recognition of astringent taste……….…..30
Table 3.4 Tuckey's test of wines under study for astringency, persistency and preference intensities………....34
Table 3.5. Tuckey's test between Saliva flow and the astringency and persistency intensities..37
Table 3.6. LSD test between gender and astringency and persistence intensities………38
Table 3.7 Mean evaluation of wines for astringency and persistency according to Saliva flow (significant differences in bold), T-Student's test………..……39
Table 3.8 Mean evaluation of wines for astringency and persistency according to Gender (significant differences in bold), T-Student's test………..39
LIST OF ANNEXEX
Annex 1. Demographic and physiological characterization of the tasting panel……….48
Annex 2. Gender with Astringency (α=0,05)…..………..……...………..49
Annex 3. Gender with Persistency (α=0,05)………..…………...…49
Annex 4. Saliva flow with Astringency (α=0,05)………49
Annex 5. Saliva flow with Persistency (α=0,05)...49
Annex 6. t-TEST Gender with each wine according to astringency (α=0,05)...49
Annex 7. t-TEST Gender with each wine according to persistency (α=0,05)...49
Annex 8. t-TEST Saliva flow with each wine according to astringency (α=0,05)...49
Annex 9. t-TEST Saliva flow with each wine according to persistency (α=0,05)...…...49
Annex 10. ISA wines analysis………...………..50
Annex 11. Thresholds determination………..51
LIST OF ABBREVIATION
PROP - 6-n-propyltiouracil HF - High flow rate
LH - Low flow rate CT - Commercial tannins
ISA - Instituto Superior de Agronomia gLMS - general Labeled Magnitude Scale gDOL- generalized Degree of Liking W1- Piteira DOC Reserva 2012
W2- Marquês de Marialva DOC Reserva 2010 W3- Quinta das Bageiras Colheita Tinto 2012 W4- Casas Altas DOC Reserva 2011
W5- Aguião IGT 2014
WC- Wine control, Arinto from ISA TDS- Temporal Dominance of Sensation
1. Introduction
The wine has always had the capacity to “release the tongue” and make the others listen in a social context. It's creation and consumption is combined by speeches, culture, exchange of ideas, man's work and pleasure of sharing that has been passed since the Symposium Greek time through the music, dance, food, eros and literature. Source of insight and inspiration, the wine is the area's identity, demarcation of the border through a micro and macro-zone as to identify the vineyard itself, the climate, the geographical position, the "terroir" (Rota and Stefi, 2012). As well as food, it has transformed the natural necessity to eat without being hungry and drink without being thirsty, because it comes from reflection on the pleasures of the table and by the desire to prolong it. (Brillat-Savarin,1960), evolving into a real art: the art of degustation. Specificaly Peynaud (1981) in the “Taste of wine”: “There is much difference between drinking and tasting. Good wines, great wines are not drinks that you ingest: you must taste. They are never taken in big gulps like a refreshing drink, to capture the only tactile feeling of the liquid that cools the throat. [...] The act of drinking wine and its meaning are not those of the instinctive drinker, the technique of drinking is very different: you learn. [...] [...] Result of many efforts, science and patience, good wine, great wine, deserves a commitment from the one who wants to know, that comes to him, taster, the message of those who have worked for the pleasure of others. The tasting is used to decipher this message and to codify the taste sensations. To drink just physical pleasure, to taste it also takes intelligence and competence ".
1.1 Sensory analysis
The Sensory analysis differs from tasting because include the strict control of assessing, with an addition of three fundamental parameters: the response of a panel taste (number of evaluation), assessment of specific test, (modalities of evaluations) and use of statistical analyses (monitoring of evaluations) (Sangiorgi, 2011). Was born about fifty years ago (when the US consultancy Arthur D. Little proposes to agribusinesses the first formal method to describe the taste of food) to analyze the sensations produced by food and drink, finding broad consensus and development. (Cavalieri, 2011). In general the role of the panel is to give an expectation of consumers in accordance with market economy principles, develop new products and improve those that already exist, reducing costs and checking the quality, also fundamental for the storage stability. Different panels can be formed by people with different levels of knowledge and experience of the product to be tested. Several testing is used to determine if different winemaking processing techniques or operations have a sensory impact. There are four main types of tests:
Triangle; tasters assess all three samples then pick the sample which is different from the other two, or the odd one.
Duo-trio; tasters assess the reference (Ref), then the two test sample (A, B). Tasters are asked to indicate which test sample is the same as the reference.
Paired comparison; tasters are asked to identify which sample is higher in an attribute (e.g.,identify which sample is sweeter).
Same/Different; tasters assess both samples and indicate whether they think samples are the same or are different.
Paired preference; tasters assess both samples and indicate which one the prefer. A choice must be made; the taster can’t say they prefer neither.
The principles of the tasting are based on memory: it's easier recognize and identify only what has already been heard and recorded, even better if an odor or taste is associated with a name which should facilitate the memory. The professional taster also requires an agile mind, to find in a few moments, the personal archive traits taste-olfactory present in the mouth. Simultaneously it is necessary a vocabulary acquisition of tasting, terminologies regulated for the purpose of mutual understanding of the experts and the sharing of subjective sensory experience: it's easy to understand why most of the efforts of this discipline will be addressed the encoding of a language professional. Subjectivity determines larges differences between the tasters interpreting and the sensations produced by the same stimulus, for the use of descriptors and the variability associated with different circumstances. Nowadays, the development of new analytical equipment such as ‘electronic noses’ provides much better results in identifying odor patterns (Buratti et al., 2004; Martí et al., 2005), as well as the saliva precipitation index (SPI) and particle size distribution to evaluate the astringency intensity of tannin by the means of SDS-PAGE electrophoresis and dynamic light scattering methods, respectively (Pascal et al., 2007; Rinaldi et al., 2010). These kinds of equipment could prove more reliable to make the chemical profile of wines but will probably not be able to replace human capacity to actually appreciate the other dimensions that wine brings and that have not been, so far, translated into a chemical formula: pleasure, satisfaction, a whole range of positive emotions (Coste, 2015). Ubigli (2004) observed ‘‘the sensory signal, in the strictest sense, is complemented by a multitude of other information of a hedonistic and emotional type” and perception is not just about a physiological reaction, but an “activity that involves knowledge and reflection”.
1.1.1. From the numbers to the emotions
In the forties with the school of Davis, the analytical language has developed in support of a large-scale production of the wine industry. In this context, new wine method evaluation was proposed, advancing a quantitative and universal conventional assessment: numerical measure accompanied by a referential lexicon (Perullo, 2009). Journalists and specialist in the field, have introduced several wine competitions intent to communicate and promote international wines in order to suggest and direct the consumer towards the best buy. The tendency of this approach has
created a specific “style” of wine, favoring “easy” international commercial wines in opposition to the “difficult” European classic wines (Loureiro et al., 2016), usually hesitant, not very clear noise and rough taste. These types of wines can be expressed more clearly with the time for “breathing” in the glass or in the open bottle, showing more fragrant, rich in flavor and more harmonious (Rizzari, 2015). New propose to design and evaluate a different tasting sheet including emotional reactions, in order to develop and improve the traditional wine tasting sheets. This approach was introduced by Ferrarini et al. (2010), Rive and Deneulin (2014), and recently merging with the inclusion of a focus group (Coste, 2015).
1.2. Astringency
The term astringency derives from the Latin verb a-strigo (ad-stringo), strinxi, strictum, a-stringere that means tightly bind, strongly join. It refers to the propensity of vegetable tannins to complex with macromolecules, such as proteins and polysaccharides, and alkaloids. The importance of tannin-protein interactions in ecological systems is illustrated by the reduced palatability of high tannin forages to herbivores (Mehansho et al., 1987). The name of “tannins”, originating from “tanning” of leather, has been used over decades for their capability of binding with proteins (Gawel, 1998), whereas it is often described in sensory terms as a roughing, drying or puckering sensation in the mouth (ASTM, 2004). Bate-Smith (1954) first speculated that astringent sensations were caused by the increase in friction between the mucosal surfaces which resulted from the reduction in lubrication as salivary proteins were bound by astringent compounds. Often confused with bitterness, astringency was also defined as the “dry-mouth’’ feeling thought to be produced by the interaction of polyphenols with the proteins of the mouth (Singleton and Esau, 1969).
Astringency then can be defined as a tactile sensation, because: (i) it is perceived on non gustatory surfaces such as on soft palate, gingives, lips, (ii) does not show adaptation but also (iii) increases upon repeated ingestion. (Rinaldi et al. 2012).
1.2.1. Tannins
The flavonoids are a group of compounds based on the polyphenolic flavan skeleton, variously substituted with hidroxyl, methyl, galloyl, glucosyl and acyl moieities. In addition to absorb both UV and visible light, including pigments such as aurones, chalcones, and anthocyanins, act as attractants for pollination and seed dispersal (Koes et al. 1994, Shirley 1996, Smith and Markham 1998). The biosynthetic sequence leading to flavonoids begins at the chalcone synthase reaction where p-coumaroyl-CoA combines with three malonyl-CoAs to give a chalcone and Co2 (Douglas 2006). Tannins responsible for wine astringency, consist mostly of flavan-3-ol polymers that are commonly referred to as proanthocyanidins or condensed tannins (De Freitas & Mateus, 2001). They are biosynthesized via a complicated path beginning with phenylalanine (less often tyrosine) and then polymerize proanthocyanidins (Ali, K. et al., 2010).
Tannin is a generic term gathering 3 groups of structurally different molecules: phlorotannins, condensed tannins, and hydrolysable tannins. Individual phlorotannins are composed of two or more phloroglucinol (Fig. 1.1. a) units that are attached to each other via C-C or CO-C bonds, thus yielding oligomers such as the tetrameric phlorotannin (Fig. 1.1. b). Further structural variations may include additional OH-groups in the molecules or additional bonds between the monomers. (Rinaldi A, et al. 2012).
Figure 1.1. Structure of phloroglucinol (a), the phlorotannin unit, and a tetrameric phlorotannin (B) consisting of four phloroglucinol units.
Condensed tannins represent a large majority of tannins present in grapes and wines. They are polymers with more than three units composed of terminal and extension subunits analogous to the flavan-3-ols catechin, epicatechin, epicatechin-gallate, and epigallocatechin (Fig. 1.2.). In a hot and acid medium the interflavanic bond breaks down releasing an unstable carbocation producing, eventually, an anthocyanin. For this reason flavan-3-ol polymers are also called proanthocyanidin (Bate-Smith, 1975).
Condensed tannins, whose composition is listed in tab. 1, are extracted from grape seeds, skins, and stems during the winemaking process (Ribéreau-Gayon, 1974)
Table 1. Composition of skin, seeds and stems tannins (from Souquet et al., 2000).
The tannins in the grape vary in size from dimers and trimers up to oligomers with more than 30 subunits. As showed in the table 1, skin tannins differ from seed tannins for the average size (expressed as their mean degree of polimerization: mDP), larger than seed tannins; skin and stems tannins contain epigallocatechin subunits whereas is absent in the seed. Among the skin flavanols, polymers form are more represent than oligomers, while the monomeric catechins are under-represented (Mateus et al. 2001).
A class of tannin present in wine derived from the use of wood barrels, wood chips or oenological tannins (Ribéreau-Gayon 1972, Saucier et al., 2006) is represented by hydrolyzable tannins. Wine storage with winewoods had a sweetening effect and in parallel decreased the astringency and bitterness sensation (Chira et al. 2013).
Tannic acid, commonly used as a reference compound for astringency in sensory studies, is a mixture of gallotannins with impurities, such as gallic acid and various gallic acid derivatives (Salminen and Karonen, 2011).
1.3. Mechanism of perception
Astringency intensity in wine is correlated to the sum of binding affinity for each tannin molecule, which is determined by tannin concentration and their chemical structure characteristics. Proanthocyanidins are mostly responsible for the astringency, bitterness and structure of wines (Gawel, 1998), while they also play an important role in red wine aging due to their high reactivity: polymerization, condensation with anthocyanins and oxidation reactions (Ricardo-da-Silva et al., 1991). Astringency intensity in wine showed a strong positive relationship with tannins concentration (Robichaud et al., 1990). The study of Peleg et al. (1999) demonstrated that astringency intensity of pure tannins increased significantly, but when the polymerization degree of condensed tannin is too high, it will induce self-precipitation. The esterification of proanthocyanidins with addition of gallic acid plays a significant role in the protein binding
capability (Soares et al. 2007). Flavan-3-ol monomers containing a galloyl ring in the molecule led to an increase of the friction coefficient in the oral mimetic surface in the study of Rossetti et al. (2009). As show figure 1.3, the possible astringency mechanisms include: a) the interaction between stimuli and proteins with formation of soluble complexes and insoluble sediment, b) (i) lack of saliva film and eventual bind to the receptors exposed, (ii) insoluble stimuli-protein complexes trigger astringency sensation via increasing friction and (iii) interaction with oral cavity membrane.
Figure 1.3 Mechanism of astringency perception (from Ma, W., et al., 2014)
This process is believed to be due to the astringent sensation experienced when salivary proteins are precipitated by tannins and as a result lose their ability to lubricate the epithelial membranes of the mouth. (Rinaldi et al, 2010). The sensation of puckering astringency may be elicited by the coactivation of trigeminal chemosensors and mechanosensors, whereas velvety astringents might exclusively activate trigeminal mechanosensation (Schöbel et al. 2014).
The perception of astringency is basically a dynamic process that continuously changes and evolves, takes many seconds (15 s) to develop fully. The TDS (Temporal dominance of sensations) sensory studies on wine, stated that after the sweet, sour and bitter tastes, at about 35 sec after expectoration or ingestion, astringency takes place (Pessina et al., 2004).
1.4 Aims of the study
This research was based on training and tasting sessions of a selected panel to evaluate their sensory and preference responses to several red wines. The panel was subjected to segmentation according to gender, PROP status, saliva flow and Vinotype. In particular the objectives of the study were:
1. To determine the BET (best estimate threshold) of commercial grape seed tannins in white wine.
2. To evaluate the sensory responses to astringency according to taster segmentations. 3. To evaluate the preference for red wines with different astringency levels.
2. Material and Methods
2.1. Taster SelectionThe tasting panel was mainly selected among the students of the Master of Viticulture and Oenology of the Instituto Superior de Agronomia (2015/2016). First and second-year students were the main targets for the work. The selection has been conducted in order to find the subjects with the best knowledge and sensitivity about the main descriptors of the mouthfeel: acidity, sweetness, bitterness and astringency with the purpose to have a group of people trustable in the results and trained to perceive differences. During training sessions, white and red wines from the ISA (see Annex 10) were used in order to prepare different solutions with several reagents.
The guideline was to find out subjects that consume usually wine at least one for the week and able to distinguish the samples submitted. They were prepared, highlighting the main mouthfeel perception. The work started contacting students, males and females, from the ISA without any age limit, smokers and non-smokers.
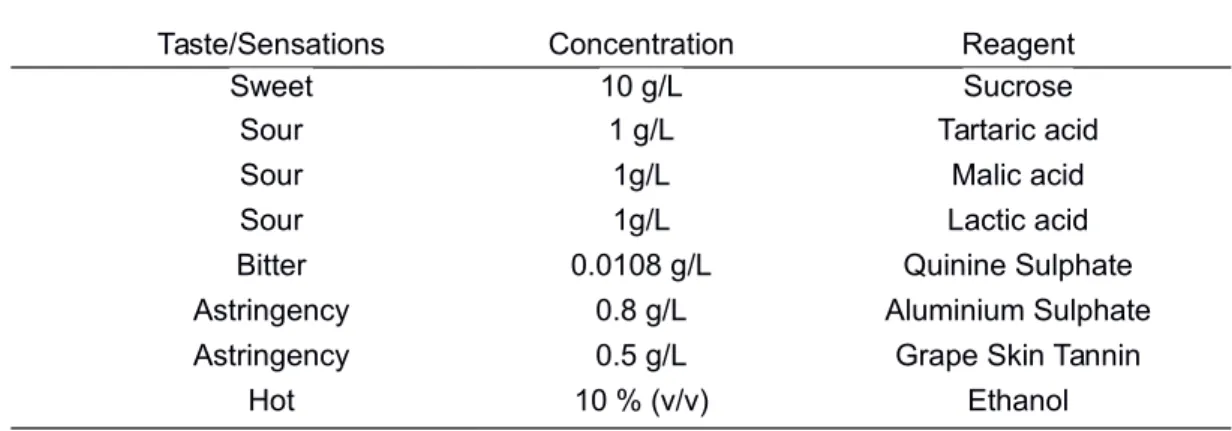
2.1.1. Training session
The training session was made with the basic tastes. The first tasting was with aqueous solutions with the reagents mentioned in table 2.1.
Table 2.1. Reagents and concentrations of aqueous solutions for the first training sessions (from Ceciliani 2017)
Taste/Sensations Concentration Reagent
Sweet 10 g/L Sucrose
Sour 1 g/L Tartaric acid
Sour 1g/L Malic acid
Sour 1g/L Lactic acid
Bitter 0.0108 g/L Quinine Sulphate
Astringency 0.8 g/L Aluminium Sulphate
Astringency 0.5 g/L Grape Skin Tannin
Hot 10 % (v/v) Ethanol
The solutions were served in transparent ISO tasting glasses from Schott Zwiesel (Zwiesel, Germany). Participants were given a questionnaire sheet and the tasting had 3 parts. Tasters were asked to detect and recognize the feeling or sensation in the sample. In the first part tasters were given the sucrose, the tartaric, the quinine sulphate, the aluminium sulphate and the ethanol solutions; they tasted and answered in the sheet. In the second part, participants were given two glasses each with a solution of malic acid and lactic acid, respectively, to express the difference between the samples. Lastly, in the third part students were given two glasses with the Aluminium
Sulphate solution and Skin Tannin solution, respectively, for the participants to feel the different astringency. We asked the participants to drink water between every sample they tasted and to spit out the sample.
Sucrose was purchased from Sigma (St. Louis, USA), L(+) – Tartaric Acid was purchased from Panreac (Barcelona, Spain). Quinine Sulphate was purchased from Acofarma (Barcelona, Spain), Aluminiumsulphat-18-hydrat was purchased from Riedel-de Haën (Seelze, Germany), Ethanol 96% was purchased from Aga (Lisbon, Portugal), L(-) Malic Acid was purchased from Sigma (St. Louis, USA), DL –Latic Acid was purchased from Sigma (St. Louis, USA), Skin Tannin (Tanin Vr Grape) was purchased from Laffort (Bordeaux, France).
After one week, the second tasting was done with a mixture of the tastes and sensations used in the first tasting, using more than one sensation/taste per glass. In the last 3 glasses we used different wine additives with mouthfeel properties to evaluate their difference, using concentrations and reagents presented in table 2.2.
Table 2.2. Reagents and Concentrations of aqueous solutions for the second tasting.
Sensations/ Feeling Concentration and Reagent Sour + Sweet 1 g/L Tartaric Acid + 10g/L Sucrose
Sour + Astringency 1 g/L Tartaric Acid + 0,8g/L Aluminium Sulphate Sour + Sweet + Hot 1 g/L Tartaric Acid + 10g/L Sucrose + 5% Ethanol
Sour + Sweet + Hot + Astringency 1 g/L Tartaric Acid + 10g/L Sucrose + 5% Ethanol + 1 g/L Skin Tannin
Body 2 g/L Soft Gum
Body 0.2 g/L Carboxymethylcellulose
Body 0.6 g/L Mannoprotein
Soft Gum was purchased from A. Freitas Vilar, Lda (Lisboa, Portugal), Carboxymethycellulose (Cistab Gc) was purchased from Proenol (Porto, Portugal), and Mannoproteins were purchased from Laffort (Bordeaux, France).
In the third tasting, after a week, a triangular test was made with white and red wines from ISA. It was a triangular tasting with two control wines and one glass with an added reagent. Participants had to detect and recognize the different sample. The wine based solutions were made with reagents presented in table 2.3. The following tasting (fourth tasting), after a week, was made in the same way because it was noticed a lack of concentration and a difficulty concerning the participants. Tannic Acid was purchase from M&B (Dagenham, England).
Table 2.3. Reagents and Concentrations for the third and fourth tasting
Wine Sensations/ Feeling Concentration Reagent
White Sweet 30 g/L Sucrose
White Sour 2 g/L Tartaric Acid
Red Bitter 15 mg/L Quinine Sulphate
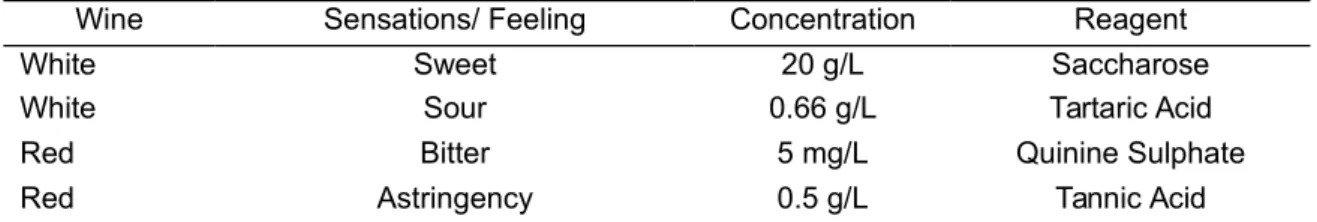
The fifth tasting was the last session before the final panel selection. It was a triangular tasting as the third and fourth tastings but with lower concentrations to hamper the tasting. The concentrations and reagents are presented in table 2.4.
Table 2.4. Reagents and Concentrations for the fifth tasting.
Wine Sensations/ Feeling Concentration Reagent
White Sweet 20 g/L Saccharose
White Sour 0.66 g/L Tartaric Acid
Red Bitter 5 mg/L Quinine Sulphate
Red Astringency 0.5 g/L Tannic Acid
For selecting the final panel it was considered the results from the last tasting. Participants had to have at least 75% of the correct answers.
2.1.2. Selected Panel
The selection began with 41 students and finished with 21 people, with 7 females and 14 males, age 21-46 years (average 25 years, standard deviation 5.79). There were nine students from the first year of the Viticulture and Oenology Master but also non-enology students. All the participants were asked about their background in terms of studies for since how long they drink wine, how many times per week do they drink wine and what they consider themselves about drinking wine (expert, interested or drink for enjoyment).
2.1.3. Sensory Astringency session
Panelists were familiarized with samples and tasting procedures in five hour training sessions. They had been introduced first to the theory of astringency and extensively trained to differentiate astringency from bitterness and sourness using 1.5 g/L tannic acid, 15 mg/L quinine sulphate and 1.5 g/L tartaric acid as examples of astringency, bitterness and sourness, respectively. They were asked to evaluate overall astringency of different concentrations (from 0.1 to 5.0 g/L) of CT (commercial tannin extracted from grape seeds, Tanipepin, Proenol, Porto, Portugal) on a 9-point scale (named: absent, very weak, weak, weak moderate, moderate, moderate strong, strong, very strong, extremely strong) first in water and then in white wine. At the beginning of each session, panelists tasted the standard reference solutions for astringency, which consisted of three CT wine solutions (very weak astringency = 0.1 g/L; moderate astringency = 2.5 g/L; extremely strong astringency = 5.0 g/L) representing the intensities of the sensation on the 9-point scale. During the tasting sessions, four samples (CT wine solutions or wines) were evaluated in duplicate. In each session samples (10 mL) were presented in balanced random order at room temperature (18 ± 2 °C) in black tulip-shaped glasses coded with 3-digit random numbers. The assessors were instructed to pour the whole sample in their mouth, hold it for 8 s, expectorate and rate the
perceived overall astringency using a 9-point scale. Judges waited for 4 min before to rinse with de-ionised water for 10 s twice and then waited at least 30 s before the next sample (each sample was evaluated within 5 min) (Rinaldi 2012).
2.2. Taster characterization
Tasters were classified by Vinotype result, online test (www.vinotype,com) based on the individual's wine preferences (Hanni, 2012), Saliva mean flow, measured according to the procedure described by Smith et al (1996) and with PROP status through the bitterness intensity of three PROP (Sigma, St. Louis, USA) solutions (0.032, 0.32 and 3.2 mM) that were present in increasing order of concentration.
PROP status was assessed during two fifteen minutes sessions held over 2 to 3 weeks. Participants rated the bitterness intensity of three PROP (Sigma, St. Louis, USA) solutions (0.032, 0.32 and 3.2 mM) that were present in increasing order of concentration. Individuals were given 20 ml of solution in each glass and instructed to move the solution in the mouth and to gargle for 5 to 10 seconds and to expel the sample (Pickering et al., 2004). After 10 to 15 seconds, they used a gVAS scale (generalized Visual Analog Scale) to rate the bitterness of the samples. According to Pickering et al. (2016), the gVAS scale uses a “no sensation” on the left (0 mm) and on the right “the worst sensation imaginable” (100 mm). After researching the gVAS scale it was noticed that each author uses a different mark on the scale, some use no mark at all (Hayes, 2013) and others at 25, 50 and 75 mm (Pickering et al., 2016). It was decided to use only the 50 mm mark just to have a reference.
Participants were classified as non-tasters, tasters or super-tasters based in the bitterness rating assigned to the 0.32 mM PROP solution using the gVAS scale (non-taster: ≤ 15.5; taster: > 15.5 and < 51; super-taster: ≥ 51) (Tepper et al., 2001).
2.3. Detection and Recognition best estimate thresholds
This method was applied to find out two different thresholds: the Detection and the Recognition Threshold. The Detection Threshold identifies at which concentration the subject is able to distinguish a sample from the other. The Recognition Threshold identifies at which concentration the subject is able to identify which kind of difference. The BET is applied to the answers of every single subject and then calculated with the final average of the panel. In both cases, the BET is the tool through which is possible to calculate and relate the physical intensity of the stimulus to the corresponding sensation and converting to a value (Meilgaard et al., 1999).
The determination of taste Detection and Recognition Thresholds was done by the selected tasting panel using 4 different concentrations of CT (Tanipepin, Proenol, Porto,Portugal), added to an Arinto base wine presented in balanced random order at room temperature (18 ± 2 °C) provided with 30 mL of wine in coded standard clear wine glasses (ISO-3591, 1997) in black tulip-shaped .
The panelists each received six 3-Alternative Forced Choice (3-AFC) tests with ascending concentrations, starting from 0.02 to 0.32 g/L in wine. In each 3- AFC presentation, three samples are presented: two were controls, and one contained the substance under test. The judges examined each sample from left to right and selected the odd wine. Randomization of the position of the different sample, within each 3-AFC presentation, was carried out for the different panelists; the option of going back to repeat the evaluation of each sample was possible within the single 3-AFC presentation but not possible among the different 3-AFC groups of wines. The best estimate threshold (BET) for each subject was evaluated as the geometric mean of first correct answer of all higher concentrations correct and last incorrect step.
2.4. Determination of astringency, persistency and preference 2.4.1. Scale utilization
Subjects were trained in the use of the general labeled magnitude scale (gLMS) following published standard procedures (Bartoshuk 2000; Green et al. 1993, 1996) that involved culturally appropriate remembered or imagined sensations (Annex 1). The gLMS is a psychophysical tool that yields high quality, ratio level data (Bartoshuk 2000). It requires subjects to rate their perceived intensity of a given stimulus along a line scale with adjectives at empirically derived intervals. The 100 point scale comprises the following adjectives: no sensation= 0, barely detectable=1.5, weak=6, moderate=17, strong=35, very strong=52, and the strongest imaginable sensation of any kind=100 (Bartoshuk 2000). The scale presented to subjects shows only the adjectives, not the corresponding numbers. The score, in cm, for each of the intensity measures was manually obtained with a ruler.
To control for idiosyncratic scale usage, subjects were asked to rate the heaviness of six visually identical weights (sandfilled opaque jars of weights 53, 251, 499, 724, 897, and 1127 g). Subjects held out their dominant hand, palm up while the experimenter placed the weighted bottle on the palm of the hand. Subjects were instructed to use the gLMS to rate the heaviness of each weight.
The scale for preference was a gDOL scale, using an individual generalized degree of liking (gDOL) scales, anchored with three adjectives: “Strongest Disliking of any kind” at the bottom of the scale, “Strongest Liking of any kind” at the top, and “Neutral” in the middle. (Byrnes et al., 2013).
2.4.2. Wines
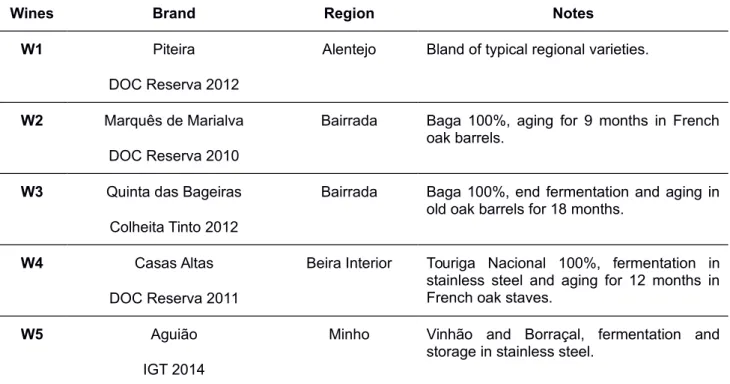
The wines were purchased from local outlets and were selected among several Portuguese wine regions in order to obtain samples eliciting different perceptions of astringency (Table 2.5).
One sample was a control wine (WC) composed by Arinto base wine (ISA) spiked with supra-threshold concentrations of CT (1.5 g/L) and tartaric acid (1.2 g/L).
Table 2.5 Wines used in the study.
Wines Brand Region Notes
W1 Piteira
DOC Reserva 2012
Alentejo Bland of typical regional varieties.
W2 Marquês de Marialva
DOC Reserva 2010
Bairrada Baga 100%, aging for 9 months in French oak barrels.
W3 Quinta das Bageiras
Colheita Tinto 2012
Bairrada Baga 100%, end fermentation and aging in old oak barrels for 18 months.
W4 Casas Altas
DOC Reserva 2011
Beira Interior Touriga Nacional 100%, fermentation in stainless steel and aging for 12 months in French oak staves.
W5 Aguião
IGT 2014
Minho Vinhão and Borraçal, fermentation and storage in stainless steel.
2.5. Statistical analysis
Homoscedasticity of the samples was assessed by Levene's test prior to variance analyses (ANOVA). As all the samples showed homogeneity in the variances, they were subjected to the different ANOVAs. When the ANOVAs revealed significant differences between levels, Tukey's test (in the case of more balanced sets) or LSD's test (in the case of non-balanced sets of samples) were performed using Microsoft Excel and Statistix 9.0 software, with α=0.05.
3. Results and discussion
3.1. Taster Function
The evaluation of the taster phenotype was performed using the responses to increasing concentrations of PROP. The results were the average of two measurements, revealing the expected 3 classes of sensitivity (non-tasters, tasters and super-tasters) as reported by Pickering
et al. (2004). These authors used the bitterness rating assigned to the 0.32 mM PROP solution as
the indicator to distinguish between the 3 classes (non-taster ≤ 15.5; 15.5 < taster <51; super-taster ≥ 51 mm). Accordingly, in our study the individuals were considered mostly tasters (8) and supertasters (10) while there were only 3 non-tasters. The results of the PROP phenotype for each of the tasters have already been presented in the work of Cecilliani (2017).
The responses to the Vinotype questionnaire yielded, on a total of 21 tasters, 4 Hypersensitive, 12 Sensitive and 5 Tolerant tasters. The amount of saliva produced by the tasters (average of 2 determinations) was already published by Cecilliani (2017). The lowest value was 1.416 g/min and the highest 4.466 g/min with a total average of 3.2 g/min, with a regular increase in the amount produced within the range.
The overall segmentation of the tasters is shown in Table 3.1. Regarding gender, we observed that males and females were distributed among the other 3 segments. The low number of respondents does not allow to draw definite conclusions but it is interesting to note that all low Saliva producers were PROP non-tasters. In addition, there were no Vinotype hipersensitives among the PROP non-tasters.
Table 3.1. Taster characterization according to the segment.
Gender Vinotype Saliva PROP
M F T S HS H L NT T ST Gender M 14 - 3 9 2 5 9 2 7 5 F - 7 2 3 2 2 5 1 1 5 T 3 2 5 - - 2 2 1 1 3 Vinotype S 9 3 - 12 - 4 8 2 6 4 HS 2 2 - - 4 1 3 0 1 3 Saliva H 5 2 2 4 1 8 - 0 1 6 L 9 5 2 8 3 - 13 3 7 4 NT 2 1 1 2 0 0 3 3 - -PROP T 7 1 1 6 1 1 7 - 8 -ST 5 5 3 4 3 6 4 - - 10
Gender= M-male; F-female
Vinotype= T-tolerant; S-sensitive; HS-hipersensitive Saliva= H-high flow; L-low flow
3.2. Sensory thresholds of commercial grape seed tannin
The first set of trials was done with 0.2 to 1.6 g/L tannin. The concentrations detected as different from the blank or recognized as more astringent are shown in Table 3.2. These results enabled the calculation of the Best Estimate Threshold (BET) for the detection and for the recognition. However, when we plotted these results (Figure 3.2) we could not see a clear tendency to increase in the percentage of individuals detecting the tastant. In addition, the BET calculation through the graph (Figure 3.2) gave a value of about 0.26 g/L which very different from the value of 0.64 g/L shown in Table 3.2. Therefore we did another trial with higher concentrations of tannin. The results shown in Table 3.3 enabled to calculate the BET for detection as 0.95 g/L. In addition, Figure 3.3 shows that the panel clearly recognized the different increasing concentrations of tannin. In this case, the BET was visually calculated by interpolation giving a result of 0.80 g/L.
Table 3.2. Best estimated threshold (BET) calculation for the Detection and Recognition thresholds of commercial tannin (g/L). Correct choice indicated by 1 and incorrect by 0; highlighted gray cells indicate recognition of astringent taste.
Taster 0.2 0.4 0.8 1.6 Detection threshold Recognition threshold
1 1 1 1 1 0.07 -1.15 0.57 0.05 2 0 1 1 1 0.14 -0.85 1.13 0.66 3 1 1 0 1 0.57 -0.25 1.13 0.66 4 1 0 0 0 1.13 0.05 1.13 0.66 5 1 1 1 1 0.07 -1.15 0.07 0.66 6 1 1 1 0 1.13 0.05 1.13 0.66 7 0 1 0 0 1.13 0.05 1.13 -0.25 8 0 1 1 1 0.14 -0.85 1.13 -0.25 9 0 1 1 1 0.14 -0.85 0.14 0.66 10 1 1 1 0 1.13 0.05 1.13 0.66 11 0 0 1 0 1.13 0.05 1.13 0.05 12 1 0 0 0 1.13 0.05 1.13 -0.70 13 1 0 1 1 0.14 -0.85 0.57 0.66 14 0 1 1 1 0.14 -0.85 1.13 0.66 15 1 1 0 1 0.57 -0.25 1.13 -0.25 16 0 0 1 1 1.13 0.05 0.57 0.66 17 1 1 0 1 0.57 -0.25 0.57 -0.25 18 0 1 1 1 0.14 -0.85 0.57 -0.25 19 0 0 1 1 0.28 -0.54 0.28 0.66 20 1 1 0 1 0.57 -0.25 0.57 0.66 21 0 1 1 1 0.14 -0.85 1.13 -0.25
Log BET Antilog Log BET Antilog
Figure 3.2. Geometric trend of Detection Threshold of Commercial Tannin. Number of tasters (♦) able to detect the respective added sample at each concentration. Dotted line (n = 12) represents minimum agreeing judgments necessary
to establish preference using α=0.05 for triangular comparison tests (total number of tasters N=21).
Table 3.3. Best estimated threshold (BET) calculation for the Detection and Recognition thresholds of commercial tannin (g/L). Correct choice indicated by 1 and incorrect by 0; highlighted gray cells indicate recognition of astringent taste.
Taster 0.4 0.8 1.6 3.2 Detection threshold Recognition threshold
1 1 1 1 1 0.28 -0.54 2.26 0.35 2 0 1 1 1 0.57 -0.25 2.26 0.35 3 0 1 1 1 0.57 -0.25 0.57 -0.24 4 0 0 1 1 1.13 0.05 1.13 0.05 5 1 1 1 1 0.28 -0.54 0.28 -0.54 6 1 1 1 1 0.28 -0.54 0.28 -0.54 7 0 1 1 1 0.57 -0.25 2.26 0.35 8 0 0 0 1 2.26 0.35 2.26 0.35 9 0 1 1 1 0.57 -0.24 0.57 -0.24 10 0 0 0 1 2.26 0.35 2.26 0.35 11 0 0 0 1 2.26 0.35 4.52 0.65 12 0 0 1 1 1.13 0.05 1.13 0.05 13 0 0 1 1 1.13 0.05 1.13 0.05 14 1 1 1 1 0.28 -0.54 1.13 0.05 15 1 1 0 0 2.26 0.35 4.52 -0.65 16 1 1 1 1 0.28 -0.54 4.52 0.65 17 1 0 1 1 1.13 0.05 2.26 0.35 18 0 1 1 1 0.57 -0.25 2.26 0.35 19 0 0 1 1 1.13 0.05 1.13 0.05 20 0 0 1 1 1.13 0.05 2.26 0.35 21 0 0 1 1 1.13 0.05 1.13 0.05
Log BET Antilog Log BET Antilog
Figure 3.3. Geometric trend of Detection Threshold of Commercial Tannin. Number of tasters (♦) able to detect the respective added sample at each concentration. Dotted line (n = 12) represents minimum agreeing judgments necessary
to establish preference using α=0.05 for triangular comparison tests (total number of tasters N=21).
The BET for Recognition could not be achieved with the lower concentrations (Figure 3.4). The higher concentrations of tannin enabled to establish a recognition BET of 1.33 g/L (Figure 3.5) which is similar to the value of 1.21 g/L reported in Table 3.3.
Figure 3.4 Geometric trend of Detection Threshold of Commercial Tannin. Number of tasters (♦) able to detect the respective added sample at each concentration. Dotted line (n = 12) represents minimum agreeing judgments necessary
Figure 3.5. Geometric trend of Detection Threshold of Commercial Tannin. Number of tasters (♦) able to detect the respective added sample at each concentration. Dotted line (n = 12) represents minimum agreeing judgments necessary
to establish preference using α=0.05 for triangular comparison tests (total number of tasters N=21).
3.3. Relation among the taste functions
3.3.1. Relation between PROP response and Saliva flow
Figure 3.6 shows the correlation between the saliva flow and PROP intensity measure for all 21 tasters. Despite being a positive correlation the value of R was only 0,34 (p=0.129) and so we could not establish a significant correlation between PROP response and salivary flow for the tasting panel. 0,0 0,5 1,0 1,5 2,0 2,5 3,0 3,5 4,0 4,5 0 10 20 30 40 50 60 70 80 90 100 P R O P ( cm )
Saliva flow (g/min)
3.3.2. Relation between detection and recognition threshold
The values of BET reported earlier may be used to check if there is a relation between detection and recognition of tannin. The Figure 3.7 shows that although positively correlated these two functions had a poor R (0.46, p=0.034). Therefore, it seems that the ability to detect tannin is independent of the ability to identify it.
0,0 0,5 1,0 1,5 2,0 2,5 0 1 2 3 4 5 R e co g n iti o n t h re sh o ld ( g /L ) Detection threshold (g/L)
Figure 3.7. Relation between the detection and recognition thresholds for the 21 tasters (symbols overlap and do not show all responses).
3.3.3. Relations between sensory thresholds, PROP responses and saliva flow
The previous correlations were also tried concerning sensory thresholds and PROP intensity and saliva flow. We observed poor negative correlations (r<0.5) among the two sensory thresholds and PROP or saliva flow (results not shown). Therefore, although tendencies to have higher sensitivities to tannin (lower BET’s) with higher PROP sensitivity or saliva flow was observed, we could not find a significant correlation.
As a consequence of the previous results, we should evaluate the responses to wine astringency according to PROP status and Saliva flow.
3.4. Evaluation of astringency, persistency and preference in commercial red wines
The sensory panel evaluated the astringency and persistence of five different red wines. When scores were pooled together for all wines we observed a positive relation between astringency and persistency (r= 0,71, p<0.0001) (Figures 3.8). However, we found no relation between these mouthfeel attributes and the preference indicating that other sensory characteristics influence wine liking, the results are not shown.
Figure 3.8. Relation between the astringency and persistency of commercial red wines.
ANOVAs results are showed in table 3.4. It is possible to observe as WC (wine control) displayed a higher intensity astringency and persistency rate (similar with the W3). The W5, young wine from Minho, north region of Portugal, showed a low astringency and a high persistency, maybe according to the freshness and acidity of the wine. Wines W1, from Alentejo, showed a lower intensity rate of persistency then the other wines under trials. Is interesting observe the tendecies by the W3 and W4, from north of Portugal, both evaluated with a higher astringency and persistency rate. The wine W2, from the Bairrada as the W3, showed different results maybe for the different vinification and aging process. To better compare the different mean evaluations of the wines under study, the results are showed in Figure 3.9.
Table 3.4 Tuckey's test of wines under study for astringency, persistency and preference intensities.
Descriptor W1 W2 W3 W4 W5 WC
Astringency 3.38 bc 3.07 c 4.58 a 4.35 ab 2.77 c 4.63 a
Percistency 3.32 c 3.86 abc 4.69 ab 4.60 abc 3.70 bc 5.27 a
Preference 10.78 a 11.04 a 10.65 a 9.97 a 10.61 a 9.75 a 0 1 2 3 4 5 6 7 8 9 10 0 1 2 3 4 5 6 7 8 9 10 P er si st en cy ( cm ) Astringency (cm)
W1 W2 W3 W4 W5 WC 0 1 2 3 4 5 6 7 8 In te n si ty ( cm ) Wines
Figure 3.9. Intensity of astringency (white bar) and persistency (black bar) of each tasted wine.
3.5. Taster responses according to segmentation
The previous results were obtained considering together the responses of all individuals for the five commercial wines. It would be interesting to check if we could find any relation between the taste functions of each taster and the overall mean responses of the astringency and persistency for the five wines, including the responses to the control wine. It should be noted that some segments have a low number of individuals (see Table 3.1). Levene's test showed that homoscedasticity of the samples could be generally assumed. The ANOVAs revealed significant differences between levels, Tukey's test (in the case of more balanced sets) or LSD's test (in the case of non-balanced sets of samples) showed significant differences in the Gender and Saliva flow.
3.5.1. PROP status
The Figure 3.10. shows the PROP status responses according to the different intensity of all wines under trials. We did not find significant difference regarding the response to the intensities under study but a slightly trend for non-taster status to rate the astringency intensity with lower sensitivity than taster and super-taster status, was observed. As showed in the table 3.1, only three subjects were characterized as non-taster.
NT T ST 0 1 2 3 4 5 6 In te n si ty ( cm ) PROP Status
Figure 3.10. Intensity of astringency (white bar) and persistency (black bar) of all tasted wines according to PROP status (NT, Non-taster, T, Taster, ST, Supertaster). Horizontal bars indicate standard error.
3.5.2. Vinotype
As show the figure 3.11, we could not find any relation between the Vinotype and the response to the intensity valuation for the astringency and persistency. The number of tasters for each class, does not permit to go further with reliable statistical analysis.
T S HS 0 1 2 3 4 5 6 In te n si ty ( cm ) Vinotype
Figure 3.11. Intensity of astringency (open bar) and persistency (black bar) of all tasted wines according to Vinotype (T, Tolerant; S, Sensitive; HS, Hypersensitive). Horizontal bars indicate standard error.
3.5.3.Saliva flow
A significant difference was found between the Saliva low and high flow, according to the astringency and persistency intensity, as showed in the Figure 3.12.
Low High 0 1 2 3 4 5 6 a b b a In te n si ty ( cm ) Saliva flow
Figure 3.12. Intensity of astringency (open bar) and persistency (black bar) of all tasted wines according to Saliva flow (L, low; H, high). Different letters for the same attribute indicate significant differences (p<0.05). Horizontal bars indicate
standard error.
Tuckey's test revealed differences among the taster segmentation, as shown in table 3.5. Saliva high flow tasters have a higher rate in astringency and persistency intensities compared to Saliva low flow tasters.
Table 3.5. Tuckey's test between Saliva flow and the astringency and persistency intensities.
Descriptor Saliva Low flow Saliva High flow
Astringency 3.41 a 4.20 b
3.5.4. Gender
As show figure 3.13, differences among the Gender segmentation according to the intensity valuation for the astringency and persistency was found.
Male Female 0 1 2 3 4 5 6 a b b a In te n si ty ( cm ) Gender
Figure 3.13. Intensity of astringency (open bar) and persistency (black bar) of all tasted wines according to Gender (M, Male; F, female). Different letters for the same attribute indicate significant differences (p<0.05). Horizontal bars indicate
standard error.
LSD test revealed a significant difference of males to detect higher astringency and persistency intensities than the females, as shown in the table 3.6.
Table 3.6. LSD test between gender and astringency and persistence intensities.
Descriptor Female Male
Astringency 3.15 b 4.10 a
3.6. Wine evaluation according to segmentation 3.6.1. Saliva flow
The last part of the study was to observe differences within the segmentation according to the intensities descriptors. For each wine, astringency and persistency mean rates of low and high salivators, and of male and female were also compared using T-Student's test for independent samples, with a significance level of 0.05. As shown in table 3.7, there was a different evaluation among Saliva low flow and high flow according to the astringency intensity. It is less noticeable considering the W5 and WC, respectively the lowest and highest astringent wines (see table 3.4), where the results seems to give a parameter more homogeneous. On the contrary considering persistency intensity, the difference between high and low saliva flow was higher for all wines, as had been shown in table 3.5. The single wines showing statistical difference were W2 and W4 for the persistency and astringency, respectively (see annex 8 and 9).
Table 3.7 Mean evaluation of wines for astringency and persistency according to Saliva flow (significant differences in bold), T-Student's test.
Descriptor W1 W2 W3 W4 W5 WC
L H L H L H L H L H L H Astringency 2.91 3.94 2.82 3.41 4.14 5.11 3.47 5.12 2.70 2.92 4.53 4.82
Persistency 2.67 3.97 3.06 4.66 4.21 5.17 4.02 5.16 3.22 4.18 4.44 5.61
3.6.2. Gender
The Table 3.8 showed a different trend in particular regarding the WC, where Females rated it as the third most astringent and second most persistent wine, while Males valuated it as the most astringent and persistent wine of all. The single wine showing statistical differences was W2 regarding astringency (see annex 6 and 7), while no differences for persitency was observed.
Considering the mean evaluation for all wine, we can confirm that the panel distinguished and recognized at the same way but with a different sensibility the wines under study, where the WC displayed with the W3 and W4 as the most astringent and persistence.
Table 3.8 Mean evaluation of wines for astringency and persistency according to Gender (significant differences in bold), T-Student's test.
Descriptor W1 W2 W3 W4 W5 WC
F M F M F M F M F M F M Astringency 2.21 3.78 2.22 3.39 4.13 4.62 4.07 4.16 2.23 3.10 3.75 5.13