A thesis submitted for the Master of Science degree in
Geospatial Technologies
Interoperability Enhancement of
IoT devices Using Open Web
Standards in a Smart Farming Use
Case
Composed by Daniel Marsh-Hunn
Supervised by Ph.D Sergio Trilles
Co-supervised by Prof. Joaqu´ın Huerta & Prof. Roberto Henriques
Universitat Jaume I
Abstract
Since its first appearance the Internet of Things has been subject to constant evolu-tion, development and change. Now it has stepped out of its infancy with billions of devices embedded in the world wide web. However, IoT providers mostly define their own data formats and protocols and there is still a lack of a common standard that connects these devices in an interoperable manner. There are several organisations dedicated to developing common standards for IoT devices and research is focusing on defining an effective standard to be used by embedded devices. Unsurprisingly, IoT has also found its way into the spatial web and into environmental monitoring and sensing platforms connected over the web by wireless sensor networks are now a common way to monitor natural phenomena. This study compares three open Web Standards in the use case of SEnviro for Agriculture, a full stack IoT for monitoring vineyards. The interoperability potential of the OGC’s Sensor Observation Service and SensorThings API are evaluated by integrating Web Standard implementa-tions for each standard and contrasting their qualitative and quantitative traits. In a further step the Mozilla Corporation’s Web Thing API was implemented and evaluated in an environmental monitoring and Smart Farming context. The results of the study show that the SensorThings API proves to be the most adequate Web Standard for SEnviro and IoT applications for environmental monitoring and Smart Farming in terms of interoperability. It outperforms the contesting Web Standards in terms of flexibility and scalability, which strongly impacts on developer and user experience.
Acknowledgements
I would like express my gratitude to all the people involved in the process of this study. First I would like to thank my supervisor Ph.D. Sergi Trilles for his support. Sergi’s advice, feedback, knowledge and dedication proved to be crucial for the success of this thesis. I also want to thank Alberto Gonzales for taking the time to aid me in technical challenges. My thanks also go to my co-supervisors Prof. Joaquin Huerta and Prof. Roberto Henriques for providing valuable feedback. I further wish to express my appreciation for all dear friends who aided me with their advice, their motivation and their good spirit. My special thanks go to my fellow students, with whom I shared this precious life experience. Lastly I want to thank my dear life partner Franziska for her encouragement, her patience, her council and her love.
Contents
1. Introduction 1
1.1. Context . . . 1
1.2. Problem Definition . . . 3
1.3. Motivation and goals . . . 3
1.4. Structure . . . 4
2. Background 5 2.1. Internet of Things . . . 5
2.2. Sensing hardware . . . 6
2.3. Wireless Sensor Networks . . . 7
2.4. Machine-to-Machine Communication & MQTT . . . 9
2.5. Interoperability . . . 10
2.6. Open & Sensor Web Standards . . . 11
2.6.1. Sensor Observation Service . . . 12
2.6.1.1. SOS data model . . . 12
2.6.1.2. SOS operations . . . 14
2.6.1.3. SOS implementations . . . 14
2.6.2. SensorThings API . . . 15
2.6.2.1. SensorThings data model . . . 15
2.6.2.2. SensorThings operations . . . 17
2.6.2.3. SensorThings implementations . . . 17
2.6.3. Web Thing API . . . 18
2.6.3.1. Web Thing data model . . . 19
3. SEnviro for Agriculture 20 3.1. Smart Farming . . . 20 3.2. SEnviro components . . . 22 3.2.1. SEnviro nodes . . . 22 3.2.2. SEnviro Connect . . . 24 4. Methodology 28 4.1. Experimental Environment . . . 29
4.2. Deployed Web Standard Implementations . . . 30
4.2.1. 52North-SOS . . . 30
Contents
4.3. SEnviro Web Standard Integration . . . 33
4.3.1. SOS Adapter . . . 35
4.3.2. SensorThings Adapter . . . 35
4.3.3. Web Thing Adapter . . . 36
4.4. Comparative Analysis . . . 37 4.4.1. Performed operations . . . 37 4.4.1.1. Data management . . . 37 4.4.1.2. Accessing metadata . . . 37 4.4.1.3. Observation retrieval . . . 38 4.4.2. Qualitative Analysis . . . 40 4.4.3. Quantitative Analysis . . . 41
4.4.3.1. Response times and sizes . . . 41
4.4.3.2. Web service metrics . . . 42
5. Web Standard Comparison 45 5.1. Web Thing API evaluation . . . 45
5.2. 52North-SOS & FROST qualitative evaluation . . . 47
5.2.1. Service deployment & configuration . . . 47
5.2.1.1. 52NorthSOS setup . . . 47
5.2.1.2. FROST setup . . . 48
5.2.2. Data management . . . 48
5.2.2.1. 52North-SOS transactional operations . . . 48
5.2.2.2. FROST Create-Update-Delete requests . . . 53
5.2.3. Retrieving metadata . . . 55
5.2.3.1. 52North-SOS metadata operations . . . 56
5.2.3.2. FROST metadata queries . . . 56
5.2.4. Observation queries . . . 58
5.2.4.1. 52North-SOS queries . . . 58
5.2.4.2. FROST queries . . . 60
5.3. 52North-SOS & FROST performance evaluation . . . 64
5.3.1. Response times and sizes . . . 65
5.3.2. Container metrics . . . 68
5.4. Discussion . . . 72
Conclusion & Future Work 78
Bibliography 82
List of Figures
2.1. WSN components overview (Mainetti et al., 2011) . . . 8
2.2. O&M data model extract (Open Geospatial Consortium, 2007) . . . . 13
2.3. SensorThings data model (Open Geospatial Consortium, 2016) . . . . 16
2.4. Mozilla - Project Things . . . 18
3.1. Schema of SEnviro architecture; the pink section represents physical components, the blue section represents software elements . . . 22
3.2. SEnviro node core and power supply assembly . . . 23
3.3. Fully assembled and deployed SEnviro node. . . 24
3.4. A screen-shot of the SEnviro Connect view to visualise observations and alerts. . . 26
3.5. A screen-shot of the SEnviro Connect view to manage SEnviro nodes. 27 4.1. Schematic view of Web Standards SEnviro integration . . . 29
4.2. 52North SOS Client interface . . . 30
4.3. Helgoland Map View . . . 31
4.4. Helgoland Diagram View . . . 32
4.5. SEnviro message queuing example schema . . . 34
4.6. Postman Response Time Monitoring Interface . . . 42
4.7. JMeter Performance Monitoring interface . . . 43
4.8. cAdvisor interface . . . 44
5.1. Elcano specifications . . . 64
5.2. Average Postman response sizes . . . 66
5.3. Average Postman response times . . . 67
5.4. Above: Plots from 52North-SOS and FROST container CPU usage in idle state and during requests of 1000 observations; Below: CPU metric behaviour from both services during requests of 1000 observa-tions . . . 69
5.5. Average CPU usage for different response sizes in FROST and 52North-SOS . . . 70
5.6. Memory metrics for 52North-SOS and FROST requests of 1000 ob-servations . . . 71 5.7. Memory usage for different request sizes in FROST and 52North-SOS 71
List of Tables
4.1. FROST OGC Compliance Testing Status . . . 33 5.1. Built-in operators for the SensorThings Filter operator . . . 61 5.2. Built-in functions for the SensorThings Filter operator . . . 62 5.3. Average HTTP response sizes in Kilobytes [kb] for observation
re-trieval from Postman . . . 65 5.4. Average HTTP Response Times in Milliseconds [ms] for observation
retrieval from Postman . . . 67 5.5. 52North-SOS and FROST request types and approximated input and
1. Introduction
The Internet revolution enabled the large-scale interconnection between people across the globe. Today, technological advance allows objects to interact over the Internet without the aid of human intervention, creating an Internet of Things. The concept of the Internet of Things (IoT) first emerged in 1999 and has since been subject to constant evolution, redefinition and expansion. It has stepped out of its infancy and is transforming the current Internet into fully integrated future Internet, connecting billions independent, intelligent devices (Gubbi et al., 2013).
1.1. Context
Rapidly developing device-to-cloud technologies and the increasing deployment of devices connected to the Internet bring along a new dimension of possibilities and applications in various fields of human activities, but also imply new challenges in making disparate solutions and heterogeneous data sources and formats interact seamlessly, enabling a large-scale IoT (Sutaria and Govindachari, 2013). Widely de-fined as “a world-wide network of interconnected uniquely addressable objects, based on standard communication protocols” (Bassi and Horn, 2008), predictions estimate the IoT will consist of 50 billion connected devices exchanging information over the Internet by 2020 with an economic impact of 2 trillion US$ (Weinberg, 2014). IoT applications are developing in major sectors such as smart business, inventory management, smart homes, transportation and logistics, health-care, security and surveillance and environmental monitoring. This vast number of ”things” is able to access and acquire data about devices and their environment, independent of human interaction (Lazarescu, 2013).
IoT environmental and earth monitoring applications have received increased at-tention in the recent decades, since they have become a key factor of sustainable growth world-wide. Among outdoor environment monitoring, observing open na-ture phenomena can be challenging due to harsh climatic conditions and difficulty of physical access to the field, resulting in high costs for sensor deployment and main-tenance (Lazarescu, 2013). These challenges have been addressed by technological advances in low power integrated circuits and wireless communication. Modern sensing devices have drastically decreased in size, in cost and in power consump-tion, resulting in the viability of deploying networks of intelligent sensors. These Wireless Sensor Networks (WSN) may consist of a large number of nodes with
lim-1. Introduction
ited processing capability and storage, and can be equipped with several different sensors, capable of observing multiple natural phenomena (Gubbi et al., 2013).
The advance in technology for environmental monitoring has also extended into agriculture and farming (Kamilaris et al., 2016). Highly accurate embedded envi-ronmental sensors have paved the way for precision agriculture, which applies more efficient irrigation, targeted use of fertilisers and pesticides and more precise use of fodder and antibiotics for livestock. This enhanced form of farming potentially leads increased productivity, greater yields and a reduced environmental footprint. Taking precision farming even further in an IoT context, the concept of Smart Farming has emerged for decision-support for farmers. Smart Farming focuses on real-time data gathering, processing and analysis and on the automation of farming procedures for an overall improvement of farming operations and management (Kamilaris et al., 2016).
Modern web technology is advancing at a tremendous rate and demand for re-search in specialised fields is increasing in order to stay up to date with state-of-the-art technology. Web-based solutions for environmental and agricultural monitoring are no exception and researchers are designing and developing new implementations to enhance precision and efficiency of monitoring systems. A challenge, in the IoT domain in general as well as in specialised domains, is to achieve system interoper-ability. Globally defined as ”The ability of two or more systems or components to exchange information and to use the information that has been exchanged.” (IEEE, 1991), this is a key concept to make environmental monitoring information accessible to a larger community and is a necessary step to take towards open data. Since IoT emerged a large variety of vendors, researchers and interested parties have been de-veloping IoT solutions in parallel and although several device types and protocols for IoT are available on the market, only few interoperate among each other (Weinberg, 2014). With the growing number of IoT devices the importance of interoperability is becoming more evident. While the world-wide Internet relies on standard tech-nologies and protocols like HTTP, SSH etc., these solutions are not designed for devices with severe power and data loss constraints. Efforts are currently being made to produce well defined open standards-backed protocols compatible with IoT environments (Sutaria and Govindachari, 2013).
1. Introduction
1.2. Problem Definition
Although the concept of IoT is already established and implementations are mush-rooming manifold, it still lacks a widely accepted standard model to enable large scale interoperability. Standardisation bodies and alliances are working on defin-ing Web Standards and Protocols, and their adoption requires user and developer consensus through trials and testing. Currently there are several proposed open standard solutions already available, each differing in slightly in functionality, spe-cialisation and structure, but having interoperability as a primary goal. With IoT also having found its way into environmental monitoring, Smart Farming and the Spatial Web, it is crucial to investigate the potential of existing Web Standards in an interoperability context within these domain. This includes testing and compar-ing different standards in order to find the most efficient Web Standard solution. This study will investigate openly available Web Standards to answer the following research questions:
”How can Open Web Standards increase interoperability of Smart Farming IoT solutions?”
”Which Web Standard is the most adequate to enhance interoperability in Smart Farming IoT solutions?”
1.3. Motivation and goals
In 2015 a prototype for a sensorised platform WSN using open hardware and open standards was developed in the scope of the SEnviro project (Trilles et al., 2015) at Universitat Jaume I in Castell´on de la Plana, Spain. Three years later SEnviro for Agriculture (Trilles et al., 2018) was launched, furthering the development of a new prototype based on the SEnviro platform in an agricultural context to monitor en-vironmental parameters in vineyards. While it is planned to include open standards into the project, this task is still pending and will be the focus in this master thesis. This master thesis aims at investigating potential open Web Standard solutions for environmental monitoring applications in the IoT. The main contribution of this study lies in producing an in-depth, contrasting juxtaposition of a selection of openly available, up-to-date web standard solutions. Open source implementations of these standards are deployed and adapted to the needs of SEnviro for Agriculture, then they are compared on performance, on semantic, on flexibility and on scala-bility levels. The results help determine the most suitable candidate for SEnviro for Agriculture and potentially for other environmental monitoring and agricultural
1. Introduction
IoT applications. A further goal of the study is to enhance the interoperability of the already established SEnviro for Agriculture web platform.
1.4. Structure
The remainder of this document consists of the following chapters:
2. Background: This chapter contains a full literature review covering topics relevant to this paper. The chapter will provide insight into previous and state-of- the-art research in WSN, open standards, communication protocols and interoperability.
3. SEnviro for Agriculture: The document continues with a detailed sum-mary of the SEnviro for Agriculture project. This includes information about the area and context of experimentation, the included hardware and software architecture and the applied web technologies.
4. Methodology: The Methodology section sheds light on the methodology used to evaluate the potential of applying open Web Standards in SEnviro. It focuses first on the selection of open-source Web Standard implementations, followed up by their deployment in the experimental environment. The chapter then describes the methods of comparing the deployed instances used in the study.
5. Web Standard Comparison: This chapter presents the results of the com-paring methods. The deployed open standard entities are compared on mul-tiple levels. Performance is assessed quantitatively, Web Standard semantics will be contrasted and aptitude for SEnviro and Smart Farming projects is determined.
The terminal section Conclusion & Future Work provides a summary of the project results and specifies on future work in this field of study.
2. Background
This chapter aims to provide an overview of the topics included in this research, in-vestigates the key concepts and explores work relevant to this study. Furthermore, it will focus on several technologies crucial to the realisation of this research. While many of these technologies can be applied in several application fields, this docu-ment will primarily refer to their application in an environdocu-mental and agricultural monitoring context, since the study was applied to a Smart Farming use case.
Like several other application fields, environmental and agricultural monitoring have evolved with the technological revolution of the recent decades. While in the past environmental monitoring depended on the manual collection of field data and laboratory analyses, smarter, smaller and inexpensive sensors and wireless commu-nication technology now enable continuous monitoring and real-time applications.
The following sections provide insight into state-of-the-art technologies and key concepts included in this study’s work.
2.1. Internet of Things
The term Internet of Things was first introduced in supply chain management by Kevin Ashton in 1999, but in the past two decades the definition evolved to include a wide range of fields like health care, utilities, transport etc. (Gubbi et al., 2013). Typically, it is described as a framework of interconnected, uniquely identifiable devices within the Internet. In the IoT concept every physical thing is reflected in the information world by its unique virtual identity, enabling it to interconnect and communicate with each other (Huang and Wu, 2016).
Unique identifiers are key to any kind of communication and transaction among devices, which in IoT environments are represented by IP addresses in a global net-work of devices. Furthermore, Uniform Resource Identifiers (URI) are considered as the primary identifiers in the Physical Web, which consists of devices within the IoT which are directly accessed and managed by web technologies. Key enabling technologies for communication among IoT devices are Radio Frequency Identifica-tion (RFID), Bluetooth Low-Energy beacons (BLE) and optical tags such as quick-response codes (QR-Codes). These technologies enable power-efficient and remote device identification (Want et al., 2015).
2. Background
The two main capabilities of the IoT are Sensing and Tasking. The sensing capability enables users to monitor device’s statuses (e.g. On-Off status, battery status, etc.) and environmental properties of their surroundings (e.g. temperature, humidity, location etc.). The tasking capability enables users and other devices to control devices remotely, making the device execute tasks or adjusting its properties. The integration of these capabilities forms the base of various automatic and efficient IoT applications (Huang and Wu, 2016).
2.2. Sensing hardware
Sensor nodes in WSN consist of four essential components: one or multiple sensing units, a processor, a transceiver and a power supply (Trilles et al., 2015). Research in environmental sensing has furthered the development of these components, resulting in prolonged node operation time and WSN lifetime (Moi¸s et al., 2018).
Sensors are devices able to detect changes in the environment, measuring phys-ical phenomena (e.g. temperature, humidity etc.) transforming them into electric signals (Spann et al., 2018). Rapid development in sensing technologies is one of the primary drivers for the IoT. Decreasing cost, higher accuracy, greater power efficiency and smaller size of sensing devices has led to a large variety of sensor so-lutions and smart devices for several application fields on the market (Swan, 2012). Since Smart Farming focuses widely on monitoring plant health, sensors typically include hardware for measuring soil and air temperature and humidity and optical sensing units for monitoring plant leaf colour and light intensity.
Environmental monitoring mostly requires humidity and temperature measure-ment, resulting in a high demand for affordable, easy-to-use integrated humidity and temperature sensors (Lee and Lee, 2005). Examples for low-cost air tempera-ture and humidity sensors are the DHT11 and the DHT22, which are small in size (up to 15.5x25x7.7 mm), in many cases sufficiently accurate (humidity accuracy 2-5%, temperature accuracy up to ±0.5ºC) and costs under 10 US$ on the market. For effective monitoring in the field, sensors are complemented by microcontroller boards. Microcontrollers contain all the necessary components which allow it to op-erate standalone, such as the microprocessor (CPU), memory, interface controllers, timers and one or multiple input-output pins (Gridling and Weiss, 2007). Several microcontroller boards are now available on the market, including specific features and functionalities depending on their field of usage. Among the most popular boards are the Arduino Uno and the Raspberry Pi 2 (Spann et al., 2018).
2. Background
2.3. Wireless Sensor Networks
The advances in monitoring hardware go hand in hand with more effective ways for devices to connect and communicate among each other. While environmental monitoring was traditionally based on field sampling, on laboratory analysis or on off-line sensors and field loggers requiring manual data downloading, Web technology now enables real-time monitoring with sensor networks (Kotam¨aki et al., 2009).
Environmental monitoring forms the backbone of Smart Farming, and the bulk of monitoring applications rely on WSN due to their flexibility, scalability and reduced installation and maintenance costs (Moi¸s et al., 2018). Originally mostly based on closed or proprietary systems with limited communication to the outside world, modern WSNs use the Internet Protocol to connect WSN nodes to the IoT (Mainetti et al., 2011).
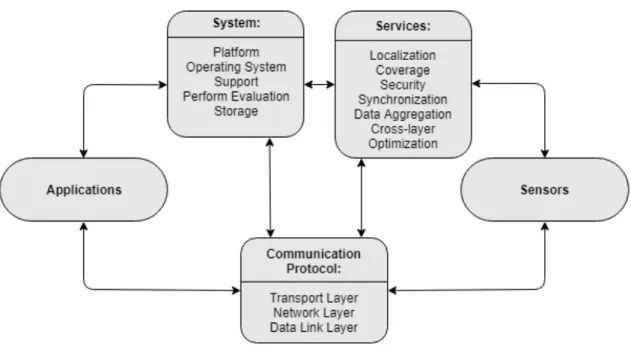
WSN include generic nodes and gateway nodes. Generic (multi-purpose) nodes are equipped with devices capable of taking measurements from the environment. Gateway nodes receive data from generic nodes and transmit them to a central station, which requires the nodes to have greater processing power and power supply. As shown in Figure 2.1, key to enabling WSN applications to connect to sensor technologies can be classified into three component groups: system, communication protocols and services (Yick et al., 2008).
Every node is a self-organising, self-managing system. WSN platforms are de-signed to support a a variety of sensors, radio components, processors and storage. The system software, such as the operating system, has to be designed to support the varying sensor platforms. Further core system features must include automatic management, longevity optimization and distributed programming. Organisations like the Institute of Electrical and Electronics Engineers (IEEE) and the Ameri-can National Standards Institute (ANSI) develop technology standards for IoT ad-dressing these issues, with standards like IEEE 802.15.4, ZigBee, WirelessHART, ISA100.11, IETF 6LoWPAN, IEEE 802.15.3 and Wibree being among the most fre-quently used. These standards typically include dedicated communication protocols and aim at increasing IoT interoperability. WSN nodes use communication protocols to communicate with one another, which need to be energy-efficient and reliable in transporting data packages. Network services include node localisation (e.g. GPS, RIPS etc.), synchronisation, coverage and data compression and aggregation (Yick et al., 2008).
2. Background
2. Background
2.4. Machine-to-Machine Communication &
MQTT
Machine-to-Machine (M2M) communication is essential in the IoT, enabling intel-ligent devices communicate and make decisions without human interaction. M2M applications impose new limitations on communication solutions due to the type of data traffic generated. M2M data traffic typically transfers small data packages, but they are large in number and involve a many connected devices. Even though the messages are usually short, M2M services need to be highly reliable and able to handle delays. Further challenges are potential computing and power constraints, which depend on device hardware (Latvakoski et al., 2014).
Devices in the IoT are exposed on the World Wide web using the lingua franca, namely the Hyper Text Transfer Protocol (HTTP), and their accessibility typically builds on Representational State Transfer (REST) principles. While HTTP was designed for client-server communication and transferred data packages are gener-ally large, embedded devices usugener-ally can’t handle high-level protocols and require lightweight binary protocols and bidirectional communications (Collina et al., 2012). The websocket protocol, standardised by the Internet Engineering Task Force (IETF) in 2011, allows bidirectional communications and several M2M messaging protocols are now available. Research in REST-like applications in constrained environments have produced protocols like the Constrained Application Protocol (CoAP), which enables resource constrained applications to use HTTP interac-tion methods (GET, POST, PUT, DELETE). Furthermore, standards like 6lowpan (IPv6 Low Power wireless Area Networks) can handle Maximum Transmission Unit (MTU) sizes and compress IPv6 headers from 60 bytes to 7 bytes. Message protocols can be broker-based, such as Data Distribution Service (DDS), Advanced Message Queuing Protocol (AMQP) and STOMP, or broker-less, such as ZeroMQ. Finally, the Message Queuing Telemetry Transport (MQTT) protocol enables M2M appli-cations to exchange lightweight messages in publish/subscribe patterns (Latvakoski et al., 2014). MQTT messages are binary based, meaning the control elements are binary bytes instead of being text strings. Byte messages have considerably smaller payloads than e.g. JSON strings and therefore ensure messages remain lightweight. The MQTT protocol implements various levels of Quality of Service and boasts high speed and power efficiency. It is based on the concept topics to which clients can publish updates or subscribe for receiving updates from other clients. With rapidly increasing popularity, MQTT libraries now support major IoT development platforms (e.g. Arduino), programming languages and for iOS and Android mobile platforms. The MQTT community claims that a publish/subscribe protocol is the
2. Background
key component to build the future IoT (Collina et al., 2012).
2.5. Interoperability
The number of embedded devices within the IoT is increasing drastically and many IoT producers develop distinct web service protocols, only supported by their pro-prietary IoT devices. This results in closed IoT silos, each having its complete IoT frameworks, including devices, gateways, services and applications. An upcoming is-sue in IoT is that elements in different IoT silos cannot connect, leading to scattered IoT solutions with incompatible, co-existing protocols (Huang and Wu, 2016).
Interoperability in the rapidly growing IoT ecosystem is a challenging yet cru-cial aspect of successful IoT. Highly interoperable protocols must address several challenges. Firstly, the translation solution must not impose any pre-configuration of applications. Furthermore, it should be scalable, capable of running hundreds of connections within cloud environments. There are also security and verifiability requirements to uphold. Finally, the interoperability solution must be capable of verbose reporting and supporting Quality of Service parameters (Derhamy et al., 2017).
Approaches to address IoT interoperability have been made by numerous research projects in industry and academia. Solutions include the development of Middleware (e.g. Starlink, INDISS, uMiddle) and protocol proxies (e.g. MuleSoft, IBM MQ, Artix), yet they shift the interoperability dilemma rather than solving it. Currently, it is improbable that a single IoT communication protocol prevails as a globally accepted solution, yet there have been efforts to do so as proposed in Derhamy et al. (2017).
An important actor in interoperability research in the geospatial field is the Open Geospatial Consortium (OGC), an organisation of over 260 members from the aca-demic and industrial sectors, as well as governmental agencies. Their primary goal is to find participatory concensus for openly available interfaces and encodings for the Geospatial Web. The OGC provides a set of Geospatial Abstract Specifications for different types of geographical data, upon which the OGC’s interoperability standards build on (Reed, 2004).
2. Background
2.6. Open & Sensor Web Standards
Geo-scientists have been uploading geographical data for sharing and exploration since the dawn of the World Wide Web. M2M data harvesting has led to community-adopted frameworks, common standards and enriched metadata, significantly im-proving observational accuracy, sensor discovery and configurability (Fredericks and Botts, 2018). Sensor systems contribute to a large part of geospatial data and gen-erally include in-situ sensors, moving sensor platforms or networks of static sensors (Open Geospatial Consortium, 2007).
The Open Geospatial Consortium (OGC) is one of the main actors in the field of Sensor Web Standards. The OGC Sensor Web Enablement (SWE) supports the ability to fully describe the processes used in producing observations and their corresponding sensors. Furthermore, it includes machine-actionable access to web-accessible observations and sensor tasking capabilities. SWE builds on machine-readable encoding like Sensor Model Language (SensorML), Observation & Mea-surement (O&M) and Geography Markup Language (GML)(Fredericks and Botts, 2018).
OGC Web Standards are a tempting choice for Smart Farming applications, since this organisation specialises in publicly available standards development to geo-enable the web. In the scope of the OGC’s SWE, the organisation released a set of services to facilitate the exchange of sensor data between SWE enabled nodes and to allow clients and servers to arrange, encode and transfer sensor data in a semantically enabled way (Open Geospatial Consortium, 2019). This document will consider the well- established Sensor Observation Service (see 2.6.1 Sensor Ob-servation Service and the more recent SensorThings API (see 2.6.2 SensorThings API ).
Although the OGC offers the most complete open standards for sensor observation and boast most features and functionality, there are also non-OGC solutions for environmental monitoring currently available. Some more recent solutions address challenges more related to the IoT paradigm, designed for connecting devices to the World Wide Web in a light-weight and flexible, machine-readable format. This study provides a closer look into the Web Thing API (see 2.6.3 Web Thing API ), a proposed data model and API by the Mozilla Corporation and intends to investigate its potential in environmental monitoring applications like SEnviro.
2. Background
2.6.1. Sensor Observation Service
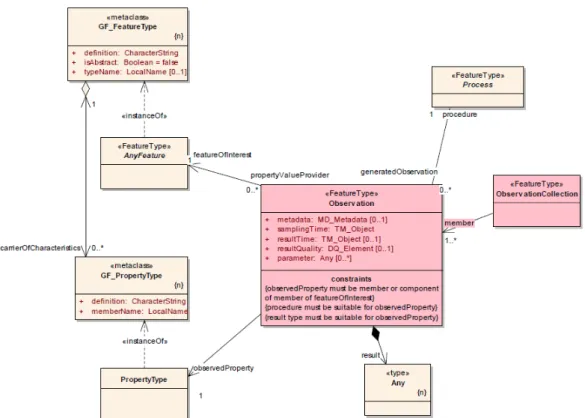
The Sensor Observation Service (SOS) was approved by the OGC in 2007 as an offi-cial open standard for handling sensor data in the World Wide Web. SOS provides a standardised interface using SOAP XML binding for managing and retrieving meta-data and observations from heterogeneous sensor systems. It is part of the OGC Sensor Web Enablement framework of standards and leverages the SWE data mod-els and XML encodings for Observation & Measurement (O&M), Transducer Model Language (TransducerML) and Sensor Model Language (SensorML). The SOS devel-opment approach aims to describe sensing devices, sensor systems and observations in a way that supports all types of sensors and the requirements of users of sensor data. SOS is therefore designed to match the O&M data model (see Figure 2.2) (Open Geospatial Consortium, 2007).
2.6.1.1. SOS data model
The essential components in SOS are the following:
• Procedure: Produces the measured value of an observation. This can be a single sensor, a sensor platform or a numerical simulation process.
• Offering: Logical grouping of observations related to each other and belong to a common service. For example, the relation can be spatial (share the same location or platform), temporal (created in the same time interval) or due to corresponding properties (e.g. measure the same phenomena)
• ObservableProperty: A procedure can have multiple observed properties, which represent the physical phenomena measured by a sensor (e.g. temperature, humidity etc.)
• FeatureOfInterest: Features of interest (FoI) represent identifiable objects on which sensor systems are making observations. These should include spatial information to allow the location to be harvested by OGC service registries. • Observation: Contains a measurement value for an observed property of an
object under observation (FoI). Observation must include the time stamp when the observation was created.
2. Background
2. Background
2.6.1.2. SOS operations
SOS includes a set of operations for retrieving sensor data and metadata. The three mandatory core operations are:
• GetCapabilities: This operation provides access to metadata and details about the service’s capabilities. Either an HTTP GET or POST request is used to retrieve the service Capabilities document, an XML file containing metadata about the service, like unique identifiers, unique groupings of observations (offerings) and physical phenomena measured by the sensors (observedProp-erties)
• DescribeSensor: The unique identifiers retrieved in the Capabilities document can be used in the DescribeSensor operation to request sensor metadata in SensorML format if the procedure with the identifier is present in the service. • GetObservation: This operation provides access to the observation data made by sensors in the service. A request file containing information from the Ca-pabilities document must be sent via HTTP POST to the server, which then returns the requested observations. Details such as the offerings or the ob-servedProperties, as well as spatial and temporal filters can be included as query parameters. SOS returns the requested observation data in O&M for-mat.
To make SOS configurable for any type of sensor observation project, it also provides transactional operations to insert sensors and observations:
• RegisterSensor: This operation allows users to register sensors in SOS. An XML file containing the information about the new sensor in SensorML en-coding is sent to the service via HTTP POST request.
• InsertObservation: Observation data from sensors is inserted into SOS via HTTP POST, using an XML file following the O&M specification. The file must specify the procedure which produced the measurement, which in turn must be present within the service.
2.6.1.3. SOS implementations
There are currently several open source implementations of SOS. Among the most developed, openly available SOS-implementations are:
Insti-2. Background
tute for Earth Sciences at SUPSI1 (University of Applied Sciences and Arts of Southern Switzerland). It a user-friendly interface for service configuration, a REST API and data exploration. The latest istSOS2 release (istSOS-2.3.1) was in February 2016. istSOS3 is in development, but still in its early stages. • 52North-SOS: This Java implementation of SOS is developed at 52North GMBH2, based in M¨unster, Germany. It includes a variety of extended fea-tures, including support for INSPIRE download service and specialised XML encodings (e.g. WaterML 2.0, GroundWaterML 2), code translators for re-quests in JSON, SOAP, KVP and POX, a REST API and an extensive client interface for service configuration and data exploration. 52North releases new versions of the software every few months, the latest one (SOS 4.4.4) available since December 6, 2018.
2.6.2. SensorThings API
In 2016 the OGC approved the SensorThings API as an official Web Standard. It provides an open standard-based and geospatial-enabled framework to store, manage , expose and use IoT-based sensor observation data over the web. The SensorThings developers boast it furthers the development of premium quality, light-weight ser-vices that cover a broader spectrum of applications. This lowers the risks, time and cost across IoT device life cycles and enhances compatibility in device-to-device and device-to-application connections (Open Geospatial Consortium, 2016).
2.6.2.1. SensorThings data model
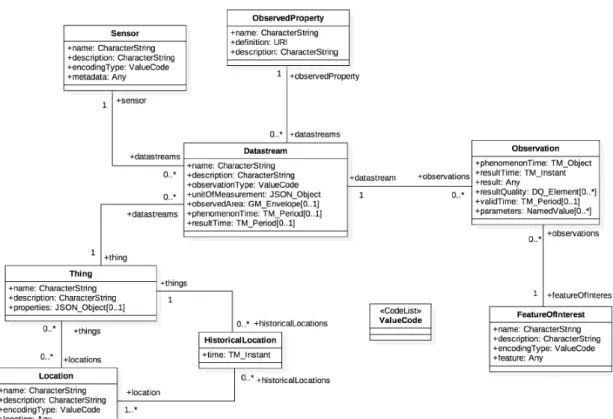
The SensorThings API data model is based on the OGC Observation & Measure-ment model. It consists of a set of interrelated entities, depicted in Figure 2.3. In contrast to SOS, entities are encoded using JSON format.
Brief specifications of the entities as described in the SensorThings API manual in Open Geospatial Consortium (2016) are provided below:
• Thing: The Thing entity follows the definition by the International Telecom-munication Union (ITU): ”...with regard to the Internet of Things, a thing is an object of the physical world (physical things) or the information world (virtual things) that is capable of being identified and integrated into communication networks”.
1http://www.supsi.ch/ist (Accessed 19.02.2019) 2https://52north.org (Accessed 19.02.2019)
2. Background
• Location: Contains information about the location associated with a corre-sponding Thing and includes geographical information using GeoJSON en-coding.
• HistoricalLocation: Provides the times of the current and previous Locations of a Thing.
• ObservedProperty: Specifies the observed phenomenon of measurements. • Datastream: Represents the logical grouping of a set of observations and are
associated with a single Thing, a single observedProperty and a single Sensor. • Sensor: Represents the instrument that observes a property or phenomenon.
A Sensor can be associated with multiple datastreams.
• FeatureOfInterest: The Feature of Interest (FoI) is the feature being observed. In many cases the FoI can be identical to the Location of a Thing. In the case of remote sensing, it can be the geographical area or volume being sensed. • Observation: Representation of the act of measuring the value of a property
at a specified time. Each Observation is associated with a single datastream.
2. Background
2.6.2.2. SensorThings operations
SensorThings API data and metadata can be created, read, updated and deleted with the HTTP protocol (POST, GET, PATCH, DELETE). Each entity has a unique ID and is accessible through the REST API using URLs. The URLs can be chained to access interrelated entities and can be extended using a large set of query parameters to pinpoint the desired JSON objects, as in the example query URL below.
http://elcano.init.uji.es:8082/FROST-Server/v1.0/Things(2)/ Datastreams(12)/Observations?$select=phenomenonTime,result&$ filter=overlaps(phenomenonTime,2018-11-28T00:00:00.000Z/ 2018-12-10T00:00:00.000Z)
The example URL presented above requests the observations produced in the Datastream with ID = 12, associated with the Thing with ID = 2. Furthermore, it will only consider observations between 2018-11-28 and 2018-12-10 and only select the phenomenonTime and result attributes for the output JSON.
2.6.2.3. SensorThings implementations
There are several server implementations of the SensorThings API available as open source software. Among the most established are the following:
• GOST : Go SensorThings was developed by Geodan 3 in Golang (Go) pro-gramming language. The implementation development is still ongoing, but it features the complete SensorThings Sensing functionality and includes a dashboard for data visualisation.
• Mozilla-SensorThings: The Mozilla Corporation started developing a Node implementation of SensorThings, but the development has been stalled since February 2017.
• FROST : The Fraunhofer Open-Source SensorThings (FROST) was devel-oped by the Fraunhofer IOSB 4 (Institute of Optronics, System Technologies and Image Exploitation) in Java. FROST-developers are still working on the project to extend its features in accordance to the OGC SensorThings API 3www.geodan.com (Accessed 19.02.2019)
2. Background
Web Standard.
2.6.3. Web Thing API
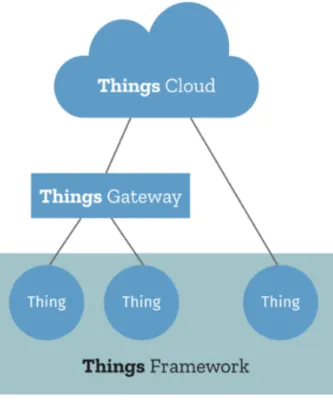
In June 2017 the Mozilla Corporation revealed their activity in building the Web of Things. In February 2018, it announced the kick-off of Project Things, an experi-mental framework of software and services for connecting IoT devices to the web. Project Things consists of three core components: The Things Gateway, the Things Cloud and the Things Framework.
Figure 2.4.: Mozilla - Project Things5
In order to connect these services Mozilla is developing the Web Thing API. The Web Thing API proposes a plain JSON serialisation to describe Things and a HTTP and WebSockets protocol binding. Both are meant to complement W3C abstract data model and API for the Web of Things. Mozilla’s Project Things provides utility for the Web Thing API for major programming languages including Java, Node.Js, Python and Arduino. While the plain standard does not support time series data storing and exploration, there have been projects to extend the API to use time series databases.
2. Background
2.6.3.1. Web Thing data model
The Web Thing API is designed to make a highly configurable device network. Web Thing API defines embedded devices as Things. Things can be assigned unlimited Properties, Actions and Events:
• Thing: Representation of a physical device within the World Wide Web. • Properties: Web Thing properties represent a single property of a device.
These can be configured to be read-only or writable. A property can take different data types (boolean, integer, array etc.) in JSON format, but can also be images or video streams.
• Actions: Actions represent functions that can be carried out on a device. This can be to adjust device properties or to affect a required change of state. • Events: A device can emit events that may occur at a certain change of state,
3. SEnviro for Agriculture
Agriculture has been a fundamental industry since the dawn of humanity. Over mil-lennia it has been subject to constant change due to human efforts of improvement. Today, the global human population is greater than ever before and the importance of developing more efficient agricultural systems is considered of paramount im-portance. Innovative agricultural systems apply integration of various technologies, such as automated systems, wireless communication, sensor systems and mobile ap-plications, eventually enabling the IoT in the agricultural domain (Kamilaris et al., 2016).
This chapter contains an introductory section for state of the art IoT applica-tions for Smart Farming, then provides a detailed description of the SEnviro for Agriculture project, which was selected as use case scenario for the development of this master thesis.
3.1. Smart Farming
Like in several other fields the IoT shows great potential in transforming the agri-cultural industry by connecting it to the web. Embedded WSN enable new methods to observe and interact with physical objects and promise unprecedented ways to obtain, organise and consume information. Research projects in IoT and WSN applications for agriculture have been numerous in recent decades.
In an example project for monitoring vineyards, Burrell et al. (2004) developed a prototype for sensing nodes communicating with farmers using Short Message Service (SMS) communication. The system focuses on temperature and humidity readings and is built on open software and hardware. An Arduino1 board with an added GPRS shield2 provides GSM digital cellular network support.
A further example using Arduino microcontrollers in smart farming is presented in Devi et al. (2018), an irrigation support system for farmers in India. The developed WSN nodes include temperature and humidity sensors and a WiFi module to send observations to a web server, which farmers can access remotely. A GSM module also sends SMS notifications when observations reach threshold levels.
1www.arduino.cc (Accessed on 12.02.2019)
3. SEnviro for Agriculture
Zhou et al. (2011) propose a sensor network system that connects agriculture to the IoT, focusing on system reliability, longevity, remote management, interoper-ability and low cost. Sensor nodes in farmlands and greenhouses periodically take relevant environmental measurements, which are collected by a relay node and sent to the communication server via a gateway instance. On the server data is stored in a database, where it is analysed by a Decision Support System (DSS) that pub-lishes relevant guidance for farmers such as notification and alerts. The system hardware and software rely mostly open source products. The ATmega12813 mi-croprocessor unit and AT86RF2304 RF transceiver ensure power-efficient processing and long-range communication in sensor and relay nodes. TinyOS5low-power proto-cols guarantee resource efficiency on software level. The study shows high potential in open-source products for agricultural IoT applications, especially for setting up links among agronomists, regardless of their geographical location.
Smart Agriculture has also been applied in plant disease detection, such as in the research done in Mauri et al. (2011). This project takes a remote sensing approach to detect disease indicators in vineyard foliage. The proposed WSN consists of nodes equipped with sensors taking pictures of vines, which then are processed by the node in the field. If leaf status anomalies, such as a high percentage of brown leaves, are detected the node sends a message to the farmer via a relay node. The Netgear WNDR37006 wireless router provides the necessary processing capacity for on-site image processing.
In a further application of smart farming in viniculture by Anastasi et al. (2009). The system combines two WSNs, one for monitoring vineyards and other for moni-toring the wine cellars. Field node sensors measure temperature, light exposure (e.g. Photosythetically Active Radiation) and humidity and additional sensing units on the border of the field measure wind speed and direction. Nodes in the winery mea-sure temperature and relative humidity, which are necessary parameters to control ambient conditions for wine aging. Field nodes are built on the TelosB7 due to its broad transmission range. Cellar nodes consist of MICAz8 motes coupled with an MTS3109 sensor board. Data from both networks is sent to a central storage unit and analysed for further decision support. The project results triggered farmers to perform corrective actions on their agricultural fields.
3www.microchip.com/wwwproducts/en/ATmega1281 (Accessed on 12.02.2019) 4www.microchip.com/wwwproducts/en/AT86rf230 (Accessed on 12.02.2019) 5http://webs.cs.berkeley.edu/tos (Accessed on 12.02.2019)
6www.netgear.com/support/product/WNDR3700v1.aspx#docs (Accessed on 12.02.2019) 7www.advanticsys.com/shop/mtmcm5000msp-p-14.html (Accessed on 12.02.2019)
8www.memsic.com/userfiles/files/Datasheets/WSN/micaz datasheet-t.pdf (Accessed on
12.02.2019)
3. SEnviro for Agriculture
3.2. SEnviro components
Based on the SEnviro project from 2015, SEnviro for Agriculture takes the previ-ously developed environmental monitoring system further and puts it into an agri-cultural context. The primary objective of SEnviro for Agriculture is to design and develop a full system for monitoring crops to improve the production quality and yield. The SEnviro for Agriculture monitoring system specialises in observing vine-yards. For the sake of simplicity, the remainder of this chapter refers to SEnviro for Agriculture merely as SEnviro.
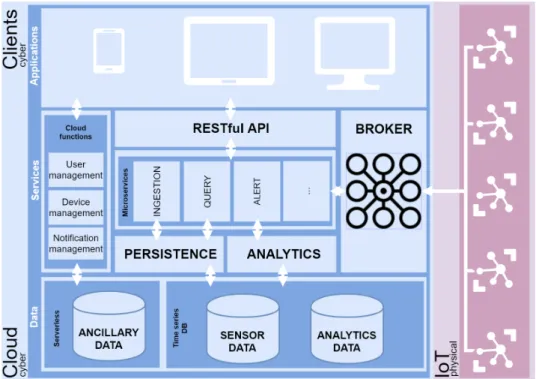
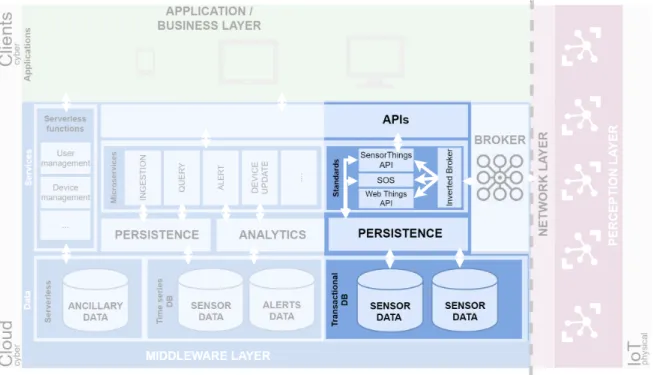
Figure 3.1 shows an overview of the SEnviro architecture and components.
Figure 3.1.: Schema of SEnviro architecture; the pink section represents physical components, the blue section represents software elements
3.2.1. SEnviro nodes
At hardware level (represented in the pink section in Figure 3.1), the SEnviro sen-sorised platform was designed as a smart object, consisting of a similar hardware assembly as the platform presented in Trilles et al. (2015). SEnviro node compo-nents can be categorised into four groups depending on their functions: core, sensors, power supply, and communication.
com-3. SEnviro for Agriculture
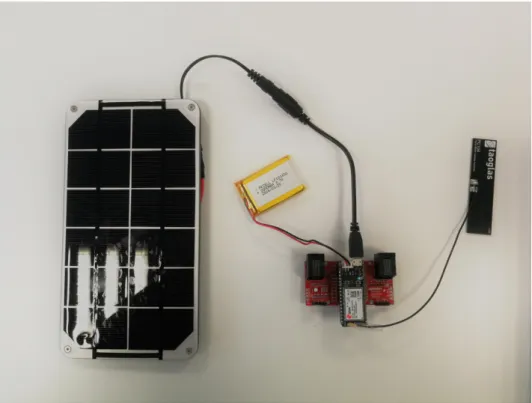
ponents. More concretely, SEnviro nodes were enhanced by using the Electron Particle10board as a core. The Electron board has an open source design with high performance. Figure 3.2 shows the core of the proposed node.
Figure 3.2.: SEnviro node core and power supply assembly
Among other improvements to the system presented in Trilles et al. (2015), SEn-viro nodes in SEnSEn-viro for Agriculture most significantly excel in communication capabilities. The Electron Particle provides 2G and 3G connectivity, rendering it possible for SEnviro nodes to be successfully deployed in any area with mobile data coverage.
SEnviro nodes support Over-The-Air updates for internal software. This feature enhances node maintenance profoundly, allowing nodes to support potential future functionalities and behaviours without having to visit nodes at their locations and do updates manually. To offer an energetically efficient solution a 3.4W solar panel with a lithium battery of 2200 mA provides power to the system. An energy policy for standalone nodes is used to optimise the battery life. The Particle API exposes the battery readings, which are used to adapt the rate of data deliveries depending on the rate of charging and the battery level. To ensure unique node identification, a Quick Response (QR) code is assigned to each SEnviro node, which is used by SEnviro Connect (see 3.2.2 SEnviro Connect ) to register a device and start collecting data. A 3D model was designed for a 3D-printable protective box, which encloses hardware components and shields them from external hazards.
3. SEnviro for Agriculture
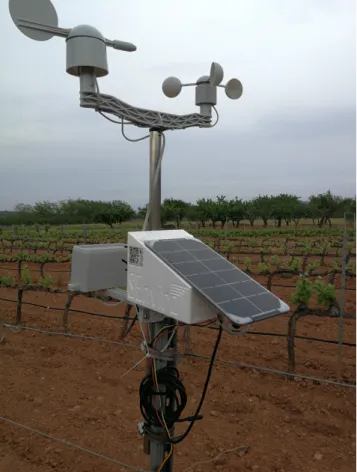
SEnviro nodes contain sensors for measuring eight meteorological phenomena directly related to plant diseases. These include soil and air temperature, soil and air humidity, atmospheric pressure, rainfall, wind direction and speed. The fully assembled and deployed SEnviro node is represented in Figure 3.3.
Figure 3.3.: Fully assembled and deployed SEnviro node.
3.2.2. SEnviro Connect
The blue section in Figure 3.1 represents all the elements of SEnviro Connect with their corresponding relations. SEnviro Connect can be divided into three layers: data, services and applications. The most important part resides in the services layer, which can be split into five different components: broker, micro-services (RESTful API), persistence module, analytics module and cloud functions.
Firstly, the broker is used as a bridge to connect SEnviro nodes with the soft-ware platform. The broker is based on a RabbitMQ11 instance, which supports MQTT publish-subscribe messaging (see 2.4 Machine-To-Machine Communication & MQTT ).
3. SEnviro for Agriculture
The micro-services component is used to provide various functionalities or capa-bilities that SEnviro Connect offers as a platform. In the current state of develop-ment, three functionalities have been considered: ingestion, query and alert. The ingestion ensures the access and importation of sensor data for immediate use, ergo for analysis or storage in a database. The query micro-service can retrieve sensor data to be consumed by clients from the application layer using a RESTful API. Finally, alert micro-service collects all alerts produced by the analytics module to transfer this information to final layer.
All micro-services were developed using Micro12. Micro can build cloud-native appli-cations with ease and provides an opinionated framework for developing appliappli-cations with a pluggable architecture.
The third component is the persistence module, which is responsible for storing and retrieving data from SEnviro nodes. Ingestion and query micro-services are con-nected to this module. Both components are provided by InfluxDB13, an open-source time series database. InfluxDB Go-based database management system optimised for fast, high-availability storage and retrieval of time series data.
The analytics module’s primary objective is to define and execute analytics over the incoming sensor data from SEnviro nodes. The alert micro-service connects with this module, since alerts may depend on results from the analytics. This feature was installed using Kapacitor, an extension of InfluxDB for alerting and data processing. SEnviro Connect provides two kinds of analytics: one type focuses on the SEnviro node to monitor the node state, such as the battery or last connection, while the other type handles the vineyard use case. The latter bases its analytics on disease models and is supported by a task alert in the analytics module. These task alerts are defined using bibliographic works and depend on meteorological phenomena. All the analytics work in real-time. When a new observation arrives, it is used to calculate each task alert and triggers an alarm for certain types of events. Each task alert is defined using TICKscript.
To conclude with the service layer, different cloud functions were defined to manage and build some ancillary features, such as user, device or notification man-ager. The user manager allows creating, editing, and removing users and assigning SEnviro nodes. The device manager creates, edits and removes SEnviro nodes. Moreover, the notification manager can launch notifications to clients, such as new alerts detected by the analytics module.
The data layer is responsible for the storage of all required data for the system, including data from the nodes, from analytics or from auxiliary data. It consists
12https://micro.mu (Accessed on 19.02.2019) 13www.influxdata.com (Accessed on 12.02.2019)
3. SEnviro for Agriculture
of two Influx databases for time-series data and a Firebase database, following a serverless approach.
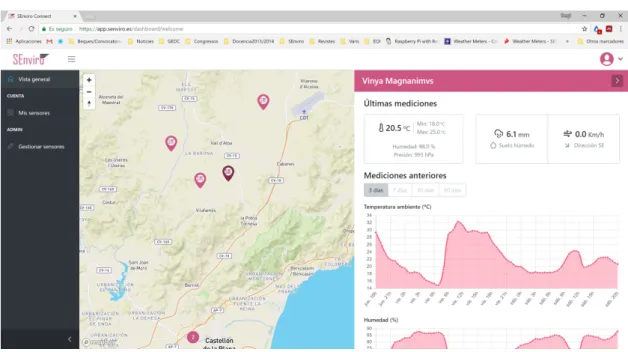
Finally, the applications layer exposes the system on the client side. An Angular14 web application built on modern web technologies, such as HTML5, JavaScript or Cascading Style Sheets (CSS) includes a responsive client that adapts to a device’s properties (desktop, mobile or wearable). The web application provides two basic functionalities. One focuses on data visualisation, including a map and graph view of nodes and historical sensor data, and alerts from the disease models. The other provides a node management interface where users can insert nodes and edit their details.
Figure 3.4.: A screen-shot of the SEnviro Connect view to visualise observations and alerts.
3. SEnviro for Agriculture
4. Methodology
As mentioned in section 2.6 Open & Sensor Web Standards, there are currently sev-eral organisations doing research in IoT standards and many solutions for a variety of use cases are now openly available on the Internet. Although it is planned to increase interoperability by open standard integration in SEnviro for Agriculture, this feature is still missing in the project. This study aims at increasing SEnviro’s interoperability by integrating a selection of Web Standards, contrasting the results and selecting the most adequate.
For this project it was decided to select one implementation each for the OGC’s SOS and SensorThings API Web Standards and integrate them into the present SEnviro architecture. These two standards fulfil the needs of environmental mon-itoring applications, which require spatial referencing and time series functionality in order to see how observed phenomena behave over time on the monitored feature of interest. The experiment was taken further by deploying the Web Thing API by Mozilla. In contrast to OGC Sensor Web Standards, Web Thing does not support time series data storing. Nevertheless, it was considered of importance to evaluate the feasibility of extending this still emerging Web Standard for environmental mon-itoring applications. To embed the instances into the SEnviro architecture, adapter scripts were created that connect them with the SEnviro message broker.
For determining the suitability of the individual standards, the three standards instances were deployed in a dedicated experimental environment and compared in an in-depth contrasting juxtaposition. Section 4.1 Experimental Environment de-scribes the environment and architecture for the instance deployment. In section 4.2 Deployed Web Standard Implementations, the Open Web Standard implementations included in the study are described, highlighting their key features, semantics and characteristics. The final section of this chapter explains the process of comparing the Web Standard deployments.
4. Methodology
4.1. Experimental Environment
All Web Standard implementations and their adapters were deployed on Elcano, a Linux server provided by the Institute for New Imaging Technologies (INIT) at Universitat Jaume I.
Elcano hosts webapps for several projects, which run on the Docker Enterprise Container Platform, a powerful open source tool for operating-system level virtu-alisation. Docker allows developers to create, deploy and run applications in con-tainers. Containers package applications with all the necessary components, such as libraries, files and other dependencies, avoiding incompatibilities and assuring that the application runs smoothly in any other Docker environment. Further-more, unlike conventional Virtual Machines, Docker containers are run by a single operating-system kernel, making them more lightweight.
A Docker container for each Web Standard application (see 4.2 Deployed Web Standard Implementations) was deployed on Elcano. Web standard adapter scripts (see 4.3 SEnviro Web Standard Integration) connecting the applications to SEnviro RabbitMQ Broker (located on a dedicated SEnviro server) were also deployed as separate Docker containers, distributing the incoming observations from SEnviro nodes to the corresponding services. In Figure 4.1 the highlighted section represents the addition to the already established SEnviro architecture.
4. Methodology
4.2. Deployed Web Standard Implementations
The following sections shed light on the Web Standard applications deployed for this project. The first section introduces 52North-SOS, based on the OGC’s Sensor Observation Service. It is followed up by FROST, an implementation of the OGC’s SensorThings API. For the Web Thing API there was no need to deploy a previously established implementation, so it was omitted in this section.
4.2.1. 52North-SOS
Creating an application that makes use of the Sensor Observation Service would demand time and resources which are outside of the scope of this study. Instead, an existing SOS-implementation was selected and deployed.
During the selection process istSOS 2.3.1 and 52North-SOS 4.4.2 were deployed and tested for SEnviro in separate Docker containers. istSOS was favoured at the beginning since it is written in Python, which was also used for the development of the adapter scripts. Eventually 52North-SOS was selected due to several reasons.
4. Methodology
52North-SOS features the SOS test client (see Figure4.2), a tool for generating and testing sample documents for HTTP requests using several formats including JavaScript Object Notation (JSON). Since JSON objects are structured the same way as Python dictionaries, process automation could be rendered more efficiently in the SEnviro integration. The decision was also influenced by the fact that 52North-SOS includes tested Docker configuration files, while with ist52North-SOS2 the Docker files had to be created using outdated installation manuals, making the deployment prone to errors. A further reason for the selection of 52North-SOS was the lack of istSOS2 documentation concerning certain necessary operations. Lastly, also the fact that 52North-SOS is under ongoing development implies more promising support by the developer community.
52North-SOS runs on an Apache Tomcat1 web server and stores data in a PostGIS extended PostgreSQL database. The downloadable bundle also includes a user-friendly data exploration tool, the Helgoland Client. The extensive and user-user-friendly application includes map and diagram visualisation for SOS data (see Figures 4.3 and 4.4). After some trials with the latest SOS version at the time of the selection process (52North-SOS 4.4.3) and encountering some inconsistencies with the setup in Docker, 52North-SOS 4.4.2 was successfully deployed. The updates in version 4.4.3 were considered as irrelevant to the scope of this study.
Figure 4.3.: Helgoland Map View
4. Methodology
4. Methodology
4.2.2. FROST-Server
After some in-depth research about potential SensorThings implementations, FROST was eventually selected for the integration into SEnviro. The decision was mostly based on the fact that FROST includes all the features in the OGC compliance test suite and passed it with a full success rate (see Figure4.1). It includes MQTT extensions for creating and updating data. Furthermore, FROST provides extensive documentation and deployment resources for easy deployment in Docker environ-ments.
Conformance Class Reference Implemented Test
Status
Sensing Core A.1 Yes 6/6
Filtering Extension A.2 Yes 42/42
Create-Update-Delete A.3 Yes 14/14
Batch Request A.4 Yes 0/0
Sensing MultiDatastream Extension A.5 Yes 18/18
Sensing Data Array Extension A.6 Yes 3/3
MQTT Extension for Create and
Update A.7 Yes 4/4
MQTT Extension for Receiving
Updates A.8 Yes 13/13
Table 4.1.: FROST OGC Compliance Testing Status2
By default the java-based FROST-Server application launches an Apache Tom-cat, but there are also options to configure web server specifications. The application stores all data in a PostGIS extended PostgrSQL database. Fraunhofer IOSB pro-vides several FROST packages, which either comprise HTTP and MQTT operations together or keep them as individual bundles. FROST-Server does not include data visualisation applications, focusing more on the core functionalities of the API.
4.3. SEnviro Web Standard Integration
As mentioned in chapter 3 SEnviro for Agriculture, SEnviro nodes transmit new values for observed phenomena using MQTT within a RabbitMQ broker. In order to store data in real-time, incoming messages from SEnviro must caught, decoded, processed and posted to the deployed open standard instances. In turn, the deployed standard instances have to be configured for SEnviro beforehand in order to correctly store the data. This involved general service configuration and inserting stations and
4. Methodology
their properties, which was automated using setup scripts and JSON files containing the information for each station.
For the integration of Web Standards into SEnviro, adapters had to be created for each Web Standard. In the case of the the OGC standards, SOS and SensorThings, this consisted connecting to the SEnviro Broker to intercept messages, decode them, convert them into the right format and post them to the corresponding service via the REST API. Scripts were created to in Python for these operations, making use of Pika, a Python library to connect to RabbitMQ brokers.
RabbitMQ uses topics to categorise messages, which can be chained into routing keys. Pika uses the routing key to intercept messages with specific topics by using * (star) to substitute exactly one word and # (hash) to substitute zero or more words. SEnviro routing keys are structured as current/stationID/phenomenon. For instance, a SEnviro routing key could be:
current/4e0022000251353337353037/SoilHumidity
Figure 4.5.: SEnviro message queuing example schema
In the example in Figure 4.5, queues Q1 and Q2 within SEnviro Connect inter-cept messages from SEnviro nodes for the message consumers C1and C2. Q1 queues all messages from station 270043001951343334363036. Q2 queues all messages from all stations.
As mentioned above, the SEnviro node ID and the phenomenon specification is included in the routing key. SEnviro byte messages are structured in a JSON manner and contain only a time and a value attribute, as demonstrated in the following routing key and example message:
current/4e0022000251353337353037/AirTemperature {"time":"2019-01-17 13:43:00","value":"6.581871"}
4. Methodology
deployed SEnviro nodes and access the node and phenomenon details via the routing key. Using this information, a new message is created and sent to the corresponding web service.
4.3.1. SOS Adapter
After establishing the connection with the SEnviro broker and decoding the message and routing key of incoming messages, there are several steps necessary to create an insertObservation request. 52North-SOS supports JSON encoding for inserting observations and a JSON template for this operation is available on the test client of the 52North-SOS interface. This file is loaded into the adapter script and the mandatory information for a successful request inserted. Details about procedures (sensor ID), offerings and observed properties are retrieved from the intercepted messages. However, some essential information for a successful insertObservation request could not be extracted. Therefore, some workarounds had to be included in the adapter.
Firstly, the unit of measurement in SOS is required in each encoded observation document. This requires including a Python dictionary within the adapter script, matching each phenomenon with the corresponding unit of measurement. Secondly, SOS observation insertions also require the coordinates where the observation was created. Therefore, an external JSON file containing objects with the station ID and the corresponding coordinates as attributes has to be loaded into the script.
Once all the information for the observation insertion is complete it is posted to SOS via HTTP POST request.
4.3.2. SensorThings Adapter
Similar to the SOS adapter, the FROST adapter establishes a connection with the SEnviro broker, reads the incoming messages and uses information from the messages to create a JSON object to post to the FROST server with a HTTP POST. Here the challenge lies in posting to the correct datastream.
In order to post to the correct datastream, the corresponding datastream ID is required in the target URL. The script does this by first requesting all datastream IDs with their corresponding names via HTTP GET request. Datastream names in the SEnviro FROST instance are defined as a combination of the node ID and the measured phenomenon, which are both present in incoming byte messages. The
4. Methodology
script selects the datastream ID by matching the information from the message with the datastream name. The following example target URL posts observations to the datastream with ID = 11:
http://elcano.init.uji.es:8082/FROST-Server/v1.0/ Datastreams(11)/Observations
4.3.3. Web Thing Adapter
The Web Thing Adapter created for SEnviro data combines the Python libraries Pika by RabbitMQ and Webthing by Mozilla IoT.
Before launching the instances, the script defines a Thing class for SEnviro nodes. Properties for the Thing’s location and for the observed phenomena were added to this class, including details for data types, maximum and minimum values, units of measurement and property descriptions. An action was also defined for changing the Thing’s coordinates, allowing users to update a node’s location in case it is relocated. This action can be executed with a HTTP POST of a JSON object containing the new coordinates using the API’s REST interface.
Since the RabbitMQ connection and the Web Thing server must run simultane-ously, the threading library was used to run both instances on two parallel threads. When messages come in from the SEnviro Broker, the routing key from the incoming messages is used to update property values for the corresponding SEnviro node.
4. Methodology
4.4. Comparative Analysis
The aim of this document is to provide insight into the potential of open standard integration to enhance environmental monitoring application interoperability. This is firstly achieved in a qualitative approach to explore the different Web Standard implementations’ capabilities, comparing their core operations and identifying po-tential strengths and weaknesses. Secondly a quantitative analysis is conducted to quantify performance differences for the deployed instances. This involves mon-itoring performance parameters on the server and contrasting the results of the individual instances.
4.4.1. Performed operations
To compare the deployed Web Standard instances, a set of operations are executed for the services. For the qualitative analysis the request semantics are contrasted for data insertion, deletion, updates and retrieval. For the quantitative analysis, observation retrieval requests were scaled to obtain increasing quantities of data.
4.4.1.1. Data management
The deployed services for the corresponding Web Standards needed to be config-ured for SEnviro before any observations could be stored. This included inserting instances representing stations and their properties. Once the services were set up correctly, observations could be inserted using the corresponding adapters. Apart from data insertion operations, basic operations for deleting and updating data were investigated for the different services.
4.4.1.2. Accessing metadata
Accessing information about the sensors or sensor systems is a core operation for any monitoring service, providing the means to identify the origin of observations, the location of the monitoring station and information about the monitored parameters. The two example operations below show ways to access detailed information about procedures, representing sensor systems in SOS, and things, representing embedded devices in the SensorThings API:
4. Methodology • 52North-SOS:
– Operation: SOS - describeSensor (HTTP POST) – URL: http://elcano.init.uji.es:8084/52n-sos-webapp/service – Post data: { "request":"DescribeSensor", "service":"SOS", "version":"2.0.0", "procedure":"270043001951343334363036", "procedureDescriptionFormat": "http://www.opengis.net/sensorml/2.0" } • FROST (HTTP GET): http://elcano.init.uji.es:8082/FROST-Server/v1.0/Things(2) ?$expand=Locations,HistoricalLocations,Datastreams/ ObservedProperty,Datastreams/Sensor
• Web Thing API (HTTP GET):
http://elcano.init.uji.es:5000/0
4.4.1.3. Observation retrieval
Arguably the most important feature in any monitoring service is accessing the stored time series data to visualise phenomena’s behaviour over time. This is not possible for the Web Thing API by default, since it does not support time series data storing. FROST and 52North-SOS have different approaches obtain observations. The operations were contrasted according to their semantics and on a performance level.
52North-SOS supports all the standard SOS operations, but their data visuali-sation tool, the Helgoland Client, uses its own request method and API to obtain sensor data. Helgoland is therefore analysed separately to show its potential in the response time analysis. The data retrieved by the Helgoland Client contains