Photosynthetic epibionts and endobionts of
Pacific oyster shells from oyster reefs in rocky
versus mudflat shores
Laurent Barille´1*, Anthony Le Bris1,2, Vona Me´le´der1, Patrick Launeau3, Marc Robin2, Ioanna Louvrou4, Lourenc¸o Ribeiro1,5
1 Laboratoire Mer Mole´cules Sante´ (EA2160), Institut Universitaire Mer et Littoral (FR_C 3473), Universite´ de
Nantes, Nantes, France, 2 LETG-Geolittomer (UMR 6554, CNRS), Institut Universitaire Mer et Littoral (FR_C 3473), Universite´ de Nantes, Nantes, France, 3 Laboratoire de Plane´tologie et Ge´odynamique (UMR 6112, CNRS), Institut Universitaire Mer et Littoral (FR_C 3473), Universite´ de Nantes, Nantes, France,
4 Department of Ecology and Systematics, Faculty of Biology, Panepistimiopolis, University of Athens,
Athens, Greece, 5 Marine and Environmental Sciences Centre, Faculdade de Ciências, Universidade de Lisboa, Lisbon, Portugal
*laurent.barille@univ-nantes.fr
Abstract
The Pacific oyster, Crassostrea gigas (Thunberg), is the main bivalve species cultivated in the world. With global warming enabling its reproduction and larval survival at higher lati-tudes, this species is now recognized as invasive and creates wild oyster reefs globally. In this study, the spatial distribution of photosynthetic assemblages colonizing the shells of wild C. gigas was investigated on both a large scale (two contrasting types of reefs found in mudflats and rocky areas) and a small scale (within individual shells) using a hyperspectral imager. The microspatial distribution of all phototrophs was obtained by mapping the Nor-malized Difference Vegetation Index (NDVI). Second derivative (δδ) analyses of hyperspec-tral images at 462, 524, 571 and 647 nm were subsequently applied to map diatoms, cyanobacteria, rhodophytes and chlorophytes, respectively. A concomitant pigment analy-sis was carried out by high performance liquid chromatography and completed by taxonomic observations. This study showed that there was high microalgal diversity associated with wild oyster shells and that there were differences in the structure of the phototropic assem-blages depending on the type of reef. Namely, vertically-growing oysters in mudflat areas had a higher biomass of epizoic diatoms (hyperspectral proxy atδδ462nm) and were mainly colonized by species of the genera Navicula, Nitzschia and Hippodonta, which are epipelic or motile epipsammic. The assemblages on the horizontal oysters contained more tycho-planktonic diatoms (e.g. Thalassiosira pseudonana, T. proschkinae and Plagiogrammopsis
vanheurckii). Three species of boring cyanobacteria were observed for both types of reef: Mastigocoleus testarum, Leptolyngbya terrebrans, and Hyella caespistosa, but the second
derivative analysis at 524 nm showed a significantly higher biomass for the horizontally-growing oysters. There was no biomass difference for the boring chlorophyte assemblages (δδ647nm), with two species: Eugomontia testarum and Ostreobium quekettii observed for both types of reef. This study shows that oyster shells are an idiosyncratic but ubiquitous habitat for phototrophic assemblages. The contribution of these assemblages in terms of
a1111111111 a1111111111 a1111111111 a1111111111 a1111111111 OPEN ACCESS
Citation: Barille´ L, Le Bris A, Me´le´der V, Launeau P,
Robin M, Louvrou I, et al. (2017) Photosynthetic epibionts and endobionts of Pacific oyster shells from oyster reefs in rocky versus mudflat shores. PLoS ONE 12(9): e0185187.https://doi.org/ 10.1371/journal.pone.0185187
Editor: Linsheng Song, Institute of Oceanology,
Chinese Academy of Sciences, CHINA
Received: May 9, 2017 Accepted: September 7, 2017 Published: September 21, 2017
Copyright:© 2017 Barille´ et al. This is an open access article distributed under the terms of the Creative Commons Attribution License, which permits unrestricted use, distribution, and reproduction in any medium, provided the original author and source are credited.
Data Availability Statement: All relevant data are
within the paper and its Supporting Information files.
Funding: PhD grant was supported by the
Ministère Franc¸ais de la Recherche et de l’Enseignement Supe´rieur and awarded by the Fe´de´ration de Recherche IUML FRCNRS of the University of Nantes in collaboration with the cluster of excellence LabexMER”. Anthony Lebris received the grant. COSELMAR project was supported by IFREMER and Nantes University and
biomass and production to the functioning of coastal areas, and particularly to shellfish eco-systems, remains to be evaluated.
Introduction
Pacific oyster reefs are a growing habitat in temperate coastal areas, spreading in Europe and America, with a polarward expansion [1]. The speciesCrassostrea gigas was introduced
world-wide for aquaculture following overexploitation of native populations. As a consequence of global warming, cultivated oysters began to reproduce at higher latitudes, with increasingly successful larval settlement leading to the development of these biogenic reefs [2]. These reefs are mainly known for the clusters of vertically-growing oysters, particularly in soft-bottom environments such as tidal flats where they create three-dimensional hard-substrate structures [3]. However, oysters can also colonize large rocky areas where they grow horizontally, form-ing a sform-ingle layer tightly adherform-ing to the substrate [4]. The structure of the habitat is therefore diverse, as are the shells themselves, characterized by variations in surface roughness, color, and sediment deposition. Microspatial variations influence the nature of the biota colonizing hard surfaces [5], and oysters shells have long been known to host a large diversity of organ-isms [6]. Most studies, however, have focused on colonization by metazoa and macrophytes [7,8] and less attention has been paid to microalgae and cyanobacteria.
Epibiosis is a widespread phenomenon in the marine environment [9]. According to Walker and Miller [10], the organisms that infest the surfaces of organic substrates are referred to as epibionts while those that live mostly or wholly within the tissues or body parts of other living or dead organisms (basibionts) as endobionts. The body surface of many metazoans is colonized by epibionts, including microepibionts such as bacteria, microalga, protozoa [11]. Boring communities are also prominent features, colonizing a variety of hard substrates not only of inorganic origin (limestones, dolostones, ooliths) but also calcified parts of organisms (skeletons or thalli) such as mollusk shells, calcareous red algae, coral reefs, bones, foraminifera (e.g. [12–15]). Mollusk shells are ubiquitous in coastal areas and provide abundant habitats whose importance and functional role have been overlooked [16]. Within the Mollusca phy-lum, bivalve and gastropod shells host photosynthetic communities composed of cyanobacte-ria, diatoms, chlorophytes and rhodophytes [17–21]. An early description of the microflora colonizing oyster shells reported the presence of cyanobacteria and chlorophytes [22]. Diatoms and spores/propagules of rhodophytes were later observed as significant component of oyster microepibiont phototrophic assemblages [6,7,23]. In most studies dealing with microepi-bionts, quantification is an issue and the analysis of the spatial distribution at microscale has seldom been addressed. In fact, the phototrophic communities found on mollusk shells share many similarities with epilithic microalgae found in rocky areas. There are constraints with the conventional sampling techniques based on the removal of rock surfaces [24], which are not adapted to studying the microspatial distribution characterizing epilithic biofilms. This promoted the emergence of remote-sensing techniques at visible near-infrared (VNIR) wave-lengths to analyze these biofilms at a high spatial resolution with a non-invasive approach [25].
Non-intrusive analytical techniques based on the spectral properties of phototrophic assem-blages have been increasingly used to describe marine biofilms [26,27]. The spectral reflectance (ratio of upwelling radiance and downwelling irradiance) of microalgal assemblages at VNIR wavelengths is essentially related to the phytopigment composition, abundance, and substra-tum contribution [28,29]. Most of these studies used field-spectroradiometers with a high
co-funded by the Regional Council of the “Pays de la Loire”. Laurent Barille´ received the grant.
Competing interests: The authors have declared
spectral resolution (more than a hundred spectral bands), which can resolve subtle phytopig-ment absorption bands, but did not provide any spatial information. Some authors [25,30] tested various VNIR imaging systems with a high spatial resolution to map intertidal epilithic microalgae, but the low spectral resolution of the different sensors prevented the mapping of the diversity of the main microalgal classes. This can be overcome by imaging hyperspectral cameras characterized by a high spectral and spatial resolution [31]. This technique has the potential for innovative applications in ecology, such as the spectral camouflage of crabs [32], or the microspatial variability of calcified macroalgae epiphytes [33]. Hyperspectral imaging technology should find wide applications in the study of photosynthetic microepibionts but, to our knowledge, this is the first time it has been applied to map oyster shells at microscale.
The present study investigated spatial variations in the structure of the phototrophic assem-blages growing on the shells of host oysters,Crassostrea gigas, using hyperspectral imagery.
The spatial distribution of photosynthetic assemblages colonizing wild oyster shells was inves-tigated on both a large scale (two contrasting types of reefs found in mudflats and rocky areas) and a small scale (within individual shells). We quantified the epibiont and endobiont assem-blages using vegetation indices commonly used in remote-sensing to monitor the biophysical and biochemical properties of vegetation. A concomitant pigment analysis of these photosyn-thetic assemblages was carried out by high performance liquid chromatography and completed by taxonomic observations. We hypothesized that the structure of these assemblages (biomass, diversity) should differ between the two types of reefs and that microscale hyperspectral imag-ing is an appropriated technique to detect these differences.
Materials and methods
Wild oyster reefs were sampled in Bourgneuf Bay, located south of the Loire estuary on the French Atlantic coast (47˚02’ N, 2˚07’ W). In this macrotidal bay with a maximum tidal ampli-tude of 6 m, 100 km2of the total bay area (340 km2) is intertidal with large mudflats [34]. It is characterized by highly turbid waters associated with the resuspension of soft-bottom sedi-ments. The annual mean concentration of suspended particulate matter is of the order of 150 mg.L-1with extreme values >1 g.L-1during spring tides [35]. The Pacific oysterCrassostrea gigas (Thunberg), has been cultivated there since its massive importation starting in 1972, to
replace the Portuguese oysterCrassostrea angulata decimated by a viral disease [36]. This bay was considered the northern boundary ofC. gigas expansion at the time of its introduction
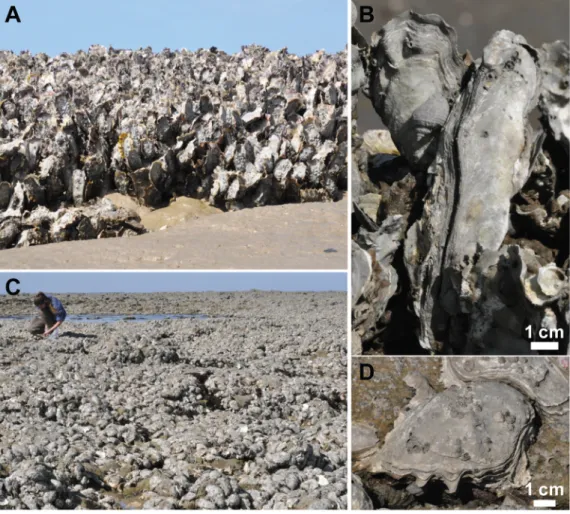
into Europe [37]. Two distinct forms of oyster reefs were observed: clusters of vertical oysters found in rocky spots within a mudflat, building three-dimensional dense reefs in the muddy area (Fig 1A and 1B) and oysters growing horizontally creating large flat reef structures in the rocky areas (Fig 1C and 1D). In the muddy area, oyster shells were dark and partially covered by mud, while in rocky areas, there was a lower sediment deposition and oyster shells had a brighter color. One hundred oysters were sampled (50 from each reef type) and brought back to the lab in a cooler for hyperspectral, chromatographic and taxonomic analyses. Only the flat upper valves were kept and analyzed. We calculated the average surface of oyster shells to check if surface variations should be taken into account. All valves were visually free of any macrophyte vegetation but were often colonized by barnacles (Chthamalus spp. and Elminius modestus) which were the main epibiotic macrofauna. Sediment particles were often deposited
on the shells, particularly for the vertical oyster reef. Bright white shells from dead oysters washed onto the shore were also collected and processed to obtain a spectral reference devoid of any type of biocolonization. There was no specific permissions required to sample oysters in the study site which belong to the public maritime domain. The field study did not involve endangered or protected species.
Hyperspectral image analysis
Images were acquired with a HySpex camera set up in the laboratory. The HySpex VNIR 160 camera has a spectral resolution of 4.5 nm and a spectral sampling of 3.7 nm in 160 contiguous channels between 400 and 950 nm. The camera was fixed at 1 m above the samples to obtain square pixels with a spatial resolution of around 200μm. Samples were isolated from the ambi-ent light and the artificial illumination was controlled by two halogen quartz lamps (100 W). The optimal integration time was 20 ms to improve the signal-to-noise ratio. Reflectance was first determined by measuring the ratio between the light reflected from a calibrated 20% gray reference panel (Spectralon) and the light reflected by oyster shells. Reflectance was calculated by dividing each pixel of the image by the mean intensity of Spectralon in the 400–950 nm wavelength range. Minimum Noise Fraction (MNF) transformations combined with a band pass filter of 9 nm were applied to images to remove noise and redundant information. Polygon layers were applied to individualize and extract the pixels corresponding to each oyster. A con-tinuum removal process was applied to eliminate background influences due to structural varia-tions (color, microrelief) of the shell itself and to retrieve absorption features that are specific to photosynthetic and accessory pigments [38]. The upper envelope of spectra (= continuum) was
Fig 1. Typology of Crassostrea gigas wild oyster reefs. (A) Clusters of vertical oysters surrounded by
mudflats; (B) Details of vertically-growing oysters; (C) Horizontal colonization of large rocky areas; (D) Details of a horizontally-growing oyster; the shell is colonized by a few cirripeds.
modeled by straight lines that are tangential to local maxima of reflectance in the NIR at 750– 850 nm. Each spectrum was then divided by its corresponding straight line.
Spectral analysis
Ratio and hyperspectral (derivative analysis) vegetation indices commonly used in remote sensing have been applied to map phototrophic epibionts [28]. The NDVI (Normalized Dif-ference Vegetation Index) was first calculated using the chlorophylla absorption band at 673
nm. Since this pigment is ubiquitous among all photosynthetic organisms, this index was used to analyze the spatial distribution of the whole community of photosynthetic epibionts: NDVI = (R750–R673)/ (R750+ R673), where R750is the reflectance at 750 nm in the near
infra-red (NIR) and R673is the red reflectance at 673 nm. A lower threshold at 0.05 was applied to
exclude shell pixels without photosynthetic organisms but which displayed a positive NDVI. This value was chosen because it corresponded to the maximum NDVI found for the shells with no biocolonization. However, this index could not identify the main classes of photo-synthetic organisms that colonize oyster shells. The analysis of the literature cited in the introduction gave usa priori clues about the classes of photosynthetic organisms that could
be expected on Mollusk shells, either epilithic or endolithic: diatoms, chlorophytes, cyano-bacteria and rhodophytes, the latter in the form of spores and propagules. Second derivative (δδ) were therefore calculated for each image and second derivatives peaks were used to identify these main classes:δδ524andδδ647for cyanobacteria and chlorophytes, respectively
[39],δδ571for rhodophytes [29] and we identifiedδδ462for diatoms. Positive second
deriva-tive values at the four diagnosis wavelengths were used to attribute each pixel to a group, but the same pixel could be attributed to multiple groups if more than one wavelength had posi-tive values [33]. The second derivative spectra of dead oyster shells which did not show any peak at the wavelengths corresponding to the absorption bands of the different pigments, were used as a control.
High performance liquid chromatography (HPLC) analysis
After radiometric measurements, the imaged shells (24 for each reef type) were immediately frozen at -80˚C and lyophilized for 72 hours for pigment extraction. Then the two types of shell (horizontalvs. vertical) were entirely crushed into a powder and subjected to the same
extraction protocol which was carried out in the dark with 5 to 15 mL of 95% cold buffered methanol (2% ammonium acetate) for 15 min at -20˚C. After centrifugation (at 3000 g, 15 min, 4˚C), the supernatant was filtered using a Whatman membrane filter (0.2μm) and diluted volume-to-volume in 1M ammonium acetate. A volume of 100μL was injected for 30 min in a Waters SunFire C18 column (4.6 mm x 150 mm; 3.5μm particle size) preceded by a pre-column. The elution solvents used were 1M of ammonium acetate in methanol (20:80) and methanol-acetone (60:40). The solvent gradient adapted by [40] was a flow rate of 1 mL. min-1. Pigment extracts were analyzed using their elution times and their absorption charac-teristics measured by a photodiode array at 440 nm and a fluorescence detector. Peaks were calibrated with standards from Sigma and DHI (DHI, Hørsholm, Denmark), but the HPLC protocol was not suitable for hydrosoluble pigments (e.g.phycocyanin and phycoerythrin)
characteristic of rhodophytes. HPLC data were qualitatively used here to identify the main classes of photosynthetic microorganisms and help in the identification of the second deriva-tive peaks. However, the concentration of fucoxanthin was quantified to analyse the relation-ship with the second derivative at 462 nm.
Taxonomic identification
True-boring endobionts. Shell-boring endobionts were identified with a Carl
Zeiss Axiostar Plus light microscope and pictures were taken of preserved shell samples (in 4% formaldehyde solution) using a Sony Cybershot DSC-F717 digital camera. The epibiotic macrofauna was removed and shell fragments were dissolved using Pereny’s solu-tion (10% HNO3, 0.5% Cr2O3, 95% C2H5OH in proportion 4:3:3; [22]). The extracted
euen-doliths were observed on glass slides from 10 randomly chosen vertical and horizontal oysters.
Photosynthetic epibionts. The remaining shells were brushed and washed individually
but in order to recover enough material for the analysis, all the sediment collected with 20 hor-izontal oysters was pooled and the same was done for 20 vertical oysters. Samples were kept in disposable polypropylene tubes to which was added 1 mL of a 2.5% glutaraldehyde solution and were stored at 4˚C for later processing. Cells were extracted from the sediment using an isopycnic separation technique with silica sol Ludox HS-40 (Sigma-Aldrich, USA) that sepa-rates the organic material from mineral particles [41]. Preliminary observations revealed that diatoms dominated the epilithic assemblages. Samples were carefully oxidized by hydrogen peroxide (30%) at 90˚C. Permanent slides were made from the cleaned diatom material mounted in Naphrax (Northern Biological Supplies Ltd., Ipswich, UK). Diatom identification and cell counts were made in 50 randomized ocular fields using a 100x oil immersion objective of a Zeiss Axioskop 50 microscope, equipped with differential interference contrast optical microscopy. More than 400 frustules/valves were counted, with the abundance of each taxon expressed as its relative percentage. Diatom identification mostly followed [41,42] and refer-ences therein. Relative abundances of diatom taxa were also allocated to four size classes, which comprised the very small (<100μm3
), small (100–250μm3
), medium-sized (250– 1000μm3) and large (>1000μm3) diatoms (cf. [43]). Cell biovolume was either directly obtained from previous works [43,44] or calculated from biometric measurements made dur-ing the LM observations followdur-ing [45]. A growth-form was attributed to each individual taxon following literature search on the auto-ecology of the species and genera. Three growth forms were considered attached to the substrate (i.e. oyster shells), namely: adnate,
tube-dwell-ing and stalked diatoms, whereas four other growth forms were considered non-attached or free-living: epipelic, motile epipsammic, planktonic and tychoplanktonic diatoms. Species richness (S = number of species) and Shannon diversity index (H’) were calculated to describe the assemblages.
Statistical analysis
The normality and heteroscedasticity of data distributions were checked before each analysis using the Shapiro-Wilk test. Student t-tests were used to test the null hypothesis that there were no differences between mean NDVI and shell surfaces between horizontal and vertical oysters. F-test of equality of variance was used to test the hypothesis that NDVI variability was the same between the two types of oyster shell. The comparison between second derivative val-ues was tested with PERMANOVA. The null hypothesis stated that there were no differences between colonized and dead oyster shells used as a control. The alternative hypothesis postu-lated that they were significant differences with dead oyster shells.A posteriori pairwise
com-parisons between the two types of oyster shell was then run to test if they were significant differences at four wavelengths (δδ462,δδ524,δδ571,δδ647). Spearman correlations were
calcu-lated between second derivatives to test the relevance ofδδ462as a proxy to identify diatoms.
Ethics statement and human subjects
The individual inFig 1Cof this manuscript has given written informed consent (as outlined in PLOS consent form) to publish these case details.
Results
Spectral reflectance and vegetation index
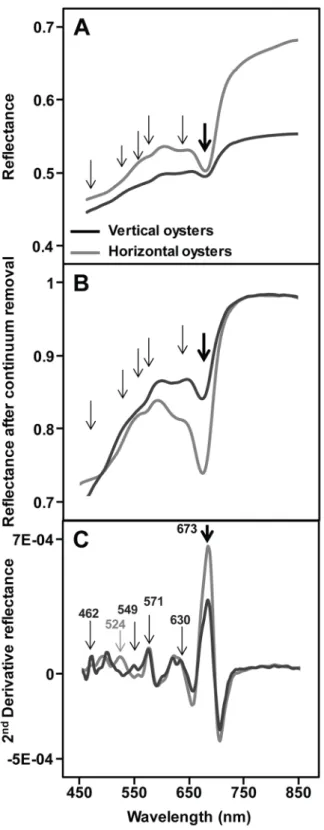
The spectral shapes of the two types of oyster were similar overall in the VNIR wavelength range, but the darker vertical oyster shells always showed a lower albedo. A marked absorption band at 673 nm, characteristic of chlorophyll-a was systematically observed on the shells (Fig 2A, thick arrow). Since no macroalgae were visible at the surface of oyster shells whatever their type (vertical.vs. horizontal), this 673 nm absorption band was associated with microscopic
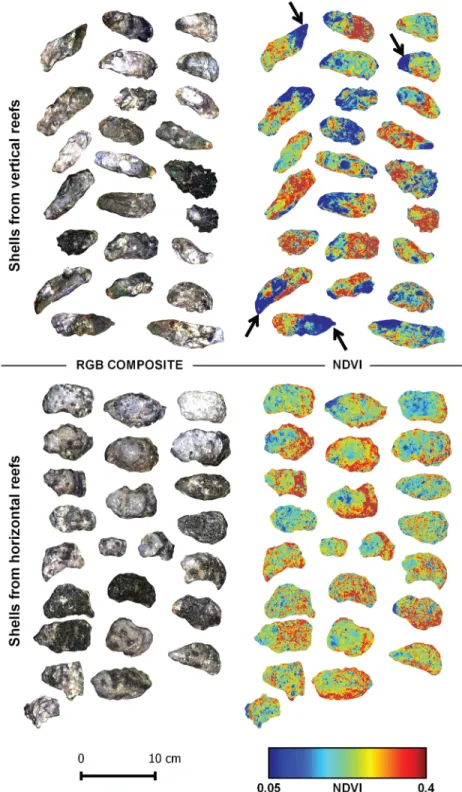
organisms that could only just be detected visually for some shells by a greenish or light purple coloration of the shell. Other absorptions could be observed between 450 and 650 nm, some corresponding to slope changes in the reflectance spectra (Fig 2A, thin arrows). After the retrieval of their continuum, vertical and horizontal oyster reflectance spectra presented a sim-ilar shape in the near infrared (Fig 2B), but differences remained in the visible range. Second derivative spectra enhanced the changes in the reflectance spectra and were used to identify pigment absorptions (Fig 2C). The high resolution imaging of vertical and horizontal oyster shells confirmed the systematic presence of photosynthetic organisms with NDVI values rang-ing from 0.05 to 0.4 (Fig 3). The mean NDVI of vertical oyster shells was significantly higher than that of horizontal oyster shells (t-test, t = -2.47,p-value = 0.01; df = 48). The coefficient of
variation was also higher for vertical oysters: 0.15vs. 0.11 for horizontal oysters, and there was
a significant difference between the variances of the two series (Fisher-test, F = 0.47,
p-value = 0.03, df = 24). Vertical oysters were characterized by a contrasting NDVI distribution with areas of low NDVI values often located next to the shell umbo, and corresponding to zones where oysters were attached to another within a cluster (Fig 3, arrows). Horizontal oys-ters displayed a less heterogeneous NDVI distribution. There was no statistical difference between the average surface of horizontal (22.5 cm2) and vertical (22.3 cm2) oysters (t-test, t = -0.17, p-value = 0.86, df = 48).
Pigment analysis and second derivatives
The diversity of lipophilic pigments detected by HPLC was common to both types of shell (verticalvs. horizontal) (Table 1). The simultaneous detection of different pigments could be used to identify the main algal classes. Fucoxanthin and chlorophyllc were marker pigments
for diatoms. Neoxanthin, violaxanthin, and siphonaxanthin indicated the presence of chloro-phytes (green algae).
Myxoxanthophyll and canthaxanthin indicated the presence of cyanobacteria. While some pigments were not specific to one class (e.g. zeaxanthin, β-carotene), fucoxanthin,
myxox-anthophyll and chlorophyllb could be specifically associated with diatoms, cyanobacteria and
chlorophytes respectively. These three groups were detected on both types of shell. Two of the biomarker pigments, myxoxanthophyll and chlorophyllb, could be identified on reflectance
spectra by the second derivative values (δδ) corresponding to their main absorption bands at 524 nm and 647 nm, respectively. We used 462 nm to identify diatoms, rather than 549 nm, often used for fucoxanthin, since 462 nm was more discriminant in these shell mixed assem-blages. The second derivative at 462 nm (δδ462) was indeed significantly correlated toδδ549
(r = 0.80, P<0.01, n = 48). Moreover, the relevance of 462 nm was also confirmed by a signifi-cant relationship betweenδδ462and the concentration of fucoxanthin measured by HPLC
Fig 2. Example of spectral signatures of vertically- and horizontally-growing oysters obtained with the HySpex imaging spectrometer. (A) Reflectance spectra; the thick arrow indicates the chlorophyll a 673
nm absorption band. The thin arrows indicate other absorption features, sometimes corresponding to slope variations. (B) Removed-continuum spectra (seeMaterial & methods). (C) Second derivative spectra with the main peaks associated with diagnostic wavelengths: 462, 549, and 630 nm for diatoms, 524 nm for
cyanobacteria, 571 nm for rhodophytes (seeMaterial & methods). https://doi.org/10.1371/journal.pone.0185187.g002
Fig 3. RGB composite color images (left) and corresponding NDVI spatial distribution images (right) of Pacific oyster shells sampled in two contrasting oyster reefs. Arrows indicate low NDVI areas close to
the shell umbo.
(S1 Fig). For rhodophytes, there were no specific pigments identified by HPLC since the detected pigments zeaxanthin andβ-carotene could belong to other classes. The second deriva-tive at 571 nm was thus used as a spectral marker of the water-soluble pigment phycoerythrin common in red algae. For each oyster, distribution maps of the second derivatives at the four wavelengths (δδ462,δδ524,δδ571,δδ647) were obtained to estimate the distribution of the main
photosynthetic organisms: diatoms, cyanobacteria, rhodophytes, and chlorophytes, respec-tively (Fig 4). Each group displayed visually heterogeneous spatial distributions without any obvious spatial pattern. The comparison between the mean derivative values calculated from the two series of high resolution images of oyster shells indicated that vertical and horizontal
Table 1. Pigment composition detected on oyster shells by HPLC. Pigment in bold represents pigments that were exclusive to taxonomic groups.
Source: Jeffrey et al., [57].
Retention Time (min) Peak Name Algal division
3.4 Chlorophyllide b Degradation products of chlorophyll b
4.8 Chlorophyllide a Degradation products of chlorophyll a
6.1 Chlorophyll c Diatoms 6.9 Siphonaxanthin Chlorophytes 7.8 Fucoxanthin Diatoms 8.2 Neoxanthin Chlorophytes 8.6 Violaxanthin Chlorophytes 9 Myxoxanthophyll Cyanobacteria
9.7 Zeaxanthin Rhodophytes Cyanobacteria Chlorophytes
10.4 Lutein Chlorophytes
11.7 Canthaxanthin Chlorophytes Cyanobacteria
13.3 Chlorophyll b Chlorophytes
14.7 Chlorophyll a All photosynthetic algae
20.6 β,β-caroten Chlorophytes, Diatoms, Rhodophytes
https://doi.org/10.1371/journal.pone.0185187.t001
Fig 4. RGB composite color image of a vertical oyster shell (left) and the corresponding four second derivative images.
Diagnostic wavelengths: 462 nm for diatoms, 524 nm for cyanobacteria, 571 nm for rhodophytes, 647 nm for chlorophytes. Second derivate values are multiplied by 104.
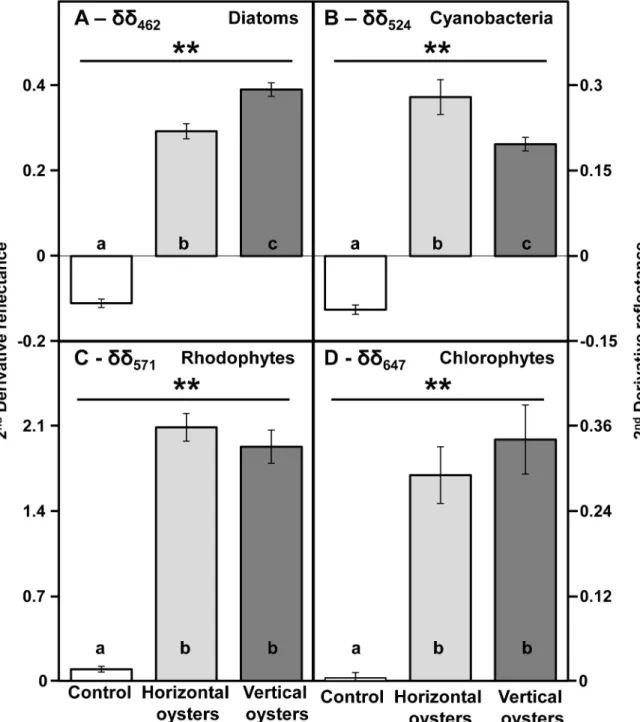
oysters were always significantly different from the control (Fig 5, PERMANOVA,
p-value = 0.001, df = 71). Pairwise comparisons between vertical and horizontal oysters indicated significant differences forδδ462(t = 4.62,p-value = 0.001) and δδ524(t = 5.24,p-value = 0.001)
(Fig 5A and 5B). However, there was no significant difference forδδ571(test = 1.84,
p-Fig 5. Comparison of mean second derivatives between vertically-growing (dark grey) and horizontally-growing (light grey) oysters. Diagnostic wavelengths: 462 nm for diatoms, 524 nm for cyanobacteria, 571 nm for rhodophytes, 647 nm for
chlorophytes. Bright white shells from dead oysters washed onto the shore were used as a control with no biocolonisation. Means are presented with their confidence intervals at 95%. The double asterisk indicates a highly statistically significant difference (p<0.01) with the control. Within each graph, bars sharing the same letter are not significantly different (PERMANOVA, pairwise tests, p>0.05).
value = 0.073) andδδ647(t = 1.64,p-value = 0.111) (Fig 5C and 5D). Diatoms showed a higher
second derivative for vertical oysters but it was the opposite for cyanobacteria. There were no significant correlations between any second derivative for horizontal oysters, and only one sig-nificant correlation betweenδδ462(diatoms) andδδ524(cyanobacteria) for vertical oysters
(rPearson= 0.44, P<0.05, n = 24).
Taxonomic identification
Endobionts. Six taxa of true-boring endobionts were identified as colonizing within the
oyster shells (Fig 6). There were three cyanobacteria:Mastigocoleus testarum Lagerheim
(Hap-alosiphonaceae, Nostocales),Leptolyngbya terebrans Bornet et Flahault (Leptolyngbyaceae,
Synechococcales) andHyella caespitosa Bornet et Flahault (Hyellaceae, Pleurocapsales) and
three chlorophytes:Ostreobium quekettii Bornet et Flahault (Ostreobiaceae, Bryopsidales), Eugomontia sacculata Kornmann (Gomontiaceae, Ulotrichales) and a Codiolum phase of an
undetermined ulotrichalean green alga. These six species of endobionts were observed for both types of shell except for theCodiolum phase which was only observed with horizontal
oysters.
Epibionts. Epibionts were essentially dominated by diatoms. Both diatom assemblages
had a total of 40 genus and 93 taxa (Table 2). The complete list of taxa identified is given in supporting information (S1 Table). The assemblage collected on the vertical oyster shells was composed of 83 taxa (H’ = 3.8) whereas 53 taxa were found on the horizontal oyster (H’ = 3.1).
About 46% of the identified taxa were common to both assemblages and corresponded to 76% and 91% of cumulative abundances for vertical and horizontal oysters, respectively. The vertical oysters were mainly colonized by species of the generaNavicula, Nitzschia and Hippo-donta (e.g. Navicula recurva; N. diserta and HippoHippo-donta caotica), which are epipelic or motile
epipsammic; whereas the assemblages in the horizontal oysters contained mostly tychoplank-tonic diatoms (e.g. Thalassiosira pseudonana, T.proschkinae and Plagiogrammopsis van-heurckii) (S1 Table). With regard to growth forms, both assemblages had similar ratios of about 2 attached to 8 free-living diatoms, but there was a clear shift from epipelic diatoms (40% of relative abundance) in the vertical oyster assemblage to one dominated by tychoplank-ton (36%) in the horizontal oyster assemblage (Fig 7). In the latter assemblage, attached dia-toms were mostly composed by stalked and adnate forms, whereas in the vertical oysters these diatoms were evenly distributed between the stalked, adnate and tube-dwelling forms. Whilst planktonic diatoms were slightly more abundant in the horizontal oysters, the converse occurred with the motile epipsammic growth form. Perhaps the clearest difference between the two assemblages concerned the size-class distribution. The assemblage in the horizontal oysters was dominated by small (100–250μm3) and very small (<100μm3) diatoms, corre-sponding to 36% and 43% of the cumulative abundances, respectively. In the vertical oyster, the assemblages were dominated by small (39%) and medium-sized diatoms (250–1000μm3), which attained 32% of the cumulative relative abundance.
Discussion
An old story behind an intriguing spectral shape
Wild oyster shells originating from two types of reef (vertically-vs. horizontally-growing
oys-ters) were imaged in this study with a high spectral (160 spectral bands in the VNIR) and spa-tial resolution (pixel ofca. 200 μm). Hyperspectral imagery has the advantage of providing
rapid and non-invasive measurements compared to traditional sampling methods [31]. In this study, we used a laboratory equipment but there are portable imagers that can be used in the field or onboard vessels [31,32]. Compared to spectroradiometers [27,28,39] or fluorometric
Fig 6. Photosynthetic euendoliths in host shells of Crassostrea gigas, light microscope. (A-F)
Cyanobacteria. (A-C) Hyella caespitosa. (A) General view of the boring pattern near the surface of the oyster shell. (B) Short pseudofilaments. (C) Boring and almost perpendicular to the shell surface long pseudofilament. (D)Filament of Leptolyngbya terebrans. Note the trichome (D) and the empty mucilaginous sheath (E). (F-G)
Mastigocoleus testarum. Note on (F) a short lateral T-branch bearing a terminal heterocyte (arrow head) and an
infrequent intercalary heterocyte (arrow). (G) Multicellular ’hair-like’ filament (arrow). (H-K) Chlorophytes. (H) Richly branched filaments of the siphonal Ostreobium quekettii. (I) Euendolithic Codiolum phase with multiple rhizoids of an undetermined ulotrichalean algae. (J-K) Eugomontia sacculata. (J) Endolithic, septate, branched, sporophyte filaments of Eugomontia sacculata with the formation of numerous large sporangial swellings. (K) Sporangium detached from the sporophyte filament of E. sacculata. Note the layered walls. Scale bars: 10μm (B, D, E F, G, H); 20μm (A, C, J, K); 50μm (I).
probes such as the BenthoTorch [47] that are instruments essentially measuring a single-point, hyperspectral imagers are able to resolve the spatial distribution of photosynthetic assemblages at a scale of millimeters. This can overcome the inherent spatial variability of benthic microal-gal assemblages [31,47,48]. All shells, whatever the reef type, displayed an intriguing spectral shape with marked absorption features in the visible combined with a reflection in the NIR,
Table 2. List of the diatom genus found in vertical and horizontal oysters, including details of their relative abundance (%), and their life-forms.
Taxa Species Horizontal
shells
Vertical shells
Life-form
Achnanthes 2 0.5 2.1 Stalked
Amphora 4 3.6 5.4 Motile epipsammic
Astartiella 1 0.2 0.6 Motile epipsammic
Berkeleya 1 0 2.3 Tube-dwelling Biremis 1 0 0.2 Adnate Caloneis 2 0.5 0.6 Epipelic Catenula 1 0 0.4 Adnate Cocconeis 2 0.5 0.2 Adnate Cyclostephanos 1 0 0.2 Plankton Cyclotella 2 0.9 0.4 Plankton Cymatosira 1 0.7 2.3 Tychoplankton Delphineis 1 3.8 1 Stalked Dimeregramma 2 0.2 0.4 Stalked Diploneis 2 0 0.6 Epipelic Entomoneis 1 0 0.2 Epipelic Eunotogramma 1 4.3 1.2 Adnate
Fallacia 3 0 1 Motile epipsammic
Fragilaria 1 0 0.2 Stalked
Gyrosigma 4 0.7 1.4 Epipelic
Halamphora 1 0 0.4 Motile epipsammic
Hippodonta 1 1.6 6.2 Motile epipsammic
Hyalodiscus 1 0 0.2 Plankton Licmophora 1 0 0.2 Stalked Luticola 1 0 0.2 Epipelic Melosira 1 0 0.4 Tychoplankton Minidiscus 1 0.5 0 Plankton Navicula 19 25.3 41.4 Epipelic Nitzschia 9 9 10.5 Epipelic Odontella 1 0 0.2 Tychoplankton Climaconeis 1 0 0.2 Epipelic Opephora 3 2.9 1.2 Stalked Paralia 1 0.2 0.4 Tychoplankton Parlibellus 1 0.5 0.2 Tube-dwelling Plagiogrammopsis 2 10.4 5.6 Stalked Planothidium 5 2 3.5 Adnate Psammodictyon 1 0 0.8 Epipelic Rhaphoneis 1 0.2 0.6 Stalked Surirella 1 0 0.2 Epipelic
Thalassiosira 7 31.2 5.8 Plankton & Tychoplancton
Tryblionella 1 0.5 0.8 Epipelic
which could be that of a soil or a rock. This type of spectral signature was first observed for a shellfish habitat of the eastern oysterCrassostrea virginica [49], using a high resolution field-spectroradiometer. These authors speculated about the presence of algal growth on the shells based on the characteristic chlorophylla absorption at 675 nm without any further analysis of
the nature of this vegetation. A similar observation was made for the shells of wild Pacific oys-tersCrassostrea gigas but the presence of photosynthetic microepibionts was suspected, since
no visible macroalgae could be seen colonizing the shells [4]. Moreover, when these authors tried to map clusters of vertical oysters with an airborne hyperspectral sensor, significant con-fusion arose with pixels of microphytobenthos from the muddy surrounding areas. Microphy-tobenthic biofilms are generally dominated by diatoms, but they can also be composed of cyanobacteria, chlorophytes and euglenids [50]. This study confirmed that all oyster shells ana-lyzed were colonized by photoautotrophs, since each individual shell was characterized by a positive NDVI value. Remote sensing of oyster reefs and intertidal shellfish habitats in general is a recent research field open to innovative approaches. For example, Synthetic Aperture Radar (SAR) exploiting microwaves has also been tested to map oyster and mussel beds in Europe [51] and South Korea [52] as a complement to VNIR wavelengths. To our knowledge our study is the first to analyze a mollusk shell reflectance at such a high resolution. Spectral resolution was important for selecting relevant wavelengths to identify assemblage
Fig 7. Percentage contribution of diatom life-forms to total diatom abundance found on oyster shells from two contrasting oyster reefs.
composition, while high spatial resolution reduced the problem of patchiness and mixed pix-els. The result obtained in this study will be useful for remote sensing at larger spatial scales, providing informations for building spectral libraries of wild oysters and improving the air-borne hyperspectral mapping of oyster reefs [4]. However, behind these new data collected with a state-of-the-art hyperspectral imager, there lies an old story. In fact, the 19th-century sci-entists gave detailed descriptions of shell-boring microorganisms [22,53]. Bornet and Flahault [22] analyzed the shells of European oystersOstrea edulis in a location just ten kilometers
north of our study site and found several endolithic cyanobacteria and chlorophytes. Many sci-entists of the 20thcentury completed these early works on shell-boring photosynthetic micro-organisms [20]. Among them Schodduyn [6] who studied the epibionts colonizing the surface of European oyster shells found rhodophytes and diatoms. From these early works and in spite of different shell structures, two types of colonization, epizoic and shell-boring, and four clas-ses of photosynthetic microepibionts: cyanobacteria, chlorophytes, diatoms and rhodophytes (spores and propagules) coulda priori be expected on the shells of the Pacific oyster Crassos-trea gigas.
Diversity of photosynthetic epibionts
Spectral reflectance has been successfully used to determine the dominant taxonomic groups of microphytobenthos (e.g.[39,54,55]) but has not previously been applied to unravel the diver-sity of phototrophic epibionts. In fact, the use of a hyperspectral imaging system to map the spatial distribution of photosynthetic organisms at microscale is a recent technological applica-tion [56]. The derivative analysis of reflectance spectra enabled the separation of four absorp-tion features, which were used to obtain spatial distribuabsorp-tion maps and quantitative
information about the four groups of photosynthetic epibionts and endobionts. Namely,δδ462,
δδ524,δδ571, andδδ647were used to map diatoms, cyanobacteria, rhodophytes and
chloro-phytes, respectively. Diatoms are generally identified by their absorption bands at ~550 nm for fucoxanthin [38,39] or at ~632 nm for chlorophyllc [40] but, in this study, there were overlaps with other absorptions and a more discriminant wavelength, less sensitive to taxonomic mix-ing, was chosen at 462 nm. Cyanobacteria were identified by the absorption band at 524 nm for myxoxanthophyll, rhodophytes at 571 nm for phycoerythrin, and chlorophytes at 647 nm for chlorophyllb [29,33,57]. There can be a shift of a few nm compared to the cited references, due to the different spectral resolution of the sensors. All oysters showed pixels with positive second derivative peaks at the four diagnostic wavelengths indicating the presence of the four groups of photosynthetic microorganisms on oyster shells. However, as illustrated inFig 4, the microspatial distributions differed between each group. With the overall lack of correlation between the second derivative wavelengths, we speculated that the biomass/distribution of each group may not be related. It was beyond the scope of this work to quantify these spatial structures rigorously, but a further examination of second derivative hyperspectral images is a possibility. HPLC data were used to confirm the presence of the four groups of photosynthetic microorganisms and their diagnostic pigments. Oyster shells from the two types of reef shared a common pigment composition. All oysters had the pigment biomarkers of diatoms (chloro-phyllc and fucoxanthin), cyanobacteria (canthaxanthin and myxoxanthophyll) and
chloro-phytes (chlorophyllb and neoxanthin) [57].β-Carotene and zeaxanthin are common in rhodophytes, but are also present in the other groups. Zeaxanthin, more specific, can also be found in cyanobacteria and has led to an ambiguous diagnosis in mixed assemblages [39]. Phy-coerythrin, not detected by the HPLC protocol used here, was probably responsible for the marked second derivative peak at 571 nm present in rhodophytes [33]. However, a caveat should be made here since this pigment can also be detected in cyanobacteria, with many
benthic species being red [58]. Nevertheless, in this study it was associated with the character-istic rhodophyte reflectance spectrum, with its double-hump shape between 550 and 675 nm, as can be seen inPorphyridium purpureum [29]. A possible overestimation of the rhodophytes cannot, however, be excluded, particularly for mixed spectra. This would obviously be related to the presence of phycoerythrin in the endolithic cyanobacteria colonizing the shells. Raghu-kumar and colleagues [59] detected no phycoerythrin in cultures ofLeptolyngbya terebrans
col-onizing various mollusk shells. Performing spectral and HPLC measurements on a pure endolithic cyanobacteria culture (e.g.;[60]), would certainly improve the remote-sensing approach developed in this work. The consistency of these spectral and pigment data was rein-forced by taxonomic identifications. Three species of cyanobacteria were observed in the shell-boring assemblages (Mastigocoleus testarum, Leptolyngbya terebrans and Hyella caespitosa) as
well as three species of chlorophytes (Eugomontia sacculata, Ostreobium quekettii and a Codio-lum phase of an unidentified ulotrichalean alga). Leptolyngbya terebrans, Eugomontia sacculata
andOstreobium quekettii are cosmopolitan forms [20,61]. The former (syn.Plectonema tereb-rans) was the dominant shell-boring phototroph in Crassostrea cucullata [59]. It should be noted that the simple architecture of photosynthetic microborers, with their few available mor-phological diagnostic features, may lead to an underestimation of their diversity. Recent stud-ies revealedvia metabarcording the molecular diversity for microsiphonous taxa of the order
Bryopsidales previously referred to asOstreobium spp. [62,63]. A total of 93 taxa of epizoic dia-toms were identified on wildC.gigas shells confirming the ubiquity and diversity of epizoic
diatoms associated with the Mollusca phylum [18,19,21,64]. This diversity was related to the type of oyster reef, as shown in the next section.
Difference between the two types of reef
At the macroscopic scale of a 1 m2pixel, Le Bris et al. [4] showed that variations in reef geome-try (three-dimensional in muddy areasvs. two-dimensional in rocky areas) and shell
bright-ness (brighter when growing horizontally) were responsible for distinct spectral signatures. However, the main differences appeared in the NIR, and the more subtle changes occurring at visible wavelengths and involving photosynthetic and accessory pigments were not explored. Microspatial hyperspectral imaging revealed a striking difference in shell colonization. The biomass of these assemblages was estimated using a widely used remote-sensing proxy, the Normalized Difference Vegetation Index [28]. Results showed that vertically-growing oysters were characterized by assemblages with a higher biomass. Moreover, the high spectral resolu-tion enabled a further analysis of which group of photosynthetic microorganisms was respon-sible for this biomass variation. The second derivative analysis has been successfully used to study microphytobenthos biofilms (e.g.[39,65]). We found that there were significant differ-ences between the two types of reefs forδδ462andδδ524, that are proxies for respectively diatom
and cyanobacteria biomass.δδ524was significantly higher in horizontally-growing oysters.
Since the same three species were observed for the two reef types, this suggests that there was mainly a difference in biomass.δδ462was significantly higher in vertically-growing oysters and
the diatom assemblages had a more established and typical benthic community constituted by epipelic and epipsammic life-forms. Horizontal oysters were characterized by a higher fraction of tychoplanktonic species, and seemed to be more influenced by the suspension-resuspension cycles [43]. The epipelic diatoms of the vertical oyster assemblages were medium-sized (250– 1000μm3), while theThalassiosira species in the horizontal ones were typically very small.
These findings are consistent with the physical conditions of the locations of the two types of reef: in the rocky area where the oysters grow horizontally, there is a stronger hydrodynamism with less sediment deposited on the shells. On the contrary, vertical clusters of oysters are
found near soft-bottom sediments, in areas of lower hydrodynamism. There, shells can be par-tially covered by muddy-sandy particles, which create a favorable substrate for epipelic and epipsammic species. The surprisingly high diversity of the two reef-type assemblages is proba-bly the result of the increased substrate heterogeneity at the surface of oyster shells. Sediments deposited or trapped in shell interstices create soft-bottom microhabitats that can be exploited by residents from the nearby mudflats and sandflats. However, vertical oyster shells were also rougher and it cannot be excluded that these microspatial shell variations influenced the struc-ture of the assemblages [5]. This would be consistent with the findings of D’alelio and col-leagues [18] who showed that an increasing structural diversity in various gastropod shells promoted a greater complexity of the associated epizoic diatom assemblages. Gutie´rrez and colleagues [16] pointed out that the provisioning of substrata was not the sole mechanism that may be responsible for an increase in species richness and we refer to their work for a compre-hensive overview. Eventually, if one considers the living oyster itself, the host-microbiont interaction appears even more complex since mollusks may also provide nutrients through the products of their catabolism (biodeposits coated with mucus, dissolved excretion) which can be used by phototrophs [66,67].
Conclusion
This study showed that high diversity of photosynthetic microorganisms was associated with wild oyster shells and that there were differences in the structure of the phototropic assem-blages depending on the reef typology. Namely, vertically-growing oysters in mudflat areas had a higher biomass of epizoic diatoms. There was also a higher biomass of cyanobacteria on horizontally-growing oysters in rocky areas. There were no differences for chlorophytes and rhodophytes. For the latter, the results were only based on remote sensing data since there were no microscopic observations of spores, propagules and/or of the euendolithicConchocelis
phase, the sporophyte of the red macroalgaePorphyra [68], known to colonize oyster shells [69]. A future improvement in the remote-sensing approach would be to collectConchocelis
spectral signatures. The next ongoing step is to quantify the biomass of the epizoic and shell-boring assemblages using quantitative HPLC data coupled with hyperspectral data. This would help to provide a first estimation of the biomass of primary producers associated with wild oys-ter shells and assess their contribution at the level of an ecosystem.
Supporting information
S1 Fig. Relationship between fucoxanthin concentration (expressed in mass of pigment per oyster shell surface) and second derivative peak at 462 nm. Second derivate values are
multiplied by 104. (PDF)
S1 Table. Detailed list of all diatom taxa found in vertical and horizontal oysters, including details of their relative abundance (%), and their life-forms.
(PDF)
Author Contributions
Conceptualization: Laurent Barille´, Anthony Le Bris, Marc Robin.
Formal analysis: Anthony Le Bris, Vona Me´le´der, Patrick Launeau, Ioanna Louvrou,
Lou-renc¸o Ribeiro.
Methodology: Anthony Le Bris, Vona Me´le´der, Patrick Launeau, Ioanna Louvrou, Lourenc¸o
Ribeiro.
Software: Patrick Launeau.
Supervision: Laurent Barille´, Marc Robin. Validation: Ioanna Louvrou.
Writing – original draft: Laurent Barille´.
Writing – review & editing: Laurent Barille´, Anthony Le Bris, Ioanna Louvrou, Lourenc¸o
Ribeiro.
References
1. Ruesink JL, Lenihan HS, Trimble AC, Heiman KW, Micheli F, Byers JE, et al. Introduction of non-native oysters: ecosystem effects and restoration implications. Annu Rev Ecol Evol Syst. 2005; 36: 643–689.
https://doi.org/10.1146/annurev.ecolsys.36.102003.152638
2. Thomas Y, Pouvreau S, Alunno-Bruscia M, Barille´ L, Gohin F, Bryère P, et al. Global change and cli-mate-driven invasion of the Pacific oyster (Crassostrea gigas) along European coasts: a bioenergetics modelling approach. J Biogeogr. 2016; 43: 568–579.https://doi.org/10.1111/jbi.12665
3. Troost K. Causes and effects of a highly successful marine invasion: Case-study of the introduced Pacific oyster Crassostrea gigas in continental NW European estuaries. J Sea Res. 2010; 64: 145–165.
https://doi.org/10.1016/j.seares.2010.02.004
4. Le Bris A, Rosa P, Lerouxel A, Cognie B, Gernez P, Launeau P, et al. Hyperspectral remote sensing of wild oyster reefs. Estuar Coast Shelf Sci. 2016; 172: 1–12.https://doi.org/10.1016/j.ecss.2016.01.039 5. Hutchinson N, Nagarkar S, Aitchison JC, Williams GA. Microspatial variation in marine biofilm
abun-dance on intertidal rock surfaces. Aquat Microb Ecol. 2006; 42: 187–197.
6. Schodduyn R. Observations sur la flore et la faune des coquilles des huıˆtres. Bull L’Institut Oce´an Monaco. 1931; 568: 1–20.
7. Haydar D, Wolff W. Predicting invasion patterns in coastal ecosystems: relationship between vector strength and vector tempo. Mar Ecol Prog Ser. 2011; 431: 1–10.https://doi.org/10.3354/meps09170 8. Korringa P. The shell of Ostrea edulis as a habitat. Arch Ne´erl Zool. 1954; 10: 32–146.https://doi.org/
10.1163/036551654X00122
9. Wahl M. Marine epibiosis. I. Fouling and antifouling: some basic aspects. Mar Ecol Prog Ser. 1989; 58: 175–189.
10. Walker SE, Miller W III. Organism-substrate relations: toward a logical terminology. Palaios. 1992; 7: 236–238.
11. Seckbach J, Dubinsky Z. All Flesh Is Grass: Plant-Animal Interrelationships. Springer Science & Busi-ness Media; 2010. p. 509.
12. Cherchi A, Buosi C, Zuddas P, Giudici GD. Bioerosion by microbial euendoliths in benthic foraminifera from heavy metal-polluted coastal environments of Portovesme (south-western Sardinia, Italy). Bio-geosciences. 2012; 9: 4607–4620.
13. Le Campion-Alsumard T, Golubic S, Hutchings P. Microbial endoliths in skeletons of live and dead cor-als: Porites lobata (Moorea, French Polynesia). Oceanogr Lit Rev. 1995; 9: 149–157.
14. Tribollet A, Langdon C, Golubic S, Atkinson M. Endolithic microflora are major primary producers in dead carbonate substrates of Hawaiin coral reefs. J Phycol. 2006; 42: 292–303.https://doi.org/10. 1111/j.1529-8817.2006.00198.x
15. Golubic S, Schneider J. Microbial endoliths as internal biofilms. Fossil and Recent Biofilms. Springer, Dordrecht; 2003. pp. 249–263.https://doi.org/10.1007/978-94-017-0193-8_16
16. Gutie´rrez JL, Jones CG, Strayer DL, Iribarne OO. Mollusks as ecosystem engineers: the role of shell production in aquatic habitats. Oikos. 2003; 101: 79–90.
17. Campbell SE, Cole K. Developmental studies on cultured endolithic conchocelis (Rhodophyta). Hydro-biologia. 1984; 116–117: 201–208.https://doi.org/10.1007/BF00027666
18. D’alelio D, Cante MT, Russo GF, Totti C, De Stefano M. Epizoic diatoms on gastropod shells. In: Dubinsky Z, Seckbach J, editors. All Flesh Is Grass. Dordrecht: Springer Netherlands; 2010. pp. 345– 364.
19. Gillan DC, Cade´e GC. Iron-encrusted diatoms and bacteria epibiotic on Hydrobia ulvae (Gastropoda: Prosobranchia). J Sea Res. 2000; 43: 83–91.
20. Pantazidou A, Louvrou I, Economou-Amilli A. Euendolithic shell-boring cyanobacteria and chlorophytes from the saline lagoon Ahivadolimni on Milos Island, Greece. Eur J Phycol. 2006; 41: 189–200.https:// doi.org/10.1080/09670260600649420
21. Radea C, Louvrou I, Pantazidou A, Economou-Amilli A. Photosynthetic microorganisms as epibionts and euendoliths on biotic substrates in a thermal spring with ferric-iron deposits. Fottea. 2010; 10: 129– 140.
22. Bornet ME, Flahault C. Sur quelques plantes vivant dans le test calcaire des mollusques. Bull Socie´te´ Bot Fr. 1889; 36: CXLVII–CLXXVI.https://doi.org/10.1080/00378941.1889.10835893
23. Mineur F, Belsher T, Johnson MP, Maggs CA, Verlaque M. Experimental assessment of oyster trans-fers as a vector for macroalgal introductions. Biol Conserv. 2007; 137: 237–247.https://doi.org/10. 1016/j.biocon.2007.02.001
24. Thompson RC, Tobin ML, Hawkins SJ, Norton TA. Problems in extraction and spectrophotometric determination of chlorophyll from epilithic microbial biofilms: towards a standard method. J Mar Biol Assoc U K. 1999; 79: 551–558.
25. Murphy RJ, Underwood AJ, Pinkerton MH. Quantitative imaging to measure photosynthetic biomass on an intertidal rock-platform. Mar Ecol Prog Ser. 2006; 312: 45–55.
26. Jesus B, Brotas V, Marani M, Paterson DM. Spatial dynamics of microphytobenthos determined by PAM fluorescence. Estuar Coast Shelf Sci. 2005; 65: 30–42.https://doi.org/10.1016/j.ecss.2005.05. 005
27. Murphy RJ, Underwood AJ, Pinkerton MH, Range P. Field spectrometry: New methods to investigate epilithic micro-algae on rocky shores. J Exp Mar Biol Ecol. 2005; 325: 111–124.https://doi.org/10.1016/ j.jembe.2005.04.018
28. Barille´ L, Mouget J-L, Me´le´der V, Rosa P, Jesus B. Spectral response of benthic diatoms with different sediment backgrounds. Remote Sens Environ. 2011; 115: 1034–1042.https://doi.org/10.1016/j.rse. 2010.12.008
29. Me´le´der V, Laviale M, Jesus B, Mouget JL, Lavaud J, Kazemipour F, et al. In vivo estimation of pigment composition and optical absorption cross-section by spectroradiometry in four aquatic photosynthetic micro-organisms. J Photochem Photobiol B. 2013; 129: 115–124.https://doi.org/10.1016/j.jphotobiol. 2013.10.005PMID:24211563
30. Murphy RJ, Underwood AJ, Jackson AC. Field-based remote sensing of intertidal epilithic chlorophyll: Techniques using specialized and conventional digital cameras. J Exp Mar Biol Ecol. 2009; 380: 68–76.
https://doi.org/10.1016/j.jembe.2009.09.002
31. Chennu A, Fa¨rber P, Volkenborn N, Al-Najjar MAA, Janssen F, de Beer D, et al. Hyperspectral imaging of the microscale distribution and dynamics of microphytobenthos in intertidal sediments: Hyperspectral imaging of MPB biofilms. Limnol Oceanogr Methods. 2013; 11: 511–528.https://doi.org/10.4319/lom. 2013.11.511
32. Russell BJ, Dierssen HM. Use of hyperspectral imagery to assess cryptic color matching in Sargassum associated crabs. PloS One. 2015; 10: e0136260.https://doi.org/10.1371/journal.pone.0136260PMID:
26352667
33. Perkins RG, Williamson CJ, Brodie J, Barille´ L, Launeau P, Lavaud J, et al. Microspatial variability in community structure and photophysiology of calcified macroalgal microbiomes revealed by coupling of hyperspectral and high-resolution fluorescence imaging. Sci Rep. 2016; 6: 22343.https://doi.org/10. 1038/srep22343PMID:26923719
34. Me´le´der V, Rince´ Y, Barille´ L, Gaudin P, Rosa P. Spatiotemporal changes in microphytobenthos assemblages in a macrotidal flat (Bourgneuf Bay,France). J Phycol. 2007; 43: 1177–1190.https://doi. org/10.1111/j.1529-8817.2007.00423.x
35. Gernez P, Barille´ L, Lerouxel A, Mazeran C, Lucas A, Doxaran D. Remote sensing of suspended partic-ulate matter in turbid oyster-farming ecosystems. J Geophys Res Oceans. 2014; 119: 7277–7294.
https://doi.org/10.1002/2014JC010055
36. Grizel H, He´ral M. Introduction into France of the Japanese oyster (Crassostrea gigas). J Cons ICES J Mar Sci. 1991; 47: 399–403.
37. Goulletquer P, He´ral M. Aquaculture of Crassostrea gigas in France. The ecology of Crassostrea gigas in Australia, New Zealand, France and Washington State (eds Sutherland J & Osman R). 1991. pp. 13–19.
38. Barille´ L, Me´le´der V, Combe J-P, Launeau P, Rince´ Y, Carrère V, et al. Comparative analysis of field and laboratory spectral reflectances of benthic diatoms with a modified Gaussian model approach. J Exp Mar Biol Ecol. 2007; 343: 197–209.https://doi.org/10.1016/j.jembe.2006.11.013
39. Jesus B, Rosa P, Mouget J-L, Me´le´der V, Launeau P, Barille´ L. Spectral-radiometric analysis of taxo-nomically mixed microphytobenthic biofilms. Remote Sens Environ. 2014; 140: 196–205.https://doi. org/10.1016/j.rse.2013.08.040
40. Me´le´der V, Barille´ L, Launeau P, Carrère V, Rince´ Y. Spectrometric constraint in analysis of benthic dia-tom biomass using monospecific cultures. Remote Sens Environ. 2003; 88: 386–400.https://doi.org/ 10.1016/j.rse.2003.08.009
41. Ribeiro LLCS. Intertidal benthic diatoms of the Tagus estuary: taxonomic composition and spatial-tem-poral variation. Ph.D. thesis, University of Lisbon. 2010.
42. Witkowski A, Lange-Bertalot H, Metzeltin D. Diatom flora of marine coasts I. Iconographia diatomolo-gica annotated diatom monographs. ARG Gantner Verlag KG, Berlin; 2000. p. 925.
43. Ribeiro L, Brotas V, Rince´ Y, Jesus B. Structure and diversity of intertidal benthic diatom assemblages in contrasting shores: a case study from the Tagus estuary. J Phycol. 2013; 49: 258–270.https://doi. org/10.1111/jpy.12031PMID:27008515
44. Snoeijs P, Busse S, Potapova M. The importance of diatom cell size in community analysis. J Phycol. 2002; 38: 265–281.
45. Hillebrand H, Du¨rselen C-D, Kirschtel D, Pollingher U, Zohary T. Biovolume calculation for pelagic and benthic microalgae. J Phycol. 1999; 35: 403–424.https://doi.org/10.1046/j.1529-8817.1999.3520403.x 46. HammerØ, Harper DAT, Ryan PD. PAST: Paleontological statistics software: Package for education
and data analysis. Palaeontol Electron. 2001; 4: 1–9.
47. Kahlert M, McKie BG. Comparing new and conventional methods to estimate benthic algal biomass and composition in freshwaters. Environ Sci Process Impacts. 2014; 16: 2627–2634.https://doi.org/10. 1039/c4em00326hPMID:25277172
48. Spilmont N, Seuront L, Meziane T, Welsh DT. There’s more to the picture than meets the eye: Sampling microphytobenthos in a heterogeneous environment. Estuar Coast Shelf Sci. 2011; 95: 470–476.
https://doi.org/10.1016/j.ecss.2011.10.021
49. Schill SR, Porter DE, Coen LD, Bushek D, Vincent J. Development of an automated mapping technique for monitoring and managing shellfish distributions. NOAA/UNH Cooperative Institute for Coastal and Estuarine Environmental Technology (CICEET), Durham NH. 2006. p. 91.
50. MacIntyre HL, Geider RJ, Miller DC. Microphytobenthos: The ecological role of the “secret garden” of unvegetated, shallow-water marine habitats. I. Distribution, abundance and primary production. Estuar-ies. 1996; 19: 186–201.https://doi.org/10.2307/1352224
51. Gade M, Melchionna S, Stelzer K, Kohlus J. Multi-frequency SAR data help improving the monitoring of intertidal flats on the German North Sea coast. Estuar Coast Shelf Sci. 2014; 140: 32–42.https://doi. org/10.1016/j.ecss.2014.01.007
52. Choe B-H, Kim D, Hwang J-H, Oh Y, Moon WM. Detection of oyster habitat in tidal flats using multi-fre-quency polarimetric SAR data. Estuar Coast Shelf Sci. 2012; 97: 28–37.https://doi.org/10.1016/j.ecss. 2011.11.007
53. Lagerheim G. Codiolum Polyrhizum n. sp. O¨ vers K Vetensk Akad Fo¨rhandl. 1885; 42: 21–31.
54. Paterson DM, Wiltshire KH, Miles A, Blackburn J, Davidson I, Yates MG, et al. Microbiological mediation of spectral reflectance from intertidal cohesive sediments. Limnol Oceanogr. 1998; 43: 1207–1221.
55. Kazemipour F, Launeau P, Me´le´der V. Microphytobenthos biomass mapping using the optical model of diatom biofilms: Application to hyperspectral images of Bourgneuf Bay. Remote Sens Environ. 2012; 127: 1–13.https://doi.org/10.1016/j.rse.2012.08.016
56. Ku¨hl M, Polerecky L. Functional and structural imaging of phototrophic microbial communities and sym-bioses. Aquat Microb Ecol. 2008; 53: 99–118.https://doi.org/10.3354/ame01224
57. Jeffrey SW, Mantoura RFC, Bjørnland T. Data for the identification of 47 key phytoplankton pigments. Phytoplankton Pigments Oceanogr Guidel Mod Methods UNESCO Paris. 1997; 449–559.
58. Golubic S, Le Campion-Alsumard T, Campbell SE. Diversity of marine cyanobacteria. Charpy Larkum AWD Eds Mar Cyanobacteria Bull Inst Oce´an Monaco Spec Issues. 1999; 19: 53–76.
59. Raghukumar C, Sharma S, Lande V. Distribution and biomass estimation of shell-boring algae in the intertidal at Goa, India. Phycologia. 1991; 30: 303–309.https://doi.org/10.2216/i0031-8884-30-3-303.1 60. Ramı´rez-Reinat EL, Garcia-Pichel F. Characterization of a marine cyanobacterium that bores into
car-bonates and the redescription of the genus Mastigocoleus. J Phycol. 2012; 48: 740–749.https://doi.org/ 10.1111/j.1529-8817.2012.01157.xPMID:27011091
61. Wilkinson M. Investigations on the autecology of Eugomontia sacculata Kornm., a shell-boring alga. J Exp Mar Biol Ecol. 1974; 16: 19–27.
62. Marcelino VR, Verbruggen H. Multi-marker metabarcoding of coral skeletons reveals a rich microbiome and diverse evolutionary origins of endolithic algae. Sci Rep. 2016; 6: srep31508.https://doi.org/10. 1038/srep31508PMID:27545322
63. Sauvage T, Schmidt WE, Suda S, Fredericq S. A metabarcoding framework for facilitated survey of endolithic phototrophs with tufA. BMC Ecol. 2016; 16.https://doi.org/10.1186/s12898-016-0068-x
PMID:26965054
64. Totti C, Romagnoli T, De Stefano M, Camillo DCG, Bavestrello G. The diversity of epizoic diatoms. In: Dubinsky Z, Seckbach J, editors. All Flesh Is Grass. Dordrecht: Springer Netherlands; 2010. pp. 323– 343.
65. Jesus B, Mouget J-L, Perkins RG. Detection of diatom xanthophyll cycle using spectral reflectance. J Phycol. 2008; 44: 1349–1359.https://doi.org/10.1111/j.1529-8817.2008.00583.xPMID:27041732 66. Cognie B, Barille´ L. Does bivalve mucus favour the growth of their main food source, microalgae?
Ocea-nol Acta. 1999; 22: 441–450.https://doi.org/10.1016/S0399-1784(00)88727-7
67. Dame RF. The role of bivalve filter feeder material fluxes in estuarine ecosystems. Bivalve Filter Feed-ers. Springer, Berlin, Heidelberg; 1993. pp. 245–269.https://doi.org/10.1007/978-3-642-78353-1_7 68. Drew KM. Conchocelis-Phase in the Life-History of Porphyra umbilicalis (L.). Nature. 1949; 164: 748–
749.
69. Blouin NA, Brodie JA, Grossman AC, Xu P, Brawley SH. Porphyra: a marine crop shaped by stress. Trends Plant Sci. 2011; 16: 29–37.https://doi.org/10.1016/j.tplants.2010.10.004PMID:21067966