F
ACULDADE DEE
NGENHARIA DAU
NIVERSIDADE DOP
ORTOEco-innovation on automation machines
Angela Maria Carneiro Santos de Morais Pinheiro
Mestrado Integrado em Engenharia Eletrotécnica e de Computadores
Supervisor: António Carlos Sepúlveda Machado e Moura (Professor, Doutor)
Resumo
A produção industrial é um motor para a economia global. A sua abrangência e enorme in-fluência na economia provocam a necessidade de criar regulamentação e controlo. Conceitos como sustentabilidade e responsabilidade ambiental emergem, impondo limites na produção, de forma a que a qualidade de vida possa ser mantida. Reúnem-se três pilares que suportam o desenvolvi-mento sustentável: competitividade económica, responsabilidade social e impacte ambiental. A presente dissertação aborda o impacte ambiental contextualizando-o através da competitividade económica.
Atendendo a que o desenvolvimento industrial se tem vindo a tornar um assunto massivo, aumentar a competitividade económica neste setor é uma via para a redução dos impactes ambi-entais negativos. A rotulagem ecológica tem vindo a manifestar-se um modo seguro para atingir esse objetivo. A mesma promove a competitividade demonstrando às empresas ser um fator de peso nas decisões de compra, movimentando a economia. Por outro lado, a obtenção de etiquetas implica que as características ecológicas dos produtos ou serviços sejam comprovadas. Um pro-duto que contribua para a redução do impacte ambiental, sem sacrificar as suas funcionalidades é um produto eco-eficiente.
Contudo, rotulagem não é um assunto simples nem inequívoco e dependente muito do produto em questão. O objeto de estudo do presente projeto é uma máquina industrial de testes de stress ambiental em peças, produzida pela Controlar, Innovating Industry. Este projeto expõe e explora fatores-chave para atingir a sustentabilidade e eficiência deste produto, bem como os vários tipos de etiquetas ambientais normalizadas. É assim um ponto de partida para a certificação de eco-eficiência do objeto de estudo.
Começando por um estudo aprofundado de ferramentas e métodos para a sustentabilidade, passando pela análise de opções e respetivos critérios, procedimentos e benchmarking, este projeto culmina na proposta de uma Declaração Ambiental de Produto que potencia as características ambientais do produto através da análise do seu ciclo de vida.
Palavras-chave: Declaração ambiental de produto, eco-eficiência, KPI, máquinas industriais, rotulagem ecológica.
Abstract
Industrial manufacturing is a key driver for the global economy. Its broadness and huge in-fluence in economy awakes the need for regulation and control. Concepts as sustainability and environmental responsibility started to appear in order to enforce manufacturing boundaries so that human natural living conditions can be maintained. Three pillars are put together to support a sustainable development: economic competitiveness, social conditions and environmental im-pacts. The present dissertation approaches environmental impacts by contextualizing them within economic competitiveness.
As manufacturing is becoming a massive issue, increasing economic competitiveness within industrial sectors is a way to reduce harmful environment impacts. A solid way to achieve this goal is through eco-labelling procedures. It approaches the competitiveness side by showing com-panies the need to apply labels as they are a relevant factor for purchasing decisions and as such increasing economical flows. On the other hand, in order to be awarded with eco-labels, products and services must prove their eco-features. A product that contributes to environmental impact reduction without compromising its functionalities is an eco-efficient product.
However, the eco-labelling is not a simple and straightforward subject to cope with and strongly depends on the product. The object of the present study is an industrial machine that perform en-vironmental stress tests on a workpiece, produced by Controlar, Innovating Industry. This project exposes and explores key factors to achieve sustainability and product’s efficiency, as well as the several types of normalized environmental labels. In this way, it is a starting point to the eco-efficiency labelling of the study object.
Starting with a comprehensive study of tools and methods to become sustainable, through the analysis of options, its criteria, procedures and benchmarking, this project culminates on a proposal of an Environmental Product Declaration that potentiates the products’ environmental features, throughout its life cycle.
Key-words: Eco-efficiency, eco-labelling, environmental product declaration, industrial ma-chines, KPI.
Acknowledgments
This project is the culminate of a stage in my life that could not have been done without the support and care from a lot of people who accompanied me during the past years.
First of all, I would like to thank CONTROLAR for the opportunity to develop this project, for the receptivity and all the support given during this semester and also for the provided working conditions. Mainly I would like to thank to Carla Pereira, Luís Ferreira, Fernando Leite, Carlos Alcobia, Vera Figueiredo, Tiago Menezes and David Leite for all the feedback given during the working phase, the availability to accompany my work and answer all my questions giving the necessary suggestions and advice.
Secondly, to my university, FEUP and to my supervisor, professor António Machado e Moura, for his availability, contacts supplied, support and encouragement during the whole semester. And also for all the enthusiasm that was always demonstrated.
I would also like to thank my parents, Lina Morais and António Angelo Pinheiro, and my sister Teresa Pinheiro for all the patience, support, contribution and time spent helping and encouraging me on this project. Also, for all the support and help along these past years, the advices and talks. To my aunt Nazaré Pinheiro for the availability and feedback given on this project, and, of course to all my family, my grandparents, uncles, aunts and cousins whose support was crucial.
To all the contacts I made during this project that one way or another gave their contribution, and very useful input to its development.
To all my friends who propotioned amazing moments in the last years, Isabel Fragoso, Inês Carvalho, Catarina Terra, Beatriz Magalhães, Ana Sofia Silva, Vera Teixeira, Ana Faria, Madalena Peyroteo, Tânia Vilarinho, Fábio Vasconcelos, Bruno Augusto, Nelson Oliveira, Eduardo Rocha, Bruno Morais, João Sá, Pedro Saleiro, Ricardo Loureiro, Vitor Morais. To Daniel Braga for all the patience and time spent helping me. To my roomates Catarina Barros and Marta Simões. To my friends in my hometown, Margarida Santos, Beatriz Ornelas, Andreia Carvalho, Rita Oliveira and Cátia Rocha.
To each element of Tuna Feminina de Engenharia during the years I was a part of, for all the friendship and moments that directly or indirectly influenced my personal development.
Angela Pinheiro
“However difficult life may seem, there is always something you can do and succeed at.”
Stephen Hawking
Contents
1 Introduction 1
1.1 Structure . . . 1
1.2 Controlar, Innovating Industry . . . 2
1.3 Motivation . . . 2 1.4 Goals . . . 3 1.5 Methodology . . . 3 2 Industrial framework 5 2.1 Automotive Industry . . . 8 2.2 Test machines . . . 9 2.3 Object of study: FCT50 . . . 12
3 Sustainable manufacturing and eco-innovation 15 3.1 Practices for sustainability and eco-innovation . . . 15
3.2 Life cycle assessment . . . 18
3.3 Indicators . . . 22
3.3.1 Environmental Indicators . . . 24
3.3.2 Resource Indicators . . . 24
3.3.3 Key Performance Indicators . . . 26
3.4 Benchmarking . . . 36
3.5 Policies . . . 40
3.5.1 Environmental and energy efficiency . . . 40
3.5.2 Eco-innovation . . . 43
4 Eco-labelling 47 4.1 Goals . . . 47
4.2 Policies . . . 48
4.3 Programs Type I: Environmental labels . . . 54
5 Eco-innovation methodology proposal 57 5.1 Type I: Environmental Labelling . . . 57
5.1.1 Energy Star . . . 58
5.1.2 EU ecolabel . . . 64
5.1.3 SWOT . . . 71
5.2 Type II: Self-declared environmental claims . . . 73
5.2.1 SWOT . . . 73
5.3 Type III: Environmental Product Declaration . . . 74
5.3.1 Environmental Product Declaration . . . 74
5.3.2 SWOT . . . 83
5.4 Discussion . . . 85
6 Conclusions and future work 87
A Environmental indicators 89
B Patents’ research 91
C EPD three-phased LCA 93
D Workflow to develop a PCR document 95
E Template to create a PCR document 97
List of Figures
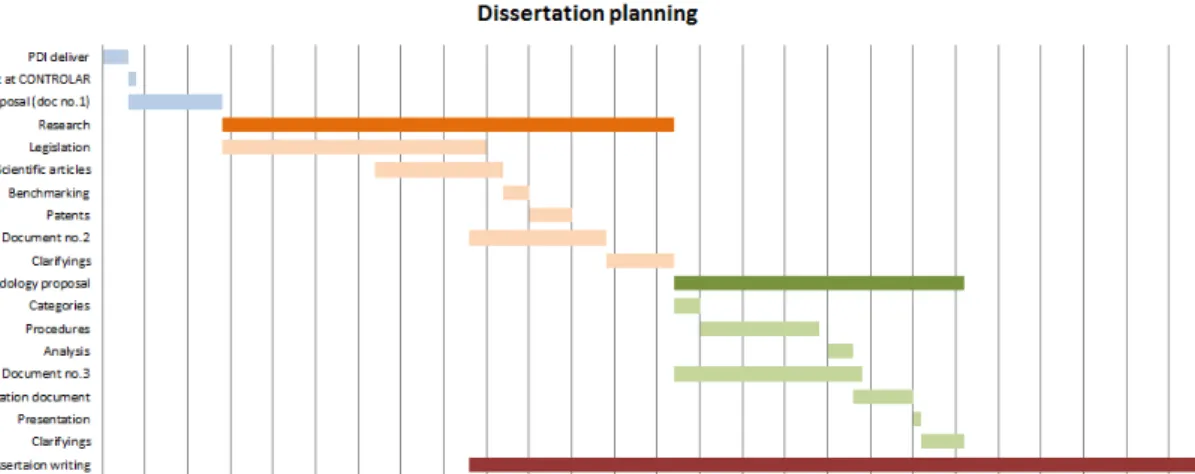
1.1 Gantt planning . . . 4
2.1 Final energy use in the UE by sector (% of total) [5] . . . 6
2.2 Sustainability concerns in industry, adapted from [6], . . . 6
2.3 Eco-innovation aspects, adapted from [8] . . . 7
2.4 The bathtub curve for typical electronic devices and semiconductor devices [15] . 10 2.5 Typical HALT/HASS system disposition [17] . . . 12
2.6 Scheme with the production process workflow at CONTROLAR . . . 13
3.1 The closed-loop production system [4] . . . 16
3.2 Evolution of sustainability concepts and practices, adapted from [4] . . . 16
3.3 Conceptual relationships between sustainable manufacturing and eco-innovation [4] 17 3.4 Product life cycle [21] . . . 19
3.5 Phases of a LCA [22] . . . 20
3.6 Materials and Stakeholders interactions [2] . . . 21
3.7 SPICE model [2] . . . 22
3.8 RACER indicator selection criteria , adapted from [6] . . . 23
3.9 Hierarchical approach for energy savings at machine level [19] . . . 27
3.10 Manufacture sates by domain connected to energy sates, adapted from [18] . . . 29
3.11 Energy diagram [18] . . . 30
3.12 Reference part method aspects [29] . . . 31
3.13 Reference process method aspects [29] . . . 32
3.14 Specific energy consumption method aspects [29] . . . 32
3.15 Component benchmark method aspects [29] . . . 32
3.16 Manufacturing system key attributes [23] . . . 33
3.17 Energy Star steps for plant efficiency [30] . . . 34
3.18 The closed-loop production system [32] . . . 37
3.19 Green mode label [34,35] . . . 38
3.20 Wide application of life cycle perspective based policies [20] . . . 41
3.21 PDCA cycle [42] . . . 42
3.22 Phases of an eco-efficiency assessment [43] . . . 43
3.23 Innovation topology [44] . . . 44
4.1 Eco-label programs’ logos . . . 56
5.1 Product technical description example [92] . . . 76
5.2 Product description example [92] . . . 76
5.3 Use phase scenario example [92] . . . 78
5.4 Steps to create an EPD[93] . . . 79
5.5 Workflow of an EPD creation [95] . . . 81
5.6 Phases of PCR document [97] . . . 82
C.1 Three phases LCA [92] . . . 94
D.1 PCR workflow part1[54] . . . 95
List of Tables
3.1 Summary of sustainable manufacturing indicators [4] . . . 24
3.2 Types of environmental indicators [24] . . . 25
3.3 Resource efficiency indicators per areas in industry [6] . . . 26
3.4 Patents . . . 39
4.1 Typical product environmental criteria selection matrix [51] . . . 50
4.2 Environmental labels Type I . . . 55
5.1 Energy star category products [69] . . . 58
5.2 EU ecolabel category products [83] . . . 66
5.3 Type I SWOT analysis . . . 71
5.4 Type II SWOT analysis . . . 73
5.5 EPD categories [91] . . . 75
5.6 Register fees to EPD [94] . . . 80
5.7 Annual fees for EPD [94] . . . 80
5.8 Additional options’ fees [94] . . . 81
5.9 Type III SWOT analysis . . . 83
Abbreviations and symbols
A2LA American Association for Laboratory Accreditation
AHAM Associations of Home Appliance Manufacturers
ANSI American National Standards Institute
B2B Business to Business
CADR Clean Air Delivery Ratio
CE Conformité Européenne
CEF Combined Energy Factor
CEI Core Environmental Indicators
CO2 Carbon Dioxide
COP Coefficient of Performance
DEI Decoupling Environmental Indicators
DFE Digital Front-end
DGAE Direção Geral de Atividades Económicas
DMC Domestic Material Consumption
DOE Department of Energy
DUT Device Under Test
EC European Commission
EER Energy Efficiency Ratio
EF Energy Factor
EMAS Environmental Management and Audit Scheme
EPA Environmental Protection Agency
EPD Environmental Product Declaration
EPI Energy Performance Indicator
EU European Union
EUEB European Union Ecolabelling Board
FTC Federal Trade Commission
GDP Gross Domestic Product
GHG Green House Gas
GVA Gross Value Added
GWP Global Warming Potential
HALT High Accelerated Life Testing
HASS High Accelerated Stress Screening
HSFP Heating Seasonal Performance Factor
IBU Istitut Bauen und Umvelt
ID&D Investigation, Development and Innovation
IMEF Integrated Modified Energy Factor
IPAC Instituto Português de Acreditação
ISO International Organisation for Standardization
IWF Integrated Water Factor
KEI Key Environmental Indicators
KPI Key Performance Indicator
LCA Life Cycle Assessment
LCI Life Cycle Inventory
LCIA Life Cycle Impact Analysis
MEF Modified Energy Factor
n.e.c. non-elsewhere classified
NGO Non-Governamental Organisation
NP Norma Portuguesa
OECD Organisation for Economic Co-operation and Development
PDCA Plan, Do, Check, Act
PER Primary Energy Ratio
RAL German Institute for Quality Assurance and Certification
R&D Research and Development
RDI Research, Development and Innovation
REACh Registration, Evaluation, Authorisation and Restriction of Chemicals
RoHS Restriction of Hazardous Substances
RvA Raad voor Accreditatie(Dutch Accreditation Council)
SEER Seasonal Energy Efficiency Ratio
SEI Sectoral Environmental Indicators
SMEs Small and Medium-sized Enterprises
SRI Socially Responsible Investment
SVHC Substances of Very High Concern
TEC Typical Electricity Consumption
UBA The Umweltbundesamt(German Environmental Federal Agency)
UL Underwriters Laboratories
UN CPC United Nations Central Product Classifications
USA United States of America
UUT Unit Under Test
VoIP Voice over Internet Protocol
WF Water Factor
WOL Wake on Lan
List of symbols
W Watts
L Liters
kWh kiloWatt hour
ppb parts per billion
BTU British Thermal Unit
kg kilogram
h hour
Chapter 1
Introduction
The present document was developed under the scope of a project proposed to the Faculty of Engineering as a dissertation for the Integrated Masters in Electrical and Computers Engineering. The proposal was made by CONTROLAR, Innovating Industry, henceforth mentioned as CON-TROLAR, a company specialized in the automotive sector. With this work CONTROLAR aimed to prepare a framework to achieve eco-efficiency certification of their industrial machines.
1.1
Structure
This document is structured in six chapters which include information according to an inter-connected and logical flow of the subjects.
• Chapter1 Introduction: introduction to the main subject, its scope and goals, approach to
the project planning and methodologies;
• Chapter 2 Industrial framework: a general framework of the information to the main
subject. It’s a starting point and a general framework of all issues related to the main subject. The information addressed might be directly or indirectly related to the subject, although it is relevant to be mentioned. As such, information on sustainability, energy programs, automotive industry and test machines are approached;
• Chapter3 Sustainable manufacturing and eco-innovation: an in-depth study, based on
thoroughly bibliographic research of the key subjects, to create and develop eco-innovation practices, such as life cycle assessment, indicators’ type, benchmarking and policies.
• Chapter4 Eco-labelling: description of the main goals of eco-labelling schemes, policies
and applicable legislation. Types of eco-labelling are described and completed by cases presentation.
• Chapter 5 Eco-innovation methodology proposal: proposed methodology to obtain an
efficiency certification. Options are analysed, including their criteria and proceedings. A SWOT analysis is also included along with discussion and recommendations.
• Chapter6 Conclusions and future work: general review of the work , goals fulfilment analysis and presentation of ideas for the future work in order to give continuity to this project.
1.2
Controlar, Innovating Industry
CONTROLAR, founded in 1995, has 21 years of market and has been developing and growing in a sustainable way and oriented to its customers’ satisfaction. Its infrastructure is located in
Alfena, Porto and has around 1000m2 and this year will grow 700m2 more [1]. It is a SMEs
company with a staff of almost 70 people. The core business is the development and building of hardware and software mostly to the automotive industry. An important knowledge and experience in functional tests systems and quality of electronic devices is being acquired everyday.
The starting phase of CONTROLAR was directed to the auto-radios, later expanding to the construction of machines for verification of workpiece production, checking its quality and moni-toring its performance. Since 1999, CONTROLAR diversified its business into three main areas: test systems, the core business of the company, automation systems and auto-ID systems. In 2010 the company reinforced its quality system, by being now certified with the ISO 9001:2015 stan-dard. In the recent years there has been some serious investment on the research, development and innovation department, including the certification with the standard NP 4557:2007. CONTRO-LAR also adopted the proceedings stated on ISO 14001:2015 of environmental management and obtained the certification.
In what concerns the test systems sector, the goal is to monitor and control data to verify electronic devices’ quality. This sector encloses activities such as assembling and testing electronic components, developing automatic test equipment and monitoring its durability and quality in climatic, vibration and noise chambers tests.
The automation sector is based on the development and integration of industrial automation solutions which includes the conception, engineering and construction of mechanical parts. The most relevant subjects are the industrial electrical installations, machines and production lines, and the software development to control and monitor the processes in the production system.
The third sector, auto-ID includes the development and commercialization of automatic iden-tification solutions, such as bar codes and images readers.
1.3
Motivation
There is today a growing concern about environmental impacts, scarcity and waste of re-sources and its long-term consequences. A growing number of programs against this problem are being launched at organisational, national and world levels. Those programs intend to limit the boundaries for atmospheric emissions, resources extraction and use of energy sources by cre-ating procedures, legislation, methods and milestone values of energy consumption. Programs’
1.4 Goals 3
first concern is the energy extraction and consumption restructuration. Legislation terms motivate companies to comply with standards and to become more competitive in the market.
CONTROLAR, along with its core business, targets the technological vanguard and the prof-itability from resource efficiency (energetic, economic, environmental, etc.)
CONTROLAR is strongly motivated to reduce its environmental impact and increase energetic efficiency. With the goal of defining a solid environmental policy, it embraced the environmental certification by adopting the ISO 14001:2015 standard. Currently, the company intends to provide information about energy consumptions of its products to its clients. Also, it aims at defining milestones to reduce that consumptions’ impacts.
1.4
Goals
Initially the project had an aim that was lately adapted to the time schedule of this dissertation, and that was readjusted along its development. The former idea was to collect and prepare the necessary data, such as analysing the energy performance, defining and calculating the KPIs (Key Performance Indicators), proposing improvements to the machines’ efficiency in order to drive the administrative procedure towards an eco-efficiency certification. Soon it was concluded that this aim would not be achievable within the time frame of this project. The new goal was the defined: building a solid theoretical support to advise the most suitable path for the eco-certification proce-dure and create the basis to start it. As such, this dissertation has to be considered as the first step of the eco-certification procedure of the FCT50 machine.
In these circumstances, the following main goals were proposed:
• In-depth analysis and market study within the industrial sector relevant to the subject. Iden-tification of international classifications of manufacturers in the automotive industry; • Research, identification and analysis of patents, scientific articles and current legislation,
national and European, relevant to the subject;
• Adaptation and transcription of the research to the company’s machines to identify relevant aspects of eco-efficiency and eco-labelling;
• Methodology proposal to achieve an eco-efficiency certification.
1.5
Methodology
An exhaustive research was made through diverse bibliographic sources, such as patents, sci-entific articles, legislation and benchmarking. This last one refers to the investigation of companies with similar products, which already implemented or have under development, products’ energy certification processes. The methodology consisted in register all the key-words used as well as the research fields filled in the patents and scientific articles investigated. The patents research was made in the main scientific databases such as Espacenet and Wiko. Concerning the legislation
field, some standards were made available by the company and the other ones were searched by reference and obtained at external sources.
After collecting all the information, an analysis and a summary of all the documents studied was performed, and a new results document was written. Subsequently, there was a presentation of the various possible solutions to the problem, that included the analysis of the pros and cons of each hypothesis, resulting on a methodology proposal and advice on which should be the most advantageous certification procedure for the company.
Chapter 2
Industrial framework
This chapter will start by presenting a general framework on the industrial sector and its con-tributions to the global economy. It will approach the major nowadays concerns of the industry and actions being taken to overcome them. Furthermore, specific to the automotive industry, an explanation on future developments. Afterwords, it narrows down to test machines and types of stress testing, and finally it presents the object of study.
Nowadays reducing the dependence on oil economies and fossil fuel is an urgent task not only because of the threat to global climate change but also because of the scarcity of the non-renewable
energy sources [2].
It is a fact that energy is of vital importance in all economies. It is the main input in all pro-duction processes and also one important consumption good for households, and that’s why it has
a strong impact in most economic variables [3]. As environmental concerns have grown stronger,
policies to reduce emissions have become popular these recent years. They act directly on the energy production and consumption, which is the biggest problem. Primary energy consumption is the first stage in the activity of producing energy, and it is also the most unpredictable activity because it’s affected by a lot of external, environmental and climatic factors. In 2008, Portugal was one of the few European countries with primary energy production relying entirely on renewable energies.
With the increasing demand and purchase of energy related products in the market, the con-sumption of final energy increases. Consequently, arises the need to limit the concon-sumption of those products by pushing them to achieve efficiency and sustainability. It is important to understand
in which sectors energy is the most required (Figure2.1) and start by acting on those sectors, to
combat the most urgent issues in first place. Inside the industrial sector, most of the energy is used in production processes, as expectable, and the biggest consumers are the machines. This leads countries to a serious environmental emissions concern and sustainability mind set.
The growth of the economic and industrial sectors, brings an increasing global environmen-tal concern, with topics such as the climatic changes, energetic security and scarcity of the
re-sources (Figure2.2). Consequently, several concepts such as environmental sustainability, energy
efficiency and eco-innovation are being explored in order to enforce some boundaries and some 5
advising on the problem [4].
Figure 2.1: Final energy use in the UE by sector (% of total) [5]
Figure 2.2: Sustainability concerns in industry, adapted from [6],
Energy efficiency is a way of managing and restraining the increase in energy consumption. An equipment more energetically efficient than other delivers more services for the same amount
of input energy [7].
Eco-innovation’s goal is to reduce environmental impacts and achieve efficient and responsible use of resources. It provides solutions to improve competitiveness by reaching the whole supply
chain of products (Figure2.3).
About these issues there have been a lot of programs launched and sponsored by entities such as national governments, the European Commission, policy-makers and groups of international organisations.
Industrial framework 7
Figure 2.3: Eco-innovation aspects, adapted from [8]
The OECD (Organisation for Economic Co-operation and Development) project on sustain-able manufacturing and eco-innovation was launched aiming to accelerate sustainsustain-able industrial production and development of new technologies and solutions to address this problem. It gives some framework on attitudes to adopt and key aspects to follow when trying to reach eco-innovation by a continuous improvement approach.
In Portugal is running the “Portugal 2020” program which is an agreement between Portugal and the European Commission that defines principles for the economic development of the country until 2020. One of the main focuses of this program is precisely the sustainability and efficient use of resources.
The program has several defined goals, such as the creation of green jobs, increase of
produc-tivity material, improvement of energy efficiency and boost the share of renewable energies [9].
Despite all the benefits of achieving energy efficiency, some barriers still slow down the progress.
They are explained in the Green Growth Commitment of Portugal [10].
• Costs versus investment: energy efficiency can be interpreted as a cost instead of an invest-ment, underestimating the income created by it, which should be bigger than the investment; • Lack of information: traditional mind sets and lack of knowledge cause reduction on the
quantity and quality of promotion strategies and limits competitiveness;
• Discontinuation of public policies: this works as a barrier to the dissemination of energy efficiency, creating instability in the investments;
• Financing: or the lack of it, is an obstacle to the improvement and development of the energy efficiency.
This commitment assumes that energy efficiency must be taken as a priority to national energy policies. As Portugal, most European countries are doing individual efforts to increase their own
sustainability and eco-efficiency in order to achieve a common goal of productivity and environ-mental impact reduction, by decreasing resource and energy consumption. As the opportunities
for improvement are so many, they are aggregated in 6 domains [10]:
• Growth: as energy efficiency is a stimulus to the economic growth;
• Innovation: “smart” technologies are the future and join efficiency and innovation; • Responsibility: being conscious about consumptions, its quantities and resources; • Information and training: to the general public and inside companies;
• New financing models and new investors: as this is a changing area; • Internationalization: Portugal has a lot of know-how that can be exported.
Along with these initiatives, the Portuguese program uses a measurement tool that is the “eco-nomic energy intensity” indicator. It evaluates the national energy consumption against the re-spective created wealth. The value of this indicator has been decreasing along with the European average.
2.1
Automotive Industry
It is not clear how cars will change in the coming years, but producers and suppliers in the automotive industry cannot step away of the transformation and evolution process.
Meanwhile, whether in design or manufacture, automotive companies are handling new tech-nologies and vehicle concepts that have the potential to transform the whole automobile conception and production industry. Hints are starting to appear that prove industry’s progression by showing how the next generation connected car will look like: a vehicle with Wi-Fi, advanced infotainment system and apps, vehicle to vehicle communications with exchange of safety data such as speed and position, real-time location services and routing based on traffic conditions and network web links that facilitate vehicle diagnostics and repairs.
The idea of fully autonomous vehicles is too futuristic for much of the driving public. But for automotive industry people the path to driverless cars is going to be an exciting period of transformation. Original equipment manufacturers must upgrade traditional models while taking part in claims of emerging technologies and improved customer experiences. Companies’ ability
to be at the vanguard of product trends without go against environmental rules will be tested [11].
Currently, the automotive sector provides 12 million workstations, accounts for 4% of the EU’s (European Union) GDP (Gross Domestic Product) and is the target of the largest private investment in R&D (Research & Development). This sector is one of the most connected to diverse other sectors, such as upstream products (steel, chemicals, textile, components and respective testing) and downstream ones (repair, maintenance, mobility services).
2.2 Test machines 9
The EC (European Commission) has been doing some work on global technical harmonization of the automotive industry, finding common technical requirements to help reducing costs and gen-erating savings. The EC is also responsible for the legislation inside EU providing rules for safety and environmental protection. Harmonization is the key to competitiveness within the automotive industry and globally. Along with harmonization, smart regulation is a powerful tool to achieve environmental objectives. In this context, policy proposals are also being competitiveness-oriented to increase consumers’ trust and reduce administrative burden.
Legislation is eliminating national differences and playing a positive role in promoting ac-cess to global markets. The Commission has also been encouraging R&D projects and has even
doubled the funds available for this sector for the period between 2014 and 2020 [12].
Moreover, the EC has goals related to the environment protection and the air quality improve-ment. Consequently, the EU legislations and standards aim to reduce pollutant emissions, noise,
GHG (Greenhouse Gas), etc. [13]
The automotive sector is one of the most important because it largely affects economy and it is where big part of energy and resources consumption are allocated. Consequently, it is also one of the sectors with most potential to improve towards efficiency and sustainability.
Furthermore, besides the sustainability and environmental reasons to become efficient, firms have also the motivation of the consumers’ side. Consumer behavior is tending to increase at-tention towards environmental aspects, as they are starting to become an important factor in a purchasing decision.
Summing up, companies have an external pressure point that is the need to comply with the demand, to stay competitive and to respond to suppliers’ requests. As internal pressure points
appear the costs and the management [14].
2.2
Test machines
Nowadays, there are a lot of factors that have been pressing the industry to develop better solutions in a shorter period of time. These factors can be the high competitiveness of the market, the availability of new technologies, the prices decreasing and the tightening of deadlines to launch new products. The automotive industry has already defined some standard tests. However, the time it takes to execute them does not match with the target deadline to start selling the product. This creates a problem to companies: either they delay the launch of the product and make suitable quality and reliability tests, or they launch the product on time risking the rejection of products caused by different defects. So, it is a challenge for companies to improve their products, and also reinvent their processes, by replacing them with less time-consuming, cheaper and with better performance ones.
In automotive components industry, the quality of products is determined by lab tests, such as vibration, climatic, impact, as well as other process parameters. Recently, a new kind of technique has called the researchers’ attention. It’s known as HALT (High Accelerated Life Testing) and HASS (High Accelerated Stress Screening). These testing methods submit the products to severe
conditions to force them to quickly reach the point of failure. The importance of these tests has growing once their efficiency has been proved, and they have been used to detect defects in products during the production phase.
These technologies use a combination of environmental situations and expose products to critical ones aiming to anticipate the failure detection. The earlier a defect is detected the easier it is to correct or fix. Both HALT and HASS techniques use stress conditions worse than the normal use of the product intends to, but it is the best way to quickly find errors. The bathtub
graph shown in Figure 2.4 demonstrates the average electronic product failure behavior. This
graph consists of three periods: infant mortality, with a decreasing (early) failure rate, followed by a normal life period, which is the usage phase, with a relatively low and random failure rate,
and then, as the product’s end-of-life approaches, the failure rates increase again [15]. It should be
a manufacturer’s priority to determine methods to eliminate defects in the infant mortality phase, because it is the most dangerous phase to fail and kills the consumers’ confidence.
Figure 2.4: The bathtub curve for typical electronic devices and semiconductor devices [15]
Stress tests should be performed the earliest possible and should evaluate the design weak-nesses and expose material and assemblage problems. These are essential when developing a product, but they are time-consuming, and have costs besides the time lost. The product should be tested as long as it is projected and the best way to do that is by testing its components. It is too risky to wait until the assemblage of the product and test it just before being released to the market. On the other side, testing every individual component of a product delays the production process and increases the costs one more time. The best balance and solution found is to make the
2.2 Test machines 11
In what concerns HALT and HASS techniques, they both rely on shortening the test timescale by applying a much hogher level of stress to the product than the level for which the product is designed for. In this way, they force failure to happen in less time than it would take under normal operating conditions. So, when properly used, both tests can quickly expose problems related to the design and production of the product.
In HALT programs stress conditions are applied during the product development to find weak-nesses in the design of the product. The normal procedure of these tests is through the use of temperature and vibrations parameters. Nonetheless, they can also be done applying different conditions of humidity, thermal cycling, over-voltage or over-current. This test requires few test units and a short period of time to perform. The continuous use of the units, with higher duty cycles and under stress conditions will help finding design mistakes. The problems found must be corrected to meet the product’s specified limits.
HASS programs are implemented during the production phase and do not aim at highlighting design problems but, instead, they find defects created or arisen during the production phase. They employ stress levels but not as high as the ones employed by HALT tests. They intend to get the infant mortality phase as lower as possible. If after an HASS test there are units failing, the problem should be on the manufacturing processes. But, if these tests are both performed in the correct place on the timeline, they are very useful to understand where the problem is being generated.
An integrated HALT/HASS program can bring benefits but the test limits need to be very carefully planned and monitored, especially the HASS tests because they’re done with the product already developed and functional. Nonetheless, when defining the test environment, it’s important to bare in mind that too light conditions will not force the product to fail, so there may be defects not detected, but, on the other side, if they are too severe, additional and new failures may appear than can put in risk the reliability of the product. These tests can not only show problems on the functional side of products but also on the mechanical one, e.g. in a temperature test, the material’s resistance is also tested and not only the product functionality.
It’s also important to have some input on the test equipment features such as the number of measuring channels, electrical noise, signal levels, chamber size and capacity, structure, and
cabling and connectors. Figure2.5shows a typical test system [17].
Burn-in and climatic stress screening are two types of HALT tests. In burn-in tests the main principle is to have an oven where the temperature is controlled. The product is placed inside the oven and connected to monitoring channels, staying inside for a period of time while the acquisi-tion system performs funcacquisi-tional tests searching for product’s alteraacquisi-tions. Climatic stress screening is widely used in automotive, aeronautic and train industries. The test chamber simulates a de-termined environmental with defined temperature and humidity values depending on the product. While inside the chamber, several functional tests are made to the product through the monitoring channels. The aim now is to test several similar products at the same time, exposing them to the
same environment [15]. Sometimes, this kind of test requires a lot of equipment like sources and
Figure 2.5: Typical HALT/HASS system disposition [17]
on products, maintaining their quality and reducing time until the market release.
2.3
Object of study: FCT50
The object that gives purpose to this study is an environmental testing machine produced by CONTROLAR. It is called FCT50 and it was designed with the intention to create and implement a standard to similar machines of the production and test lines. It is framed by the HALT/HASS
test typology approached in Section2.3. Its main purpose is the performance of functional tests
on products, typically displays, with the use of artificial vision equipment such as cameras, light sources, etc. FTC 50 monitors the quality of the product at the end of its production, or, if needed, between production phases. Quality is assured when the test results are within the defined range of values for parameters as luminosity, contrast, pixel number or colour saturation.
The machine has a portable piece called “tool” that makes physical and electrical connections between the UUT (Unit Under Test) and the machine. This tool is also responsible to move the UUT inside and outside the testing chamber by moving upon an axis. The exterior of the machine includes a screen for interface with the user, buttons, a table for the tool, the electric part and the machine’ power source. The interior is a dark chamber, built to block luminosity with an anti-reflex coating. It has a two axes system, completed by the third one mentioned above. The system is composed by a light source, temperature sensors, camera and test sensors. The axes permit a covering of all angles of the UUT. The plastic pieces are built in ESD (Electro Static Discharge) plastic to avoid electric problems.
The UUT is placed on the tool and fixed automatically by it. If there are no breaches in the security features, the tool takes the UUT inside the chamber and then begins the test sequence. This is one of the most important parts once the test sequence dictates the sequential steps to test
2.3 Object of study: FCT50 13
the UUT and evaluate its conformity or non-conformity. The machine is powered electrically and pneumatically and tests one unit with testing cycles of approximately 3 minutes.
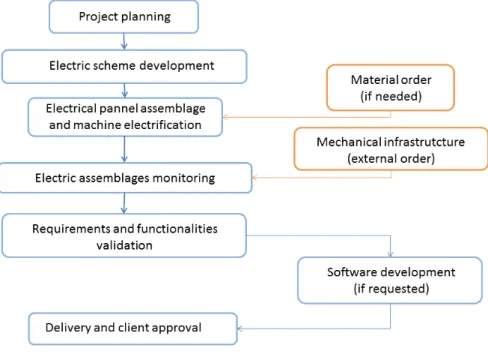
Figure2.6illustrates the production process of the machine in CONTROLAR. At orange are
steps that happen outside the company’s facilities. If there are no materials in stock, external orders are made. The mechanical structure of the machine normally comes from an external entity (mostly the client) and the electrical parts and interfaces are implemented at CONTROLAR.
Chapter 3
Sustainable manufacturing and
eco-innovation
In this chapter is made a deep analysis on several subjects related to eco-innovation relevant in the context of this study. Some tools to evaluate and understand eco-innovation are given, such as life cycle perspectives, indicators and methods to use them, the need and importance of a good benchmarking and applicable policies and legislation.
As the environmental concern has been growing, and many projects started with the goal of improving energy efficiency and reduce waste and resources consumption, the OECD created also its own project. It was launched in 2009 and aims at create “sustainable industrial production through the diffusion of existing knowledge and the facilitation of the benchmarking of products
and production processes” [4]. It promotes the development of technological solutions to the
envi-ronmental challenges in medium to long term. There have been also a lot of studies in this context, about essential matters related such as energy efficiency measurement, standards, labelling regu-lations and metrics and performance measurements. Furthermore, efforts have been made aiming
to find a way to model energy consumption at different levels in a system [18]
Energy efficiency can be achieved by two ways: directly or indirectly. Directly stands for improvements that are a direct consequence of energy savings. Indirectly, on the other side, are
savings achieved by stability, performance or productivity improvements [19]. OECD defined
some key findings, which are essential to fulfil the purpose of introducing the concept of eco-innovation. Along this chapter, the main findings are going to be approached as they are crucial matters.
3.1
Practices for sustainability and eco-innovation
The efforts to achieve manufacturing sustainability have made a huge turn on shifting from an end-of-pipe vision, where the environmental concerns come after the processes are implemented, to a product life cycle perspective comprising environmental strategies since the beginning. This
vision also provides an approach to a closed-loop production. In parallel, companies have also be-gun to accept environmental responsibilities along their value chains. The integration of methods
to improve sustainability has led to the formation of new business models (Figure3.1) that can
bring environmental benefits.
Figure 3.1: The closed-loop production system [4]
Moreover, the creation of a closed loop production focuses on the transformation of end-of-life
products into new resources by the steps described in Figure3.2.
3.1 Practices for sustainability and eco-innovation 17
In addition, more radical improvements are arising, showing the need to incorporate envi-ronmental practices and performance. Eco-design is defined as “the production, assimilation or exploitation of a novelty in products, production processes, services or in management or business methods, which aims, throughout its life cycle, to prevent or substantially reduce environmental
risk, pollution and other negative impacts of resource use (including energy)” [4].Today the focus
is still in the technological advances, but it is important to start looking beyond that and look for improvement methods independent of the technology.
According to the Oslo Manual, eco-innovation can be separated in three dimensions: targets, mechanism and impacts.
• Targets: basic focus of eco-innovation. They can be products, processes, marketing meth-ods, organizations or institutes. They can have a technological or non-technological nature; • Mechanism: method by which changes take place. There are four basic modes: modifica-tion (small and progressive process adjustments), re-design (significant changes in existing products, processes or organizational structures), alternatives (new products with the same functionality to replace other products) and creation (design and creation of new products, processes or even organizations);
• Impact: eco-innovation’s effects on the environment. Given a specific target, the environ-mental benefits can depend on the mechanism and increase along with size of the change. Different relations between targets and mechanisms can create diverse impacts, which, by attacking different problems, result in several levels of eco-innovation initiatives. Innovation has
a key role on moving industries towards sustainable production (Figure3.3).
Figure 3.3: Conceptual relationships between sustainable manufacturing and eco-innovation [4]
In Figure 3.3, the direction to the right upper corner means the increase of positive
less they tend to depend on technological development, precisely because these changes are sub-stantially bigger and involve entire organisations. Obviously, the technological development is important to the acceleration of innovation initiatives and processes, but different levels can be distinguished. Small changes in the production processes such as adjustments or modifications are much more dependent on technological advances than changing the core business or the structure of a company, that influence more cultural values or personal formation.
3.2
Life cycle assessment
Sustainable manufacturing involves changes that are facilitated by eco-innovation. Integrated initiatives may vary from traditional pollution control through cleaner production, to a life cycle view and establishment of closed-loop production. They can potentially enhance environmental
improvements but careful planning is required. As it is shown in Figure3.3, those kind of
ini-tiatives depend on different combinations of targets and mechanisms. The more integrated these initiatives are, the better environmental improvements may appear, but they depend on the use of wider range of targets and mechanisms. It can be understood that as sustainable manufactur-ing initiatives advance, the nature of eco-innovation processes becomes increasmanufactur-ingly complex and
more difficult to co-ordinate [4].
LCA (Life Cycle Assessment) is a scientific, structured and comprehensive method interna-tionally standardized by ISO 14040:2006 and ISO 14044:2006. These standards provide a crucial framework for LCA, leaving simultaneously important choices to be made by experts. The ISO 14040:2006 standard approaches principles and framework while the ISO 14044:2006 standard gives lights on requirements and guidelines for LCA.
LCA is used to qualify resources and emissions along the product life cycle. It covers a wide range of environmental impacts such as climate changes, pollution, eco-toxicity, human effects, material and energy resources, and so on. Moreover, it allows direct comparison of products and respective technologies used, by capturing the whole life cycle of the system, from the resources’ extraction until disposal and waste treatment, passing through production, use and recycling. Its
strength lies in 5 principles [20]:
• Integrated assessment framework on environmental problems; • Relative and absolute analysis in a scientific and quantitative way;
• Relation of environmental pressures to any defined type of system or product; • Avoidance of burden shifting of impacts by integration the whole life cycle;
• Easier comparison of products and identification of improvement opportunities by working on a functional unit basis.
3.2 Life cycle assessment 19
LCA embraces a cradle-to-grave perspective that quantitatively calculates material and re-sources consumption and production along all the life phases, including energy flows and environ-mental effects of a system. This perspective implies a vision of the product in its whole production
cycle and includes the diverse phases showed in Figure3.4.
Figure 3.4: Product life cycle [21]
A LCA evaluates the product life phases in terms of resources and energy flows and impacts.
It develops through the stages mentioned in Figure3.5[21]:
• Goal and scope definition: description of the system and definition of the study’s bound-aries:
– Including the purpose of the study, target-audience and communication method; – Referring assumptions made and methodologies used (e.g. for data collection); – Defining which processes and life cycle’s parts are important to include in the study. • LCI (Life Cycle Inventory): accounting stage of inputs to and outputs from the desired
system:
– Modeling the system in accordance it defined scope;
– Quantify inputs and outputs using databases and previous studies; – Generalize material and energy balances through the life cycle.
Figure 3.5: Phases of a LCA [22]
• Impact assessment: translate effects from the LCI into impacts on humanity and environ-ment:
– Estimating environmental load and its impacts based on the LCI;
– Accurate discussion with sensitivity analysis and uncertainties identification; – Aggregating outputs and results by impact categories if needed.
LCA is only now gaining ground and becoming a solid strategy because of some factors such as reproducibility difficulties, too much freedom on interpreting results, data availability and quality, uncertainty of impact assessment methods, difficulties of quality assurance, costs and complexity [6].
Materials’ role on eco-innovation
One important aspect of a LCA is the resources’ analysis and study, whether they are energetic or material resources. Thus, in parallel with energy influence, materials also have great impact on eco-innovation, and they must be very carefully chosen and designed when projecting and manu-facturing a product. Decision-makers should consider materials as a part of the business strategy. Aspects to have in mind during materials’ choice are its costs, consistency, availability, legisla-tion and manufacturability. Materials should overcome a set of evalualegisla-tion criteria before being released to the market and bacoming available to manufacturers. In an eco-design perspective, it is important to evaluate materials further than its technical features, and select renewable and bio-compatible materials rather than toxic and harmful materials that should be rejected. So, material
3.2 Life cycle assessment 21
decision-makers (stakeholders) have great influence on eco-design and its results (trade-offs) and,
consequently on eco-innovation (Figure3.6) [2].
Figure 3.6: Materials and Stakeholders interactions [2]
The SPICE model is a material classification strategy according to materials potential for eco-innovation. It is divided in five categories: stimulating, potential, incubating, common, embedded materials. The further the material reaches on the categories’ scale, the more appropriate it is for
selection (Figure3.7).
• Stimulation: are inspirational mateials for designers because of its potential for use in future applications. In spite of being desirable, they do not reach the market on any product because of its substantially high cost and inapplicability to existing products;
• Potential: materials that satisfy the preconditions’ selection but still haven’t been brought to the market in a product. They can be useful but still need an appropriate application; • Incubating: trialed materials in test products that may become part of common portfolio
products depending on their outcomes from the market and applicability;
• Common: materials consistently used in products. They are the majority of common-known materials and are replaced only when better options overcome preconditions for material adoption;
• Embedded: these materials are tied to some products and are irremovable. Materials may reach this point due to security standards or secure supply.
Figure 3.7: SPICE model [2]
3.3
Indicators
Manufacturing is one of the primary wealth generating activities because it transforms materi-als and information into goods for the satisfaction of human needs. However, turning raw material
into products is a source of environmental pollution [23].
With the industry development, quantification tools need to be defined in order to accurately measure environment or efficiency growth. Indicators help manufacturers understanding the envi-ronmental issues surrounding the production systems. They define specific goals and monitor the progress towards sustainability. There are several sets of indicators that help companies tracking and benchmarking their environmental performance.
At this point it is important to differentiate indicators from indexes and parameters. A parame-ter is a property that is measured. An indicator is a “parameparame-ter, or a value derived from parameparame-ters, which points to, provides information about, describes the state of a phenomenon/environment/area
3.3 Indicators 23
with a significance extending beyond that directly associated with a parameter value”. And an
in-dex is a set of aggregated or weighted parameters or indicators [24].
Each company has its own working environment and capacities, however, there are some cri-teria that should be taken into account when choosing a set of indicators to represent results. Companies must know what is the finality required for the indicators according to these criteria and then choose the set of indicators that best potentiate the features of interest. This means that the set of indicators must be carefully chosen according to the goal to achieve and the message to
transmit, as the example in Figure3.8[4].
Figure 3.8: RACER indicator selection criteria , adapted from [6]
The right set of indicators, as mentioned above, help companies having a more comprehensive picture of economic, environmental and social effects across a product life cycle. In order to improve equipment or processes toward efficiency, a more technical and production-oriented set
of criteria shall be used and chosen from a table like the example in Table3.1.
In parallel with the types of indicators set, there are other classifications of indicators proposed, measuring changes in energetic efficiency. Thermodynamic indicators rely only on measure de-rived from thermodynamic variables. Physical-thermodynamic are hybrid indicators that use a ra-tio of energy input in thermodynamic units to output in physical units. Economic-thermodynamic indicators are a ratio of energetic input to output measured in market value. Finally, economic indicators, measure changes in energy efficiency by using only monetary values for both energy
input and service output [25].
Eco-innovation may be environmentally driven, but can also have other motivations such as costs reduction or institutional chances. In this way, it is important to gather information in a broader range, and have a solid benchmark study knowing how companies eco-innovate, drivers
Table 3.1: Summary of sustainable manufacturing indicators [4]
Criteria
Set of indicators Comparability Applicability for SMEs Management decision-making Operational performance improvement Data aggregation and standardization Innovative products or solutions Individual indicators * *** * ** * *
Key performance indicators * * *** * * *
Composite indexes ** ** * ** *
Material flow analysis * * * *** ** ***
Environmental accounting ** ** ** *** ** **
Eco-efficiency indicators ** * ** *** ** ***
LCA indicators ** * * *** ** ***
Sustainability reporting indicators * ** ** ** * *
SRI indices ** ** *
***: Strongly suitable
**: Suitable if certain conditions are met *: Applicable though not necessarily suitable
and barriers that affect the different types of innovation and also the impacts of different eco-innovations.
Nonetheless, the first step is always the choice of what to measure, goal and purpose of the measurement to understand which category is the most adequate. Then it is the data collecting phase, preferably following a standard or test procedure and minimizing the possibility of human error. The last step are the calculations, that must also be done accordingly to mathematical
formulations and principles [26].
3.3.1 Environmental Indicators
Environmental pollution can be a direct consequence of the manufacturing process. Manu-facturing waste involves a very different range of substances that depend on the technology used,
the nature of the material and its quantities [23]. According to the scope of this project it is
in-evitable to discuss environmental indicators, as proved above by the Table3.1. This type of
indi-cators is specifically used in environmental reporting, measurement of environmental performance and progress measurement towards sustainability. Inside the category of environmental indicators there are subcategories depending on the goal of their use and to whom they are directed. Table
3.2shows different sets of environmental indicators, and their respective purpose.
When choosing an environmental indicator, it’s important to have in mind some general criteria to choose amongst policy relevance and utility for users, analytical soundness or measurability
[24]. In ApendixAa table that explains the purpose and how to use the kinds of environmental
indicators described in Table3.2can be found.
3.3.2 Resource Indicators
Resource efficiency is one of the most challenging concepts faced today by nations and the EU as a whole. Industry is intimately related with resource efficiency by offering technical and
3.3 Indicators 25
Table 3.2: Types of environmental indicators [24]
Purpose Set of indicators
Tracking progress and performance
Core Environmental Indicators (CEI): OECD has a core set of indicators covering environmental pressures issues, both direct and indirect, environmental conditions , society’s response,etc.
Informing the public
Key Environmental Indicators (KEI): a reduced set of indicators that fulfil communication purposes, informing the public and providing signals to policy makers.
Promoting integration
Sectoral Environmental indicators (SEI): help integrate environmental concerns into sectoral policies. Each set aims at a different sector and they are classified according to environmental importance, interaction or policy considerations.
Indicators derived from environmental accounting: help integration of environmental concerns into economic and resource management policies. Focus on material flow accounts, resources use and productivity.
Monitoring progress Decoupling environmental Indicators (DEI): measure the decoupling of the environmental performance from the economic growth.
technological innovation. In industry, resource efficiency is often confused with material produc-tivity which evaluates efficiency only on non-energy resources. At this point it is important to distinguish between resource efficiency and resource productivity. The first one aims to minimize the resources used when producing a unit of output. The second one deals with the efficiency of
economic activities in generating added value from the use of resources [27].
In a recycling perspective, waste can also be a resource, which contributes to resource effi-ciency by spare other new materials that would be used instead. This is one of the approached issues on the Europe 2020 program. Another one is the resource indicators’ utility when finding and evaluating improvement opportunities.
The most general indicator being used now on resource productivity, is the GPD divided by the DMC (Domestic Material Consumption), which includes metals, minerals, carbon-based fos-sil fuels and renewable energy sources. A disadvantage of this indicator is that when its value increases, it does not necessarily mean that less resources are being used, it can also mean that the economy is just growing faster than resource consumption. Consequently, surges the need to decouple material use from economic growth. This indicator is also permeable to the types of material used and waste. Indicators that concerns only water, land or carbon are needed. In this context, are defined a set of indicators called SDI (Sustainable Development Indicators). This set has indicators on the ecological capital dimension and land use dimension, with calculation of its environmental impacts and resource use dimension. The environmental impacts of land use indi-cators provide information on land cover and related land changes by accounting the interactions
between nature and society on a tight grid of 1km2.
Related to the resource use dimension attention has been paid on environmental impacts of resource use. In this dimension is essential a life cycle mind set to avoid burden shifting between
phases, sectors or countries. Table3.3presents examples on applicability of resource use
Table 3.3: Resource efficiency indicators per areas in industry [6]
Material Resources
Natural
Resources Energy Waste General Consumption of material (amount) CO2emission reductions (per product unit) Annual energy consumption Recycled material production (%) Expenditure of resource related R&D Savings of input material (amount) Emissions to air (amount) Annual energy
savings Recycling rates Savings of input material (%) Reduction of emissions to air (%) Fossil fuels required (amount) Waste collection rates (national levels) Emissions to water (amount) Average thermal efficiency (per product unit) Reduction of emissions to water (amount) Substitution of usual fuels by alternatives (%) Reduction of emissions to water (%) Primary energy consumption (%) Savings on primary energy (%)
3.3.3 Key Performance Indicators
Entities should not only work to maximize their economic goals but also to minimize their environmental concerns and impacts, so, a balance between both is needed but difficult to per-form. Within the balance, eco-efficiency can be found as it evaluates sustainability by assessing economic and environmental objectives of companies. “Eco- efficiency is achieved by the delivery of competitive-priced goods and services that satisfy human needs and bring quality of life, while progressively reducing ecological impacts and resource intensity throughout the life cycle to the
level at least in line with the Earth’s estimated carrying capacity.” [28].
It is intended to be an approach for the business sector to contribute to sustainable develop-ment, thought the pursuit of long term benefits by incorporating activities that respect a rational
resource use [27].
Nowadays, eco-efficiency is widely applied to countries, meaning that it is evaluating the po-tential of entire nations to be sustainable. It started by evaluating a wider scale and then zooming in to sectors, types of industry and specific industries. So, when evaluating general data there is a large amount of information, but as long as it gets more and more specific, it becomes more diffi-cult to find and evaluate data on small pieces. This justifies the reduction of available information with the increase of the target specification.Quantitative measurement of eco-innovation can help improving the understanding and practices and even aid policy makers to analyse trends, drivers
3.3 Indicators 27
Performance indicators play a relevant role on evaluating efficiency manufacturing processes’ efficiency in the scope of a target area, that can be cost, sustainability, energy efficiency and so on. Decision-makers in the production field need energy related KPI in order to identify companies’ specific energy uses in the production systems. They also prepare the system’s energy behaviour profile, recognize cause-effect relationships, define improvement opportunities and actions and communicate internally or externally the information. There has been a trend in studies to define a set of approaches for improving energy efficiency performance in production systems from a
machine tool level to all the country [18]. The main levels in a system can be identified as:
1. Machine level 2. Process level 3. Plant level 4. Sector level 5. Country level
All of them can be evaluated in terms of their efficiency in energy consumptions or use of resources. Moreover, studies have been developed on each level in order to improve performances and implement eco-innovation changes. As the level gets wider, the interest for this project de-creases, so the last levels will not be deeply explored.
3.3.3.1 Machine level
At machine level it is important to be as specific as possible once it is the bottom level and all the possible details should be evaluated in the most particular aspects. There is a 6 step hierarchy
defining a possible sequence to implement energy saving procedures (Figure3.9).
Figure 3.9: Hierarchical approach for energy savings at machine level [19]
A crucial aspect to take into account when evaluating energy efficiency of machines, is their energy states or working modes. Normally, machines can have several different working modes,
e.g. operation, warm-up, energy saving mode, idle, sleep and off. There can be a lot of different
states depending on the machine [18]. To determine the energy consumption of a machine it is
also important to know which consumption amount is caused by which components (integrated of peripherals), so, the monitoring procedure should be designed carefully in advance. All
sub-systems should be monitored as individually as possible. The total energy (Etotal) required by a
machine is then calculated by [23]:
Etotal= Eprocess+ Eperipherals (3.1)
Where the process energy (Eprocess) is the one required by the machine to perform its physical
process, and the peripherals energy (Eperipherals) is the additional energy consumed by the machine
(e.g. heating and cooling, overcome of efficiency losses, etc.) These peripherals energy is also a sum of background energy (energy consumed when the machine is not operating) and load dependent energy, that is influenced by the specifications of the process (e.g. work piece physical characteristics, used tool, etc.)
A common characteristic of the majority of industrial machine is that even in idle state, the machine consumes at least half of its maximum power, which provides big opportunities to reduce
energy consumptions trough better design [23]. An energy related machine assessment is always
necessary to any type of energy efficiency evaluation. There are several ways to do it and this is a flexible subject. However, it is a big advantage to have a standard test procedure and a defined method. Following this idea, a method to develop KPI and improve energy efficiency is described. In addition, another one with definition of machine testing types is presented.
e-KPI method[18]
The e-KPI serves as an example on how to transfer scientific research into industrial value and highlights the efficiency levels depending on the operation mode of energy-consuming machines. It focuses on 3 main bullet points and aims at defining:
• Initial statements of manufacturing and energy states;
• Cause and effect links between this manufacturing and energy states; • Projected future developments for the application of the method.
It first sets a frame on the industry by investigating the business, the industrial scenario, the design method and its implementation. As efficiency is currently measured based on time the e-KPI proposes to transfer this basis to energy states measurements. It creates a connection be-tween manufacturing states of a machine and its energy states through a cause-effect relation. It comprises the following steps:
• Step1 – Definition of the reference production system: by specifying the kind of dis-crete industry, the production processes and resources, and aspects of the systems such as typology, market dimension, layout and automation degree.
![Figure 2.1: Final energy use in the UE by sector (% of total) [5]](https://thumb-eu.123doks.com/thumbv2/123dok_br/15861312.1086885/24.892.239.612.182.515/figure-final-energy-use-ue-sector-total.webp)
![Figure 2.4: The bathtub curve for typical electronic devices and semiconductor devices [15]](https://thumb-eu.123doks.com/thumbv2/123dok_br/15861312.1086885/28.892.155.702.495.857/figure-bathtub-curve-typical-electronic-devices-semiconductor-devices.webp)
![Figure 2.5: Typical HALT/HASS system disposition [17]](https://thumb-eu.123doks.com/thumbv2/123dok_br/15861312.1086885/30.892.174.672.153.428/figure-typical-halt-hass-system-disposition.webp)
![Figure 3.1: The closed-loop production system [4]](https://thumb-eu.123doks.com/thumbv2/123dok_br/15861312.1086885/34.892.124.726.256.581/figure-the-closed-loop-production-system.webp)
![Figure 3.3: Conceptual relationships between sustainable manufacturing and eco-innovation [4]](https://thumb-eu.123doks.com/thumbv2/123dok_br/15861312.1086885/35.892.197.739.737.1007/figure-conceptual-relationships-sustainable-manufacturing-eco-innovation.webp)
![Figure 3.4: Product life cycle [21]](https://thumb-eu.123doks.com/thumbv2/123dok_br/15861312.1086885/37.892.180.743.255.690/figure-product-life-cycle.webp)
![Figure 3.5: Phases of a LCA [22]](https://thumb-eu.123doks.com/thumbv2/123dok_br/15861312.1086885/38.892.181.668.147.509/figure-phases-of-a-lca.webp)
![Figure 3.6: Materials and Stakeholders interactions [2]](https://thumb-eu.123doks.com/thumbv2/123dok_br/15861312.1086885/39.892.164.766.224.503/figure-materials-and-stakeholders-interactions.webp)
