A Work Project, presented as part of the requirements for the Award of a Master Degree in Management from the NOVA – School of Business and Economics.
The Effects of the Low-Interest Policy on Goodwill Impairment Tests regarding IAS 36: A Theoretical and Empirical Evaluation of the German DAX 30 Companies
MARIUS HEROLD (2659)
A Project carried out on the Master in Management Program, under the supervision of: Prof. Duarte Pitta Ferraz
Prof. Ilídio Tomás Lopes 26.05.2017
Table of Contents
List of Figures ... 2 List of Abbreviations ... 2 Abstract ... 3 1 Introduction ... 4 1.1 Preface ... 4 1.2 Relevance of Topic ... 4 2 Methodology ... 52.1 Research Question and Approach ... 5
3 Accounting for Goodwill ... 6
3.1 The Nature of Goodwill ... 6
3.2 Impairment-Test in Accordance with IAS 36 ... 8
3.3 DCF-Method ... 10
4 Literature Review ... 12
5 Empirical Evaluation ... 13
5.1 Sample Selection, Focus and Research Design ... 13
5.2 Descriptive Research ... 14
5.3 Correlation Research ... 16
5.4 Regression Model ... 19
6 Limitations ... 20
7 Conclusion and Outlook ... 21
Bibliography ... 23
List of Figures
Figure 1 - Determination of the FVLCD ... 9
Figure 2 - Method for determining the recoverable amount ... 10
Figure 3 - Average risk-free rate applied ... 11
Figure 4 - Total GW in Mio. € and Total GW Impairment ... 14
Figure 5 - Average WACC in % ... 15
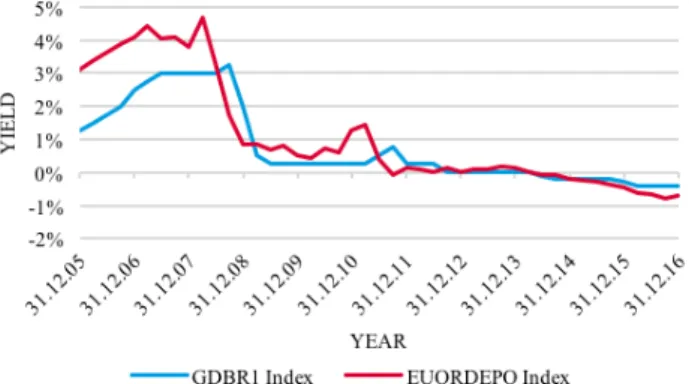
Figure 6 - Key Interest Rate vs. Government Bond Germany (1-year) ... 16
List of Abbreviations
BV Book Value
BW Badwill
CAPM Capital Asset Pricing Model
CAGR Compound Annual Growth Rate
CF Cash Flow
CV Carrying Value
DCF Discounted-Cash flow
EBITDA Earnings before Interests, Taxes, Depreciation and Amortization FASB Financial Accounting Standard Board
FV Fair Value
FVLCD Fair Value Less Cost of Disposal
GSA Germany, Switzerland, Austria
GW Goodwill
HR Human Resources
IAS International Accounting Standard IDW Institute of Public Auditors in Germany IFRS International Financial Accounting Standards
IT Information Technology
NPV Net Present Value
PPE Property, Plant and Equity
SFAS Statement of Financial Accounting Standard
US-GAAP Generally Accepted Accounting Principles of the United States
VU Value in Use
WACC Weighted Average Cost of Capital R&D Research & Development
Abstract
During numerous acquisitions, the GW positions of German DAX 30 companies have enormously risen. However, this increase cannot solely be attributed to the pure number of company takeovers but also to the introduction of IAS 36 – Impairment of Assets. On adopting IAS 36 in 2004, GW is no longer amortised but subject to an annual impairment-test. Since then, companies consider their GW positions more and more as recoverable. Although IAS 36 contains detailed regulations, many appreciation margins as well as external influences affect the GW impairment-test. Accordingly, external factors such as the low-interest policy of the ECB can be associated with GW positions and GW write-offs. This paper uses a quantitative research design and investigates the effects of the low-interest policy of the ECB on GW positions and its influence on the GW impairment-test in accordance with IAS 36 of the German DAX 30 companies. Using a sample of 24 DAX 30-listed companies over a period of 12 years, this paper shows that there is a relation between the low-interest policy of the ECB on GW positions and on GW write-offs. The negative downtrend of the KIR set by the ECB is hindering GW impairments and therefore encourages the increase in GW positions of the German DAX 30 companies.
1 Introduction
1.1 Preface
Given my past study focus both in my Bachelor’s and Master’s degree, I have always been focused on studying accounting and finance subjects. During numerous internships, I gained insights into the real business world and worked in several different companies’ accounting departments. This influence has been reflected in my Bachelor thesis, which was written in cooperation with a big German company, operating in the Chemical Industry, and dealt with their accounting procedures regarding the long-term growth rate. My strong interest in Mergers and Acquisitions, which is closely linked to the determination of a purchase price in which GW or BW takes a leading role, further convinced me to focus on GW in my thesis. As todays’ financial news often deal with the continuing low-interest policy of the ECB, I wondered if there were notable effects of this policy in the GW positions and impairments of German companies. The results of my interest are displayed in the following pages of my Master thesis.
1.2 Relevance of Topic
During numerous acquisitions in the past, the GW positions of German DAX 30 companies have enormously risen (see Kümpel & Klopper 2014a, 125). This increase, however, cannot solely be attributed to the pure number of company takeovers but also to the mandatory introduction of the Impairment-Only-Approach since 2004 in accordance with IAS 36 (see Kümpel & Klopper 2014b, 177-185). Instead of a regular amortization, this depreciation method for GW accounting demands impairments only in case of specific triggering events. The tendency of the past has shown that during their annual audits, companies consider their GW positions more and more as recoverable, which means they do not write-off GW positions in their balance sheets (see Kümpel & Klopper 2014b, 177-185) In line with this, KPMG’s Capital Cost Study 2016 revealed only 8% out of 196 interviewed companies in the GSA area have recognized a GW impairment in 2015.
Although IAS 36 obliges detailed regulations for impairment testing, there are still many appreciation margins as well as external influences that affect the mandatory annual GW impairment-test (Alves
2013; Hamberg et al. 2011). Accordingly, external factors such as the low-interest policy of the ECB and a corporation’s determination method for capital costs can possibly be associated with GW write-offs.
2 Methodology
2.1 Research Question and Approach
Given the influence of external factors on GW write-off, it is interesting to investigate the effects of the low-interest policy of the ECB on said GW positions, as well as its influence on the GW impairment-test of German DAX 30 companies. This paper therefore aims to answer two research questions:
(1) Is the low-interest policy of the ECB negatively associated with the increase of GW positions?
(2) Does the low-interest policy of the ECB affect the annually mandatory GW impairment-test regarding IAS 36?
To test these research questions, this paper applies a quantitative approach. It analyses data extracted from Bloomberg for the German DAX 30 companies over a period of twelve years, first displayed in Excel, and then tests relationships statistically using SPSS.
The remainder of this thesis comprises seven sections. To answer the research questions in detail, the theoretical principles of GW accounting will be introduced hereafter in the third chapter. In section four, existing literature will be reviewed and discussed. This section is the academic fundament of this paper but should also demonstrate how this paper differs from other research. The main topic of this paper is represented in chapter five: the effects of the low-interest-rate policy of the ECB on the GW positions of the German DAX 30 companies will be empirically evaluated. In the sixth chapter the limitations of the paper will be reviewed. The seventh and last chapter will resume the major findings of this thesis. The formulated research questions will be recapitulated and the thesis’ topic then critically appraised by highlighting the value of the paper. Finally, further research options and an outlook for the future will be presented.
3 Accounting for Goodwill
3.1 The Nature of Goodwill Goodwill Basics
Due to academic perspectives, GW is considered an amount paid to earn abnormal profits on investments (see Wen & Moehrle 2015, 4). In the past, GW was considered a value-adding amount, which adds value to an acquiring company in form of ‘name, reputation, connection, introduction to old costumers […] and others’ (Dicksee & Tillyard 1906, 2-4). With progressing technology and the innovation of companies, Cañibano et al. (2000) debate that GW is associated with an investment in intangible assets like R&D, HR, Marketing and IT. Consequently, they state GW also generates future value for the acquiring company, just like tangible assets e.g. PPE or inventory. From a legal perspective, Osborne (2012) argues that GW is a package of propriety rights, which enables the owner of an acquiring company to create value and generate profits. Both legal and economic approaches identified the additional value of a GW for a company. How accounting principles account for the residual amount of GW will be explained in the further course of this chapter.
Creation of Goodwill
Responsible for the recording of GW is the accounting principle IFRS 3 - Business Combinations, which is relevant for capital-orientated companies in Germany since 2004. To achieve a worldwide harmonization of GW accounting, this standard was introduced to the relevant US-GAAP principles in May 2010 (see Kuhlewind 2014, 483-484).
The scope of IFRS 3 covers those transactions defined as business combinations. A business combination results when a company gains control over another one or over various business segments (see Zelger 2014, 142). Business combinations can take place in form of share deals, asset deals or mergers. Irrespective the form of transaction, there are consequences for the individual statements of all involved companies (see Pellens et al. 2014, 737-739). According to IFRS 3, business combinations are accounted for using the acquisition method. At the time of acquisition, identifiable assets, liabilities and
non-controlling interests must be assessed and valued. Furthermore, the resulting GW or negative difference (BW) needs to be determined separately and accounted for (see IFRS 3.4.-3-36; Zelger 2014, 145).
Based on the acquisition method, the FV of the assets and liabilities of the acquired company are calculated for the Purchase Price Allocation. These calculations often rely on NPV-methods (see Kunowski 2015, 903-904). After valuing all assets, liabilities, hidden reserves and deferred taxes with regard to the relevant accounting principles, a difference between purchase price and FV of the acquired company arises (see IFRS 3.32; Beumer & Hense 2015, 1199). This difference represents a residual figure. In case of a positive figure the amount can be defined as GW (see IDW 2015). In the event of a negative amount, the calculations must be reassessed in accordance with IFRS 3.56 (a) and afterwards recognized in profit and loss in accordance with IFRS 3.56 (b). Due to IASB the GW is characterized as an intangible assets (see Pellens et al. 2014, 748). A simplified calculation of the GW is represented in Appendix 1 (see IDW 2015).
Components of Goodwill
Both IASB and FASB name six components of GW (see Appendix 2). From a conceptual view, both do not include the first two components as part of GW. Instead, Measurement conservatism is the excess of FV over CV in the acquired company. Recognition conservatism is linked to unrecognized operating net assets of the acquired company and to assets and liabilities which do not fulfil the relevant definition nor the recognition criteria. The third component is the Going-concern element, representing the ability of an acquired company (stand-alone basis) to earn excess returns on net assets, not realized if the company would have held the assets separately. Furthermore, the synergy element of core GW quantifies the FV of expected synergies when incorporating the acquired company into the acquirer. Fifth, a Measurement error is related to transferred considerations, not defined as assets. Finally, the sixth component is an Overpayment/Underpayment of the acquiring company (see Johansson et al. 2016, 15).
Treatment of Goodwill
Reflecting IFRS 3, there is no scheduled depreciation for GW as an intangible asset. In fact, IFRS 3 provides a non-scheduled approach in case of an identifiable reduction in value (impairment). To identify such an impairment for GW positions, specific indicators, so called triggering events1, must be tested for on a regularly basis but at least once a year. The annual review of the GW value is referred to as Impairment-only-approach. According to IASB, this approach is justified by the indefinite useful life of an intangible asset (see Pellens et al. 2014, 774-775). To execute an annual GW impairment-test, the GW must be assigned to specific CGUs2. This is necessary as the balance sheet item ‘Goodwill’ does not generate any CF itself (see IAS 36.81) The approach of impairment testing is regulated in IAS 36 – Impairment of Assets, which will be explained in the following.
3.2 Impairment-Test in Accordance with IAS 36
As mentioned above, companies must test the persistence of their GW on a regular basis. They are free to determine when to carry out the impairment-test out during the financial year. However, the once determined date must be maintained for subsequent years. If the chosen date for impairment-test is not at the end of the fiscal year, potential triggering events must be checked again at year end (see Pellens et al. 2014, 302).
The approach of impairment testing serves to guarantee a true and fair view as well as a fair presentation of the company (see Lhaopadchan 2010, 122; Schumann 2008, 205).
Focussing on the impairment-test itself, the regulations of IAS 36 ensure that intangible assets are not valued higher than their recoverable amount. In accordance with IAS 36.18, the recoverable amount is the higher value of FVLCD and VU. If the recoverable amount is less than the carrying amount, the
1 ‘
IAS 36 gives a list of common indicators of impairment from external and internal sources of information that should be considered, such as: increases in market interest rates, market capitalization falling below net asset carrying value or the economic performance of an asset being worse than projected in internal budgets’ (PWC 2009, 4).
2 In accordance with IAS 36.66 a CGU is ‘the smallest identifiable group of assets that generates CF that are
asset is considered as impaired. In this case, a company is obliged to account the difference between recoverable amount and carrying amount (see IAS 36.58-36.64).
To determine the FVLCD, a fictitious sale of the CGU is assumed (see Beumer & Hense 2015, 1211). Accordingly, the determination of the sale price after deduction of the associated costs of sale must be done at market conditions. The regulations of IFRS 13 provide a hierarchy, categorized into three levels, for the fair value measurement (see IFRS 13.72 - 13.90):
Consequently, the FLVCD is preferably to be determined using relevant information provided by the market (market approach). If not possible, the cost approach must be considered, which implies the cost of replacement for an asset. However, in practice most companies rely on the income approach because of non-existent or insufficiently observable data. Under this approach, companies use the best information available. Put differently, they calculate the FVLCD based on discounted, predetermined amounts reflecting future market expectations. In most cases these amounts are CFs (see Beumer & Hense 2015, 1211-1212; IFRS 13.62).
This fact is also mentioned in KPMG’s Capital Cost Study 2016. In Figure 1 it can be observed that 90% of the companies in the GSA region use NPV-calculations like the DCF-method.
Focussing on the determination of the VU, the regulations of IAS 36.30 et seq. oblige to compute the NPV using the DCF-method (see Beumer & Hense 2015, 1211-1212). Nevertheless, IAS 36 provides many restrictions for determining the VU for a CGU. The determination should reflect the following elements (see IAS 36.30): estimation of future
Figure 1 - Determination of the FVLCD (own representation based on KPMG 2016, 42)
CF the company expects to derive from the CGU, estimated change of CF, application of a market risk-free rate for CF discounting, consideration of an inherent risk for the CGU and other factors that might influence the value of a CGU. A detailed concretization of these elements can be found in the regulations from IAS 36.33 to IAS 36.57 and will not be further discussed here.
In summary, both values – VU and FVLCD – can be determined via a suitable DCF-method. However, the regulations for the determination of the recoverable amount differ for VU and FVLCD. To determine the FVLCD the regulations of IFRS 13 are relevant, while for the VU the regulations in the Annex of IAS 36 apply.
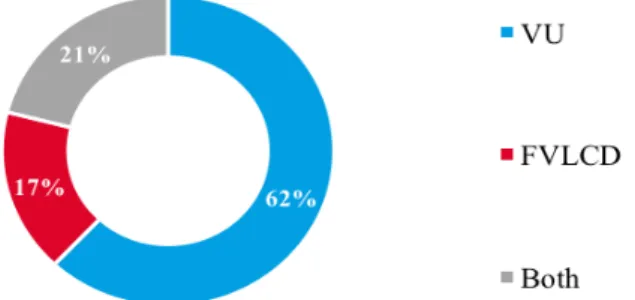
In Figure 2 it is shown which method for determining the recoverable amount is most frequently used in practice. The diagram shows that more than 80% of the considered companies in the GSA region determine the VU and the FVLCD, of which 62% solely calculating the VU.
3.3 DCF-Method
For the further procedure, the examined companies are assumed to determine their recoverable amounts in line with IAS 36 by applying a DCF-method for the VU.
Although there are different approaches to the DCF-method, it is assumed only the WACC-approach is applied, since it is (1) recommended by the IDW and (2) found in most annual reports (see IDW 2015). Although CF-forecasting plays an important role in determining the recoverable amount, it will – due to scope limitations – not be further discussed here. For CGUs with an assigned GW, this GW is usually assumed to have an indefinite useful life (see Beumer & Hense 2015, 1214-1215). Accordingly, the present value of a CGU is determined for both the VU and the FVLCD by applying the following simplified formula (see Dörschell et al. 2012):
86% 10% 4% DCF-method Market-orientated method Both
Figure 2 - Method for determining the recoverable amount (own representation based on KPMG 2016, 42)
𝑁𝑃𝑉$%& = 𝐶𝐹+ (1 + 𝑊𝐴𝐶𝐶)++ 2 +34 𝐶𝐹254 𝑊𝐴𝐶𝐶 − 𝑤 × 1 (1 + 𝑊𝐴𝐶𝐶)23
As seen in the formula, the WACC has an important role in calculating the recoverable amount. The discount rate takes into account the specific, inherent risk of a CGU and includes a market assessement of the interest rate effect (see Beumer & Hense 2015, 1216). The WACC is calculated by (see Dörschell et al. 2012):
𝑊𝐴𝐶𝐶 = 𝐸
𝑇 × 𝑟=+ 𝐷
𝑇 × 𝑟? 4
The risk-adjusted return expectations of equity investors are determinable for sectors only, not for individual assets (see Ballwieser 2011, 97-103). Due to a lack of market information, no concrete statements can be made about the return expectations of equity investors with respect to individual CGUs. Therefore most WACC calculations rely on the CAPM5, which calculates return expectations of equity investors is presented as follows (see Dörschell et al. 2012):
𝑟= = 𝑟A+ 𝛽 × 𝑟C− 𝑟A 6
In this thesis, the focus will be on the risk-free interest rate. The market risk premium and beta will not be further elaborated. The risk-free interest rate represents a minimum fee for the transfer of a certain amount within a fixed period (see Reinke 2010).
3Where 𝑁𝑃𝑉
$%& = Net Present Value at time 0; 𝐶𝐹+ = CF in period t; 𝐶𝐹254 = CF after detailed forecast period;
𝑊𝐴𝐶𝐶 = discount rate; 𝑤 = growth rate; 𝑡 = current period; 𝑇 = number of years of the detailed forecast period
4 Where 𝐸 = Equity, 𝐷 = Total Liabilities; 𝑇 = Total Capital; 𝑟
= = return expectations of equity investors; 𝑟? =
cost of debt
5 For detailed information about the CAPM see Ensz & Pope (2003). 6 Where: 𝑟
A = risk-free rate; 𝑟C = expected return of the market portfolio; 𝛽 = beta factor
4, 9% 4, 4% 4, 3% 4, 3% 3, 9% 3, 3% 3, 1% 2, 3% 2,6% 1, 8% 1, 5% 0% 1% 2% 3% 4% 5% 6%
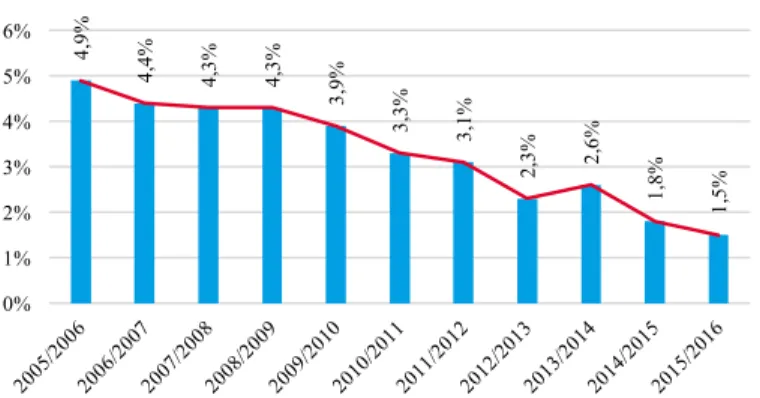
Figure 3 - Average risk-free rate applied (own representation based on KPMG 2016,23)
Accordingly, the interest rates of fixed-income securities with best creditworthiness are often used to determine the risk-free rate. Examining the applied risk-free rate in the GSA region closer, a clear downward trend since 2005 can be observed (see Figure 3). This raises questions: what caused this tendency? Which role the played the ECB? What potential impacts has this on GW positions of the DAX 30 corporations? Next, the exisiting literature will be reviewed, followed by an outline of the further procedure.
4 Literature Review
This paper contributes to the existing literature in several ways. First, it employs an empirical evaluation of GW positions and impairments under IFRS. Although there are studies covering the treatment of GW with special regard to US firms, little empirical evidence can be found for firms reporting under IFRS. Second, it puts special emphasis on recent external, macro-economic events by focussing on the WACC in a period of low-interest rates, instead of focussing on managerial discretion in CF estimation. Third, it combines the mentioned research fields of GW impairment under IFRS and determinants of GW and expands it with the recent market environment as new dimension.
Nevertheless, the timeliness of GW impairments was always in focus since the introduction of the impairment-only approach. A recent literature review about this topic is provided by Schatt et al. (2016). Although there exist studies on determinants of GW write-offs under IFRS (André et al. 2016; Feist 2013; Hamberg et al. 2011) most of these studies focus on management discretion in GW impairment (see André et al. 2016; Amiraslani et al. 2013; Beatty & Weber 2006; Feist 2013; Glaum et al. 2015; Hamberg et al. 201, Li & Sloan 2012; Ramanna & Watts 2012; Watts 2003). André et al. (2016) examine the patterns of GW impairment in Europe and the US while Feist (2013) observes the effect of news sentiment as a determinant for GW write-offs. Beatty&Weber (2006) examine how stock markets and contract incentives affect accounting choices by US multinationals. Ramanna & Watts (2012) examine the effect of agency-based motives on accounting choices, namely the non-impairment due to intrinsic/selfish motives. The further use linguistic analysis to test the effect of private information on
GW write-offs. Hamberg et al. (2011) examine if there is a relationship between the decision to impair and the leverage, stock market turnover, earnings-based management compensation and entrenchment. Surprisingly, they find mostly entrenchment has a weak significant influence on the impairment decision. Amiraslani et al. (2013) focus on the timeliness of asset impairment and asset losses. Finally, Glaum et al. (2015) apply the largest model, including the largest number of independent variables, among them stock market return, ROA, management compensation, CEO-Turnover, Segments of sub-units, Leverage and size (see Glaum et al. 2015, 15f).
As most literature reviewed concludes that a firms’ GW impairment decisions are related to performance measures, firm-level information and managerial discretion, this paper expands the existing literature by examining accounting for GW under an economic perspective.
5 Empirical Evaluation
5.1 Sample Selection, Focus and Research Design
This paper evaluates the firms’ annual reports of the German DAX 30 from 2005-2016. As stated in the research questions it mainly focuses on GW positions, GW impairments and the capital costs. Based on insights from the literature review, further balance sheet items and performance indicators for the individual firms were examined. This financial information was mainly obtained from Bloomberg. In case of inconsistency, the annual reports have been checked for completion and plausibility.
The final sample (see Appendix 3) excludes banks and insurance companies (Commerzbank, Deutsche Bank, Allianz and Münchener Rück). Furthermore, Vonovia has been excluded, due to missing data from 2005-2008. Fresenius Medical Care has also been excluded from the sample, since the company reports under US-GAAP, for which the regulations of the FASB are compulsory.
The aim of the empirical evaluation is to examine a possible and plausible link between ECB policy and GW positions, GW write-offs and capital cost calculation. It should be demonstrated that the ECB's policy is partly to blame for the ongoing increase of GW positions of the German DAX 30 companies.
Therefore, a quantitative research design has been chosen. Apart from correlation analyses to test if a relationship exists, first the overall development of the positions GW positions and impairments as well as the development of the average WACC and the yield of 1-year German Government Bonds are displayed and described before the correlation analyses are presented. For all correlation analyses, and for the regression analysis too, the year 2010 has been excluded from the data base due to unreliably high values in the WACC which would distort the findings (see Figure 5).
All correlation analyses are Pearson correlation analyses because the variables analyses are scale variables. Furthermore, instead of using actual values for GW impairments, GW positions, Leverage and Total Assets, these values have been classified to ease the regression analysis. The exact classes and ranges can be found in Appendix 4. Additionally, the examined discount rates are assumed to be after-tax.
5.2 Descriptive Research
First, an overview of how GW positions and the associated write-offs have developed over the past years is provided. The focus will also be on the development of the ECB interest rate policy and of short-term government bonds from Germany. These evaluations aim to provide the reader with a feeling for the relevance of this paper’s topic.
Development of Goodwill Positions and Impairments
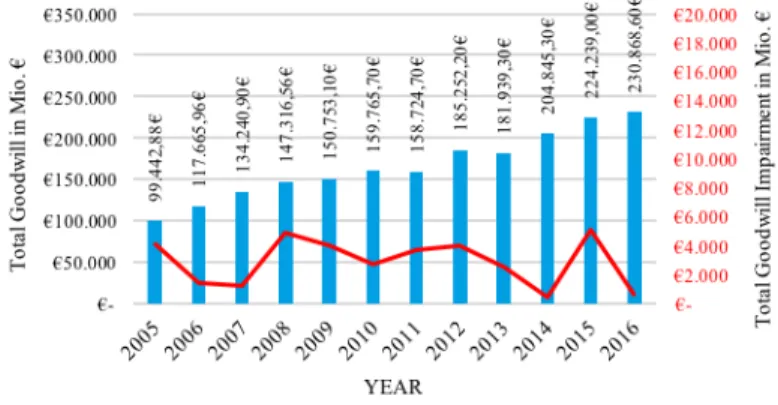
Figure 4 illustrates how the total GW positions of the sample have risen in the past twelve financial years. On average, there is an increase in GW from 4.143 Mio. € (2005) to 9.620 Mio. € (2016)
per company (see Appendix 5). Thus, the average GW per company has increased by 230%.
Considering the proportion of GW to total assets, an increase of 10,7% in 2005 to 18.6% in 2016 is observed (see Appendix 6). This implies that the GW positions (CAGR: 7,96%) of the examined companies have risen proportionally stronger than total assets (CAGR: 4,06%). The percentage of GW to assets can reach remarkable extents, as seen for example in the specific cases of Fresenius and SAP. Both companies accounted 50% of their assets in GW in 2016 (see Appendix 7).
Even more alarming is the development between GW and equity. In 2005, the proportion of GW to equity averaged 36%, whereas in 2016 it was nearly twice as much (70%) (see Appendix 8). Seven out of the 24 examined companies exceed a GW/equity ratio above 100%, up to 269% (see Appendix 9). Accordingly, the inherent risk of individual GW positions of the sample is obvious. In extreme cases, a total depreciation on GW would reduce a substantial amount of total assets and partly erode the entire equity. This would lead to an over-indebtedness of the company and could result in insolvency. Based on the present findings it is to assume that the depreciation on GW position have simultaneously increased. However, looking at Figure 4 it becomes obvious that the depreciation took place rather irregularly in the observed period. Impairments of GW were anything but as parallel to the development of GW positions. If a depreciation took place, it was only partial and triggered from single companies (see Appendix 10).
Development of Capital Costs
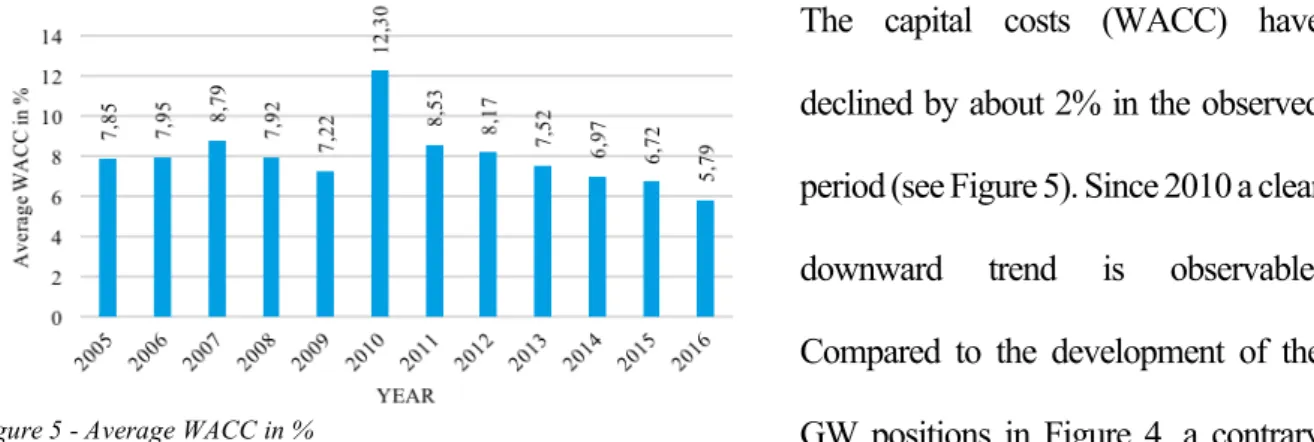
The capital costs (WACC) have declined by about 2% in the observed period (see Figure 5). Since 2010 a clear downward trend is observable. Compared to the development of the GW positions in Figure 4, a contrary development can be observed. While the WACC declines in the observed period, apart from an
irregularity in 2010, GW positions have risen in the observed period. This counter-movement might be a first indicator that a change in WACC, concretely a decrease in the average WACC, causes an increase in GW positions or at least affects the development of GW positions. To further investigate the type of relation and significance of this first impression, resulting from observations made here, a correlation analysis will be executed in the subsequent part of the chapter. As the paper aims to specifically analyse the effect of a low-interest policy on GW positions and the WACC approach, as described above, incorporates the risk-free rate set indirectly by the ECB, a correlation analysis between both risk-free rate and WACC and then WACC and GW Impairments will be done.
Development of KIR and Government Bond Germany (1-year)
To further establish the link between the ECB‘s low-interest policy and the impact of said policy on the WACC and indirectly on the GW positions, in a first step the relation between the ECB policy and WACC will be shown. As seen in the WACC formula before, an element in the calculation is the risk-free rate. Most companies use government bonds as estimates to risk-free investments (see KPMG Capital Cost Study 2016, 24). As observable in Figure 6, the yield-curve of 1-year German Government Bonds (GDBR 1 Index) seem to correspond to the curve of the KIR (EURODEPO Index). Any changes in the KIR, which is set by the ECB, can be observed similar shortly after in the 1-year German Government Bonds rate. Consequently, it can be assumed that the ECB indirectly influences the WACC, as part of the WACC is determined using the risk-free rate.
5.3 Correlation Research
The developments described in section 5.2 will now be examined in a statistical context. For the statistical evaluation, two variables are tested for correlation. This serves to establish patterns between
ECB policy, WACC, GW positions and GW impairments. The investigated relationships will be first described and then interpreted.
Correlation between KIR and Government Bond Germany (1-year)
As described above, the examined companies mostly apply the yield of 1-year German Government Bonds as the risk-free rate in their WACC calculations. Consequently, the aim of the correlations analysis between the KIR of the ECB and the yield of 1-year German Government Bonds is to show that the ECB policy can indirectly affect GW impairments. As observable in Figure 6, the development of KIR and the yield of 1-year German Government Bonds is almost simultaneous. Using a correlation analysis, the relationship of this observation is now to be demonstrated statistically. Therefore, the null hypothesis is phrased as follows:
H0: There is no relationship between KIR and 1-year German Government Bonds (r=0) Since KIR (EUROPDEPO) and the yield of the of 1-year German Government Bonds (GDBR1) are scale variables, a Pearson correlation analysis will be conducted. The results are presented in Appendix 11.
The result shows that the null hypothesis can be rejected with a confidence-level of 99%. Furthermore, there is a relationship between GDBR1 and EURODEPO of r=0.866 which indicates a strong positive linear correlation. As a conclusion, the higher/lower the yield of EURODEPO, the higher/lower the yield of the GDBR1. The statistical significant result thus indicates that KIR and 1-year German Government Bond are positively correlated.
Correlation between Government Bond Germany (1-year) and WACC
The aim of the correlation analysis between the yield of 1-year German Government and WACC is to show that the WACC variates like the yield of the 1-year German Government Bond. After showing the significant relationship of the KIR and the yield of 1-year German Government Bond, the extent to which the yield of 1-year German Government, representing the risk-free rate, is related to the WACC. The following null hypothesis is formulated:
H0: There is no relationship between 1-year German Government Bonds and WACC (r=0) The values of 1-year German Government Bonds (GDBR1) and WACC are scales variables, which is why again a Pearson correlation analysis will be performed. Appendix 12 depicts the results.
The outcome of this correlation analysis indicates a weak positive linear correlation of r=0.265. The result is statistically significant and the null hypothesis can be rejected with a confidence-level of 99%, too. The weak correlation might be due to the different elements influencing the WACC. As seen in the formula for the WACC calculation, the expected market return, the company specific beta, its cost of debt and the debt-to-capital/equity-to-capital -ratio are important elements in determining the WACC. Therefore, it is to assume that these elements aggregate to a higher weight in importance for the WACC calculation. Nevertheless, even if the correlation is weak, the risk-free rate, represented by the 1-year German Government Bond, has an impact on the WACC and can be considered as one of many ‘adjustment screws’ affecting GW impairments.
Correlation between WACC and GW Impairments
Since apart from the CFs, the WACC is essential in the determination of the recoverable amount using the DCF method, the correlation between WACC and GW impairments is expected to be a negative one. It is expected the lower the WACC, the lower the impairments. Therefore, the null hypothesis is as follows:
H0: There is no relationship between WACC and GW Impairment (r=0)
Both values, WACC and GW Impairment are scale variables, so that a Pearson correlation analysis is carried out. The results can be found in Appendix 13. The correlation analysis revealed a weak negative correlation of r=-0.355. Accordingly, the null hypothesis can be rejected with a confidence level of 99%. The weak negative correlation can be explained based on the following.
Apart from the WACC, the CF prediction plays an important role for calculating the recoverable amount with the DCF-Method (see Beumer & Hense 2015, 1214-1215). Predicting the CFs inhibits a high degree of management discretion. Numerous studies showed that CF prediction is by nature very
subjective and hard to verify, as it depends on expectations (see André et al. 2016; Amiraslani et al. 2013; Beatty & Weber 2006; Feist 2013; Glaum et al. 2015; Hamberg et al. 201; Li & Sloan 2012; Ramanna & Watts 2012; Watts 2003).
Although the found correlation is not very strong, the result is statistically significant. Again, the WACC and therefore the ECB policy as part of the risk-free rate determination seem to have an impact on GW impairments.
5.4 Regression Model
The previous analyses have revealed that the KIR as part of the WACC determination weakly relates with GW positions and GW impairments. Accordingly, and as already described in the literature review, other influencing factors, which might also have an impact on GW impairments, must be further examined. Especially in literature, it is assumed that earnings management plays a key role when it comes to the impairments of GW (see Alves 2013). Based on the prior findings and the theoretical background of existing literature the following regression model has been set up to assess the relation between GW impairment and further influencing factors.
𝑮𝑊𝑹𝒂𝒏𝒈𝒆 𝑷𝒐𝒔𝒊𝒕𝒊𝒐𝒏 = 𝛽Q+ 𝛽4 𝑊𝐴𝐶𝐶R + 𝛽S 𝐺𝑊UCVRW + 𝛽X 𝐿𝑒𝑣𝑒𝑟𝑎𝑔𝑒R + 𝛽^ 𝐸𝐵𝐼𝑇𝐷𝐴R +𝛽a 𝑃𝑒𝑟𝑓𝑜𝑟𝑚𝑎𝑛𝑐𝑒R + 𝛽g 𝑆𝑖𝑧𝑒R + 𝛽k 𝑆𝑒𝑐𝑡𝑜𝑟+ 7
Independent Variables
Given the WACC is not the only factor affecting GW impairments, other independent variables are introduced. Previous studies especially suggest Leverage, EBITDA, Performance and Company Size to be associated with GW impairments8. Further, GW positions and Sector are of relevance, given that
7 Where: 𝛽
Q is a constant, 𝛽4 to 𝛽k are coefficients; 𝛽4 𝑊𝐴𝐶𝐶 = WACC reported in Bloomberg in year ‘i’ per
company; 𝛽S 𝐺𝑊_𝐼𝑚𝑝_𝑅 = Amount of GW impairment reported in year ‘i’ per company, classified into ranges
(no/middle/high impairment) 𝛽X 𝐿𝑒𝑣𝑒𝑟𝑎𝑔𝑒 = Ratio between the book value of liabilities and total assets in year ‘i’ per company, classified into ranges (low/middle/high); 𝛽^ 𝐸𝐵𝐼𝑇𝐷𝐴 = Earnings before interests, taxes,
depreciation and amortization in year ‘i’ per company; 𝛽a 𝑃𝑒𝑟𝑓𝑜𝑟𝑚𝑎𝑛𝑐𝑒 = Stock performance in year ‘i’ per
company; 𝛽g 𝑆𝑖𝑧𝑒 = Size per company measured in total assets in year ‘i’ per company; 𝛽k 𝑆𝑒𝑐𝑡𝑜𝑟 = Sector company ‘t’ belongs to
8
See studies of Hamberg et al. 2011, Mohd Ali et al. 2008 and Jiang et al. 2008 for Leverage and GW relation; for proof of negative association of EBITDA and Accruals see , Chen et al. 2007 and Yang et al. 2008; for Stock
Performance see Beatty & Weber 2006, Chen et al. 2004 and Shah et al. 2009; for Size see Banderlipe 2009,
previous GW determines how much could be potentially impaired and some sectors are more likely to engage in business combinations which give rise to GW.
Regression Results
The multivariate regression further establishes the found relationship between WACC and GW and reveals more variables significantly influence the development of GW. All results are tested of significance on a 90% confidence interval level, indicating a significant influence if Sig.<0.1 (see Appendix 14). Apart from WACC also EBITDA, Stock Price, Sector and Leverage Range have a significant impact on the development of GW. All variables have a positive relationship with the GW positions (see Appendix 14). However, Total Assets and GW Impairment Range cannot be considered to help explain and forecast the development of GW Range because their results are not statistically significant (Significance >0.1).
6 Limitations
One limitation of this analysis is its narrow view and special focus on the ECB policy. Although further variables have been included and tested as statistically significant in the regression analysis, the model is not complete and thus its results must be interpreted with caution. Further, the statistical examination analysed correlation between variables, not the causal relationship. Another limitation is the evaluation at company level and not at CGU level. As goodwill is assigned to different CGUs, the examinations should ideally be performed using the data for the single CGUs. Additionally, the changing yield expectations of the market have been ignored. In case of falling interest rates, the return expectations of the market are also decreasing and thus the WACC, including the market expectations, would be further adjusted. Last, all data used for the analyses stems from Bloomberg and is not complete. The WACC might not represent the actual WACC used inside the companies, as Bloomberg calculates the WACC based on proxy data (see Moreale 2016).
7 Conclusion and Outlook
The determination of the recoverable amount for GW impairment purpose is mostly performed via a DCF-method. In case the carrying amount exceeds the recoverable amount, an impairment is necessary. However, since IASB introduced the new accounting principles in 2004, a steady increase of GW positions was identified. Unlike the increase in GW, impairments of GW were anything but parallel to the development of GW positions of the DAX 30 companies.
The analyses performed in this thesis have proven the existence of a relation between the KIR and the WACC. Although the results are not free of limitations and must be interpreted with caution, they are still reliable. The KIR, set by the ECB, is proven to affect the yield of 1-year German Government Bonds, used as an estimate for the risk-free rate within the WACC calculation. The negative downtrend in the KIR lowers the WACC, which hinders GW impairments and therefore encourages the persistence in GW positions of the German DAX 30 companies.
The correlation analysis revealed a weak but statistically significant association between KIR and WACC and between WACC and GW impairments. Therefore, it can be concluded that the low-interest policy affects the WACC indirectly: the risk-free rate, reflected by the 1 year Government Bond, correlates to the KIR, set by the ECB. As the WACC is calculated by plugging in the risk-free rate and there is a proven impact of the WACC on GW impairments, it can be assumed that the ECB policy negatively influences GW impairments. Accordingly, and to answer Research Question (1), it can be stated that the ECB policy affects the mandatory annual GW impairment-tests according to IAS 36. Further, regarding Research Question (2), it can be assumed that the low-interest policy of the ECB is negatively associated with the increase in GW positions.
In addition to these findings, further relevant factors in determined GW positions have been identified in a regression analysis in this thesis, like EBITDA, companies sector and stock performance. Nevertheless, these factors were analysed in other studies regarding management discretion. Contrary to the existing literature within the field of management discretion, this paper focuses on an economic
interrelation of the ECB’s low-interest policy and increasing GW positions as well as missing GW impairments. The evaluations within this paper demonstrate that external factors, like the KIR, offer a solid argument for the business world to characterize their GW positions as valuable.
The ongoing trend of rising GW positions suggests that companies try to avoid depreciation at all costs. Especially as a signal for company performance, impairments on segments could be perceived as negative signals for investors and could lead to a slump in share price. The prevention of GW impairments suggests GW positions are ‘artificially inflated’ and thus the development of a GW bubble can be assumed. This would, of course, not be in the interest of investor protection and would not ensure a true and fair view of the company (see Lhaopadchan 2010, 122; Schumann 2008, 205).
In the future, increasing GW positions of the DAX 30 companies will gain further momentum. The impairment-only approach is to be questioned critically, if no decisive changes are made in the IFRS accounting principles. The IAS 36 principles provide too many discretion margins to argue for a valuable GW. To counteract this, further research should deal with the individual influence factors determining the recoverable amount to better understand these factors. Its aim should be greater transparency in the use of GW impairments. Annual parameters (e.g. risk-free rate, growth rate) could be defined and binding for companies in their annual GW impairment-test. With the help of such standardized parameters or ranges of parameters, further harmonization of IAS 36 could be achieved.
Bibliography
Alves, S., 2013. The Association Between Goodwill Impairment and Discretionary Accruals: Portuguese Evidence. Journal of Accounting, Business & Management, 20(2), pp.84–98.
Amiraslani, H., Iatridis, G.E. & Pope, P.F., 2013. Accounting for Asset Impairment : A Test for IFRS Compliance Across Europe,
André, P., Filip, A. & Paugam, L., 2016. Examining the patterns of goodwill impairments in Europe and the US. Accounting in Europe, 13(3), pp.329–352. Available at:
http://dx.doi.org/10.1080/17449480.2016.1260748.
Ballwieser, W., 2011. Unternehmensbewertung 3rd ed., Stuttgart: Schäffer-Poeschel.
Banderlipe, M.R.S., 2009. The impact of selected corporate governance variables in mitigating earnings management in the Philippines. DLSU Business and Economics Review, 19(1), pp.17–27.
Beatty, A. & Weber, J., 2006. Accounting discretion in fair value estimates: An examination of SFAS 142 goodwill impairments. Journal of Accounting Research, 44(2), pp.257–288.
Beumer, J. & Hense, H., 2015. Die Bewertung des Goodwills nach IAS/IFRS. In V. H. Peemöller, ed. Praxishandbuch der Unternehmensbewertung. Herne, pp. 1193–1241.
Cañibano, L., Garcia-Ayuso, M. & Sánchez, P., 2000. Accounting for intangibles: a literature review. Journal of Accounting Literature, 19, pp.102–130.
Chen, C., Kohlbeck, M. & Warfield, T., 2004. Goodwill valuation effects of the initial adoption of FAS 142,
Chen, K.Y., Elder, R.J. & Hsieh, Y.-M., 2007. Corporate Governance and Earnings Management: The Implications of Corporate Governance Best-Practice Principles for Taiwanese Listed Companies. Journal of Contemporary Accounting & Economics, 3(2), pp.73–105.
Chung, R., Firth, M. & Kim, J.B., 2002. Institutional monitoring and opportunistic earnings management. Journal of Corporate Finance, 8(1), pp.29–48.
Dicksee, L.R. & Tillyard, F., 1906. Goodwill and its treatment in accounts, Available at: http://www.ncbi.nlm.nih.gov/pubmed/15003161%5Cn
Dörschell, A. et al., 2012. Der Kapitalisierungszinssatz in der Unternehmensbewertung: Praxisgerechte Ableitung unter Verwendung von Kapitalmarktdaten 2nd ed., Düsseldorf: IDW.
Ensz, L. & Pope, G., 2003. Understanding risk and return , the CAPM , and the Fama-French three-factor model. Tuck school of business at Dartmouth, 111(3), pp.1–14.
Feist, K., 2013. Determinants of Goodwill Write-Offs: The Role of News Sentiment. SSRN Electronic Journal, (January). Available at: http://www.ssrn.com/abstract=2098223.
Glaum, M., Landsman, W.R. & Wyrwa, S., 2015. Determinants of Goodwill Impairment: International Evidence. SSRN Electronic Journal, (March). Available at: http://www.ssrn.com/abstract=2608425. Hamberg, M., Paananen, M. & Novak, J., 2011. The Adoption of IFRS 3: The Effects of Managerial
Discretion and Stock Market Reactions. European Accounting Review, 20(2), pp.263–288. IASB, IAS 36 - Impairment of Assets,
IASB, IFRS 13 - Fair Value Measurment, IASB, IFRS 3 - Business Combinations, IDW, 2015. IDW RS HFA 40.
Jiang, W., Lee, P. & Anandarajan, A., 2008. The association between corporate governance and earnings quality: Further evidence using the GOV-Score. Advances in Accounting, incoporating Advances in International Accounting, 24(2), pp.191–201. Available at:
http://dx.doi.org/10.1016/j.adiac.2008.08.011.
Johansson, S.E., Hjelström, T. & Hellman, N., 2016. Accounting for goodwill under IFRS: A critical analysis. Journal of International Accounting, Auditing and Taxation, 27, pp.13–25. Available at: http://dx.doi.org/10.1016/j.intaccaudtax.2016.07.001.
KPMG, 2016. Cost of Capital Study 2016.
Kuhlewind, A.-M., 2014. Purchase Price Allocation nach IFRS und HGB. In W. Ballwieser, S. Beyer, & H. Zelger, eds. Unternehmenskauf nach IFRS und HGB. Stuttgart: Schäffer-Poeschel, pp. 481–576. Kümpel, T. & Klopper, T., 2014a. Goodwill Impairment-Test nach IFRS - eine Analyse des DAX 30 (Teil
1). KoR, 14(3), pp.125–129.
Kümpel, T. & Klopper, T., 2014b. Goodwill Impairment-Test nach IFRS - eine Analyse des DAX 30 (Teil 2). KoR, 14(4), pp.177–1185.
Kunowski, S., 2015. Bewertung im Rahmen von Unternehmenserwerben für Zwecke der
Rechnungslegung nach IFRS 3 (Purchase Price Allocation). In V. H. Peemöller, ed. Praxishandbuch der Unternehmensbewertung. Herne: NWB-Verlag, pp. 897–910.
Lhaopadchan, S., 2010. Fair value accounting and intangible assets: Goodwill impairment and managerial choice. Journal of Financial Regulation and Compliance, 18(2), pp.120–130.
Li, K.K. & Sloan, R.G., 2012. Has Goodwill Accounting Gone Bad ? CAAA Annual Conference 2011, (December), pp.1–52.
Mohd Ali, S., Mohd Salleh, N. & Hassan, M.S., 2008. Ownership structure and earnings management in Malaysian listed companies: The size effect. Asian Journal of Business and Accounting, 1(2), pp.89– 116.
Moreale, J., 2016. HOW BLOOMBERG CALCULATES THE WEIGHTED-AVERAGE COST OF CAPITAL, Available at: https://data.bloomberglp.com/bat/sites/3/2017/01/WestVirginia-WACC.pdf. Osborne, D., 2012. Operating business value: re-thinking goodwill in the 21st century.
Pellens, B. et al., 2014. Internationale Rechnungslegung 9th ed., Stuttgart: Schäffer-Poeschel. PWC, 2009. Making sense of complex world* - IAS 36 Impairment of Assets, London.
Ramanna, K. & Watts, R.L., 2012. Evidence on the use of unverifiable estimates in required goodwill impairment. Review of Accounting Studies, 17(4), pp.749–780.
Reinke, J., 2010. Impairment Test nach IAS 36, Berlin: Erich Schmidt.
Schatt, A. et al., 2016. Do Goodwill Impairments by European Firms Provide Useful Information to Investors? Accounting in Europe, 13(3), pp.307–327.
Schumann, J., 2008. Unternehmenswertorientierung in Konzernrechnungslegung und Controlling, Wiesbaden: Gabler Verlag.
Shah, S.Z.A., Zafar, N. & Durrani, T.K., 2009. Board composition and earnings management an empirical evidence from Pakistani listed companies. Middle Eastern Finance and Economics, (3), pp.23–38. Watts, R.L., 2003. Conservatism in accounting part I: Explanations and implications. Accounting
Horizons, 17(3), pp.207–221.
Wen, H. & Moehrle, S., 2015. Accounting for Goodwill: A Literature Review and Analysis. , pp.1–27. Yang, C.-Y., Lai, H.-N. & Tan, B.L., 2008. Managerial Ownership Structure and Earnings Management.
Journal of Financial Reporting and Accounting, 6(1), pp.35–53.
Zelger, H., 2014. Purchase Price Allocation nach IFRS und HGB. In W. Ballwieser, S. Beyer, & H. Zelger, eds. Unternehmenskauf nach IFRS und HGB. Stuttgart: Schäffer-Poeschel, pp. 139–186.
Affidavit
I confirm that I wrote this thesis independently and on my own without using any other sources and aids as I stated. Where I used other sources I clearly marked them as not my own. This thesis has not been received by any examination board, neither in this nor in a similar form. Furthermore, I agree to an anonymous test of plagiarism which electronically verifies the validity of my declarations. I am aware that my thesis will not be evaluated in case of not making this statement.