Technology at the table:
An overview of Food Delivery Apps
Catarina Jardim Ribeiro
Dissertation written under the supervision of Miguel Rita
Dissertation submitted in partial fulfilment of requirements for the MSc in
Management with specialization in Strategy and Entrepreneurship, at the
Abstract
Technology at the table: An overview of Food Delivery Apps
Catarina Jardim Ribeiro
The ultimate goal of this study is to provide an overview of food delivery apps. With this service, the chance consumers have to eat a nice restaurant meal at the comfort of their homes is now at a distance of a click. Firstly, this research starts by identifying which attributes of food delivery apps consumers value the most, among online convenience, perceived control, visual design, and order accuracy. Secondly, perceived technology anxiety and need for interaction, lack of customer service and privacy & security concerns were tested as the main barriers preventing people from using the service. And lastly, a model of e-loyalty and repurchase intentions was designed, based on e-loyalty antecedents – e-satisfaction and e-trust. Two methodologies were chosen – in-depth interviews (12 interviewees) and an online survey (202 participants). Results indicated online convenience and order accuracy as the most important attributes for consumers. Further, contrarily to what it would be expected, consumers did not perceive the mentioned barriers as the aspects preventing them from using these apps. Finally, the positive effects of e-trust on e-loyalty and e-satisfaction were verified, as well as the relationship between loyalty and repurchase intentions. Yet, satisfaction effects on e-loyalty were not relevant. A detailed and critical analysis of the results is provided in the last chapter.
Resumo
O grande objetivo deste estudo passa por fornecer uma visão geral das aplicações de telemóvel de entrega de comida ao domicílio. Com este serviço, a possibilidade que os consumidores têm de comer uma boa refeição de um restaurante no conforto das suas casas está agora à distância de um clique. Em primeiro lugar, esta pesquisa começa por identificar os atributos destas aplicações que os consumidores mais valorizam, entre a conveniência online, as perceções de controlo, o design visual e a precisão do pedido. Em segundo lugar, as barreiras tecnológicas, a necessidade de interação pessoal, a falta de apoio ao consumidor e os riscos adjacentes ao serviço foram testados como barreiras que impedem certas pessoas de usar o serviço. Por último, criou-se um modelo de e-loyalty e de intenções de recompra, baseado nos antecedentes de e-loyalty – e-satisfaction e e-trust.
Foram adotadas duas metodologias – entrevistas presenciais (12 entrevistados) e um questionário online (202 participantes). Os resultados revelaram que a conveniência online e a precisão do pedido são os atributos mais importantes para os consumidores. Além disso, ao contrário do que seria esperado, os consumidores não consideraram as barreiras mencionadas como os aspetos que os impedem de usar estas aplicações. Por último, foram verificados os efeitos positivos de e-trust em e-loyalty e em e-satisfaction, bem como a relação entre e-loyalty e a intenção de recompra. Contudo, os efeitos de e-satisfaction em e-loyalty não foram considerados relevantes. No último capítulo, é apresentada uma análise crítica e detalhada dos resultados.
Acknowledgements
First of all, I would like to thank my advisor Miguel Rita for all the unconditional support and quick responses for all my doubts. Specially, I am grateful for all the insights and optimism he passed me through all our meetings.
Secondly, I would like to thank the people I interviewed for their time and valuable insights to this research. Likewise, I am grateful for all the people who answered the online survey. Their contribution was crucial to this study.
Finally, I am thankful for my parent’s effort to enable me to study in the best universities in Portugal and for their support throughout this university process.
Table of Contents
1. Introduction ... 7
2. On-demand food delivery apps – Market Description ... 9
3. Theoretical Framework and Hypothesis Development ... 11
3.1. On-demand Food Delivery Apps ... 11
3.1.1. Attributes – Users ... 11
3.1.2. Barriers & Concerns – Non-users ... 15
3.1.3. Demographics ... 16
3.2. E-loyalty & Repurchase Intentions ... 18
3.2.1. E-satisfaction ... 18 3.2.2. E-trust ... 19 4. Methodology ... 21 4.1. Research Method ... 21 4.1.1. Qualitative Analysis ... 21 4.1.2. Quantitative Analysis ... 21
4.2. Research Design and Instruments ... 22
4.2.1. Qualitative Analysis – In-depth interviews ... 22
4.2.2. Quantitative Analysis – Online survey ... 22
4.3. Data Collection – Research Sample ... 24
4.3.1. Qualitative Analysis – In-depth interviews ... 24
4.3.2. Quantitative Analysis – Online survey ... 25
4.4. Data Analysis ... 25
4.4.1. Qualitative Analysis – In-depth interviews ... 25
4.4.2. Quantitative Analysis – Online survey ... 25
5. Results ... 27
5.1. Qualitative Analysis – In-depth interviews ... 27
5.1.1. Users ... 27
5.1.2. Non-users ... 29
5.1.3. Users vs. Non-users – Demographics ... 30
5.2. Quantitative Analysis – Online survey ... 30
5.2.2. Users ... 31
5.2.3. Non-users ... 36
5.2.4. Users vs. Non-users - Demographics ... 37
6. Discussion of Results ... 39
6.1. Conclusions ... 39
6.2. Limitations and Future Research ... 41
Appendices ... 43
1. Introduction
While living in a dynamic world, sometimes people find it difficult to manage simple tasks like buying food or cooking dinner. Fortunately, consumers can now solve these tasks with a few taps on their mobile phones. Smartphones have become their tool to obtain everything they want at their doorstep because of on-demand services. Indeed, digital technology is reshaping the delivery market (Hirschberg, Rajko, Schumacher, & Wrulich, 2016). The food service industry is no exception. On-demand food delivery apps are disrupting the food delivery concept.
Food delivery apps are giving consumers the chance to order food from a wide array of restaurants, allowing them to compare menus, prices, and reviews from other users in a fast and easy way. Indeed, previous studies have proved that consumers rather use online services because of its speed, precision, and ease of use (Dixon, Kimes, & Verma, 2009; Kimes, 2011b). Besides, consumers keep on asking for more convenient orders and delivery. Convenience is certainly one of the strongest motives for consumers to intensify their relationships with any service platform (Goebel, Moeller, & Pibernik, 2012; Seiders, Voss, Godfrey, & Grewal, 2007). Unsurprisingly, these food delivery services are most popular among millennials, the consumer segment who uses the most online services (“Online On-demand Food Delivery Services Market - Growth Analysis and Forecast| Technavio | Business Wire,” 2017).
Over the years, several researchers studied consumer behavior and preferences in an online context, however, there is a lack of research when it comes to food delivery apps. Therefore, it is essential to understand the underlying motivations that make consumers use them, as well as the features of these apps that they consider to be most important. These attributes can be tangible, like the design of the app, or intangible, such as the service’s convenience and quality. Further, there are several reasons that prevent people from adopting online purchase behavior. When it comes to this service, there is any research to date analyzing those reasons, which is why throughout this research there will be evaluated the main barriers & concerns of the people who do not order food through mobile applications.
Additionally, another crucial element to study in an online context is loyalty (J. Kim, Jin, & Swinney, 2009; C. Park & Kim, 2003; Yang & Peterson, 2004). Hence, the second part of this study will focus on studying e-loyalty in the food delivery apps’ service. In detail, the antecedents of loyalty will be examined, as well as the relationship between loyalty and repurchase intentions.
Overall, this research aims to identify which attributes of these platforms’ consumers value the most, to analyze the critical barriers & concerns of the non-users of food delivery apps and to
study the concept of loyalty in this service. Specifically, the following research questions ought to be answered:
§ What is the most important attribute of food delivery apps?
§ What are the main barriers & concerns that prevent people from using food delivery apps?
§ Which factors are responsible for consumer’s loyalty in the food delivery app’s market?
This dissertation consists of 6 chapters. The next chapter presents a market description of the service of food delivery apps. Chapter 3 will consist of a review of all the academic literature regarding food delivery, online services, and online transactions, as well as loyalty and repurchase intentions. Afterward, Chapter 4 and 5 will describe the chosen methodologies and its further results. Finally, the last chapter presents the final conclusions and limitations of the current study.
2. On-demand food delivery apps – Market Description
Nowadays, consumers have 2 major types of online platforms (excluding the restaurant’s individual websites) available when they choose to order food online. Hence, one must understand the differences between the “aggregators” and the more recent food delivery players – food delivery apps. The aggregators have a more traditional approach, taking solely orders from consumers, while the restaurant takes care of the delivery. This traditional approach has no additional costs to consumers. Contrarily, the new food delivery apps, that will be the focus of this research, take care of the delivery themselves, charging fees for both restaurants and consumers.
Food delivery apps serve as the middleman - connecting people to food (Bakker, 2016) – and allowing consumers to order different meals from their partner restaurants, that previously did not offer delivery themselves. As a consequence, restaurants that now want to start offering delivery can choose to partner with third-party delivery services, expanding the number of restaurants available for customers to choose from.
In 2018, the global Platform-to-Consumer Food Delivery market already amounts for US $ 17.413 million (Online Food Delivery - Platform-to-Consumer Delivery - worldwide | Statista Market Forecast, 2018). Moreover, the user penetration rate reached 6% worldwide and it is expected to reach 10.3% in 5 years. China has been the leading country in this industry, reaching a market volume of US $ 12.078 million, followed by the US, UK, and India. Nonetheless, when it comes to user penetration, Hong Kong is leading the race, followed by China, The Netherlands, and Canada.
The major players around the world in the food delivery apps’ market are GrubHub, Delivery Hero, Deliveroo, Just Eat, DoorDash and Uber Eats. The competition in this industry was intensified when big names started taking their first moves into the delivery market: Amazon launched Prime Now, a restaurant delivery service, and Macdonald’s partnered with Uber Eats. Further, these platforms have different sources of revenue. For instance, DoorDash does not have a fixed fee, depending on the restaurant, the company charges them a revenue-share that varies from 10% to 25%. While Uber Eats charges its restaurant’s partners in two different ways: one is a fixed revenue-share of 30% over each order, the second is a marketing fee (non-fixed), which is optional, giving restaurants the opportunity to be placed at the top of their app search results. Overall, not all food delivery apps offer the chance for marketing to their restaurant partners, but most do. Moreover, these apps differ on how they charge consumers for the delivery. Once more, some charge a fixed fee and others a variable fee, dependent on the location of the consumer when compared to the one from the restaurant.
In Portugal, the revenue of the Platform-to-Consumer Food Delivery market reached US $ 3 million in 2018 and the user penetration rate is 0.8%, a value that is expected to more than double until 2022 (Online Food Delivery - Platform-to-Consumer Delivery - Portugal | Statista Market Forecast, 2018). From the most well-known food delivery apps, only Uber Eats operates in Portugal. Apart from this one, Portugal already counts with 5 more food delivery apps - Glovo, NoMENU, SendEAT, Takeaway.com, and Comer Em Casa.
Uber Eats, NoMENU, Comer Em Casa, and Takeaway.com only focus on food delivery from their partner restaurants, while Glovo goes beyond food, by additionally offering consumers the chance to order from pharmacy to fashion products, as well as anything that can fit the box carried on the driver’s motorbike. Likewise, SendEAT also offers consumers the chance of delivery from a Portuguese supermarket (Continente).
Regarding fees to consumers, Uber Eats, SendEAT, and Comer Em Casa charge, respectively, a fixed fee of 2.9€, of 2.95€ and of 3.60€. Contrarily, Glovo, NoMENU, and Takeaway.com charge a variable fee starting on 1.90€, 2.90€, and 2€, respectively. Finally, some apps allow consumers to follow the route the delivery person is taking, providing them with constant updates.
3. Theoretical Framework and Hypothesis Development
This chapter is divided into two groups: on-demand food delivery apps and e-loyalty & repurchase intentions. Firstly, there will be analyzed the major attributes that consumers value the most. Also, the main barriers & concerns the non-users have regarding the service will be studied. Besides, demographic factors will be explored in an online context.
Secondly, this study will evaluate consumer’s loyalty and repurchase intentions while looking for loyalty’s antecedents. Lastly, hypotheses are developed for each critical variable.
3.1. On-demand Food Delivery Apps 3.1.1. Attributes – Users
When it comes to food delivery app’s attributes there are many aspects to consider, given a large number of mobile app attributes which might influence consumer’s intention to purchase (Kapoor & Vij, 2018). This research particularly focuses on the visual design of the app, as the only tangible attribute to be studied, and on online convenience, perceived control and order accuracy, as its intangible attributes. While analyzing these four attributes one might conclude which one consumer’s value the most and consider most important.
a) Online Convenience
The term convenience has been described as the amount of time and effort consumers recognize saving while performing activities related to shopping (Seiders, Berry, Gresham, Leonard, & Larry, 2000; Berry, Seiders, & Grewal, 2002; Goebel et al., 2012; Seiders et al., 2007). Indeed, convenience is considered one of the major incentives for consumers to embrace online shopping (Beauchamp & Ponder, 2010; Jiang, Yang, & Jun, 2013). Moreover, researchers proved that convenience influences customer satisfaction and behavioral intentions (Colwell, Aung, Kanetkar, & Holden, 2008; Seiders et al., 2007).
“Service convenience” can be described as the consumers’ perceptions of time and effort when buying or using a service (Berry et al., 2002; Seiders et al., 2007). Berry et al. (2002) proved that when the time costs related to a specific service increases, consumers’ perceptions of service convenience decrease. Those researchers acknowledged 5 dimensions for service convenience that reflect different stages of the activities related to buy or use a service: access, decision, transaction, benefit, and post-benefit convenience. One must realize that the general convenience evaluations consumers make are influenced by their time and effort perceived costs related to each convenience dimension. Decision convenience is related with whether to buy the service or to self-perform, thus, involves consumer’s perceived effort and time costs
implied when making that decision. Definitely, the decision to “make-or-buy” is more common for services when compared with products. Access Convenience is associated with consumer’s perceived effort and time costs upon service delivery (includes the actions to ask for the service and to receive it). Transaction convenience has its main focus on all the actions one must take in order to secure his/her right to use that specific service. Usually, the transaction includes an exchange of money. Benefit convenience is linked with consumer’s perceived time and effort costs when experiencing the service’s fundamental benefits. Lastly, Post-benefit convenience is related to further contact with the service provider after the benefit stage, thus, it can be associated with product reparations, exchange or maintenance.
Regarding retail convenience, Seiders et al (2000) suggested 4 dimensions: access (how easy it is to reach a retailer), search (how easy it is for consumers to recognize and select what they want to buy), possession (how easy it is to obtain the desired product) and transaction (how easy it is for consumers to effect transactions). Later, Beauchamp & Ponder (2010) compared retail convenience for both in-store and online shopping and concluded that online shoppers have better perceptions of all the dimensions of convenience.
When it comes to online service convenience, there are some exclusive features related with the quality of the online service, like interactivities, ease of use, information search and security (Jiang et al., 2013; Jun, Yang, & Kim, 2004; Parasuraman, Zeithaml, & Malhotra, 2005; Wolfinbarger & Gilly, 2003; Yang, Cai, Zhou, & Zhou, 2005; Yang & Peterson, 2004). In an attempt to further understand the dimensions of convenience only related to the online world, Jiang et al. (2013) defined 5 different factors: access (the availability and ease of access to the online platform), search (whether the platform is user-friendly and related to the variety of the search options), evaluation (related with how detailed and organized is product information),
transaction (how easy and flexible are the payment methods) and possession/post-purchase
(how fast is the delivery). Indeed, they acknowledged that online convenience is a major factor for the success of online businesses. Therefore, the importance to study this concept in the food delivery app’s market.
Nevertheless, Beauchamp & Ponder (2010) concluded on their study that while the dimensions of convenience exist in theory, consumers tend to see convenience as a general concept. Hence, in this study, convenience will be treated as a general construct, considered to be an app attribute of food delivery apps.
Taking into consideration the previous literature, the following hypothesis will be tested:
H1: Online Convenience is the attribute that consumers value the most regarding food delivery apps.
b) Visual Design
One of the most important attributes of a mobile app is visual design (Kapoor & Vij, 2018; Nah, Eschenbrenner, & DeWester, 2011). Consumers use mobile apps through their smartphones which have small screens, thus, they must provide only the necessary data with a simple presentation. The aesthetic, consistency and attractive looks of the mobile app are the main aspects related with visual design, which include its colors, images, fonts, animations, layouts and shapes (Cyr, Head, & Ivanov, 2006; Kapoor & Vij, 2018). While using the platform, visual design affects the consumer experience as well (Wells, Valacich, & Hess, 2011).
In fact, for mobile apps, visual design is even more important when compared to other platforms because consumers, with just a few taps on their smartphones, expect to search, order and pay for their products or services (Cho, Bonn, & Li, 2018; D. J. Kim & Hwang, 2012).
Essentially, Wells et al. (2011) concluded that when the visual design of a platform is attractive, it influences positively the consumer quality perceptions of both product and company. Subsequently, studies proved that when a mobile application appears to have a better design, there is an increase in the level of users’ engagement (Cheung, Shen, Lee, & Chan, 2015; Kapoor & Vij, 2018). On the other hand, as expected, consumers are doubtful in using a mobile application that appears to have a worse visual design (El Said, 2015; Kapoor & Vij, 2018). Finally, Kapoor & Vij (2018) concluded that visual design has a strong influence on consumers’ loyalty and purchase decisions relative to a specific brand.
Based on the prior literature review, the following hypothesis will be tested:
H2: Visual design is the attribute that consumers value the most regarding food delivery apps.
c) Perceived Control
Human beings have the necessity to control their own environment, i.e., people have the need to show others their mastery and superiority over the environment (White, 1959). The concept of control can be broken down in 3 different perspectives: behavioral control (related with direct responses to the environment), cognitive control (related with uncertainty reductions) and
decisional control (related with having a choice between different outcomes or goals) (Averill,
1973).
When it comes to service encounters, Lovelock & Wirtz (2010) suggested that production and consumption happen at the same time. Hence, one can recognize 3 different parties: first, the consumer who aims to feel satisfied and to attain value for money; second, the employee who wishes to gain remuneration and job fulfilment; and third, the company who desires to satisfy
both consumers and employees while focusing on the company’s profits (Bateson, 2000). Either way, Bateson (2000) concludes by stating that the three forces pursue control over the service encounter.
Moreover, perceived control, in general, influences consumers’ satisfaction with service experiences (Hui & Bateson, 1991; Hui & Tse, 1996; Noone, Wirtz, & Kimes, 2012). Likewise, in many cases, higher levels of control tend to increase both consumer satisfaction and their intention to either use or recommend a service (Hui & Bateson, 1991; Kimes, 2011b). Nevertheless, one must acknowledge that these higher levels of control might not attract all consumers, especially the ones who seek personal contact (Kimes, 2011b).
In fact, in order to create a successful self-service system, companies should emphasize consumer’s perceived control, because consumers will likely use the system without being next to an employee (Kimes, 2011b).
Regarding online food ordering, Kimes (2011) concluded in her study that control is one of the strongest reasons for consumers to embrace online ordering. Besides, Noone et al. (2012) explained that by providing consumers real-time information regarding their meals, that is a way to enhance their perceptions of control. Similarly, when using mobile apps for food ordering and delivery, consumers are able to choose what they want, as well as the time and location to order their meal, experiencing higher levels of perceived control (Noone et al., 2012). Finally, another way to enhance consumers’ perceived control is to allow them to choose the payment method (Kimes, 2011b).
Hence, the following hypothesis was derived:
H3: Perceived control is the attribute that consumers value the most regarding food delivery apps.
d) Order accuracy
When it comes to services, delivering quality is a fundamental strategy for companies that aim to differentiate their services from their competitors’ offerings while satisfying their customer needs and creating value (Collier & Bienstock, 2006; Ozment & Morash, 1994). In order to deliver service quality and create good relationships with consumers, companies must be aware of their preferences, needs, and wants (Howard & Worboys, 2003).
In an online context, consumers worry about both service delivery and the outcome of the specific service (Katz, 2001). Indeed, consumers want the guarantee that their order will be accurate and that it will be delivered in the stipulated time (Kimes, 2011b).
Moreover, to better understand e-service quality, Wolfinbarger & Gilly (2003) developed a scale known as eTailQ that includes 4 different dimensions: fulfillment/reliability, website design, customer service, and security/privacy. Fulfillment/reliability is related with the accuracy of the product information and description on the online platform, to make sure consumers receive exactly what they ordered, and further is also related with whether that product was delivered in the promised schedule. Website design concerns all the features that affect consumer’s experience with an online platform (navigation, search for information, order processing, and product selection). Customer Service is related with the quick response from the company to every customer need, from platform problems that may arise to inquiries. Lastly, security/privacy concerns the privacy of the information consumers share with the company and the security of payments by credit card. Moreover, fulfillment/reliability is one of the best predictors of quality (Wolfinbarger & Gilly, 2003) and customer satisfaction (Ding, Hu, & Sheng, 2011).
From the 4 factors mentioned above, fulfillment/reliability is the one that will be analyzed more deeply in the context of food delivery apps, since it concerns the attribute order accuracy. In fact, previous studies have proved that order accuracy is the most important attribute of online ordering (Kimes, 2011b). Therefore, there are several strategies companies can take to emphasize order accuracy, such as: showing the order on the side of the screen to allow the consumer to check what he/she has in the basket, giving consumers the chance to review, modify and approve their order, sending a confirmation email with the list of items ordered and giving delivery time estimates (Kimes, 2011a).
Accordingly, the following hypothesis was derived:
H4: Order accuracy is the attribute that consumers value the most regarding food delivery apps.
3.1.2. Barriers & Concerns – Non-users
When studying consumer behavior and preferences towards a technological platform, one must also look for the main barriers and concerns that make some consumers not to use them. Therefore, this research attempts to understand the perspective of the non-users of food delivery apps – what are the main barriers that prevent them to start using these platforms, as well as, some concerns they might have related to the service.
The major reasons that prevent consumers from ordering food online are related to the perceived need for interaction and perceived technology anxiety (Kimes, 2011a), as well as, to privacy & security concerns and lack of customer service (Ahuja, Gupta, & Raman, 2003).
The perceived need for interaction can be translated as someone’s necessity to maintain personal contact with other people upon a service encounter (Curran & Meuter, 2005; Dabholkar, 1992). Indeed, retaining personal contact between consumers and service providers makes it possible for the establishment of interpersonal relationships between the two parties (Curran & Meuter, 2005). However, Curran & Meuter (2005) explained that self-service technologies (like food delivery apps) exclude those interpersonal relationships that many consumers value and who tend to evaluate the quality of services based on those interactions. Thus, it is clear that, for some people, the inexistence of personal contact consists of a barrier to the use of food delivery apps.
Moreover, Parasuraman (2000) concluded that consumers who do not feel comfortable with new technologies might be hesitant to use an online self-service platform because they might be afraid of not being able to deal with the technology correctly. Certainly, Kimes (2011a) completed by affirming that some people are reluctant towards online food ordering because they are afraid of making a mistake without knowing how to correct it or simply because the technology is unfamiliar to them. Therefore, it is possible to conclude that perceived customer technology anxiety is a barrier to the use of food delivery apps.
Privacy & security is known to be the biggest concern consumers have upon online transactions (Ahuja et al., 2003). Wolfinbarger & Gilly (2003) defended that the security of payments by credit card and the privacy of an individual’s shared personal details are both characteristics related to privacy & security. Indeed, the fact that most online transactions imply possible losses of one’s security and privacy of personal information, is a major barrier for consumer’s online purchase adoption (Hui, Teo, & Lee, 2007).
Lastly, Ahuja et al. (2003) enhanced that the lack of customer service also appears to be a concern. In detail, the lack of customer service englobes not only the inability to find help from the company whenever consumers have a problem while ordering or doing a purchase but also problems that might arise after the purchase of the service.
3.1.3. Demographics
Over the years, researchers have been studying demographic variables to better distinguish consumers’ adoption of online purchases vs offline purchases, and most of the times they proved that demographics have a substantial impact on the consumer online shopping behavior (Brown, Pope, & Voges, 2003; Donthu & Garcia, 1999; Korgaonkar & Wolin, 1999; Koyuncu & Lien, 2003; Naseri & Elliott, 2011).
Regarding the role of demographics in the adoption of online shopping, Naseri & Elliott (2011) found out that age, gender, education, and income are the demographic factors that are more significant when studying consumer’s behavior.
Age is one of the most studied demographic factors when it comes to former literature about consumer behavior in an online context (Chang, Cheung, & Lai, 2005). Several pieces of research proved that, in general, older people are less likely to embrace online shopping. Hence, age tends to have a negative impact on the adoption of online behavior (Donthu & Garcia, 1999; Joines, Scherer, & Scheufele, 2003; Naseri & Elliott, 2011). Roy Dholakia & Uusitalo (2002) concluded by arguing that usually older people are less familiar with technology, as a consequence, older consumers are more anxious about online purchases.
When it comes to gender, several studies proved that, in general, men tend to make more online transactions than women (Brown et al., 2003; Donthu & Garcia, 1999; Koyuncu & Lien, 2003; Naseri & Elliott, 2011). However, it appears that there are quite a few exceptions to this pattern, depending on the product/service category in question. Indeed, it was found that women tend to shop online groceries, clothing and entertainment services more often than men (Naseri & Elliott, 2011). Nevertheless, men are less concerned with the risks associated with the purchase of online goods and services (Bartel Sheehan, 1999; Kolsaker & Payne, 2002).
Moreover, better-educated consumers tend to embrace more online shopping (Koyuncu & Lien, 2003), have a greater frequency of online purchases and spend higher amounts of money online (Burroughs & Sabherwal, 2002). Further, higher education levels can be related to increased skills to manage uncertainty and enhanced self-efficacy, characteristics that improve one’s ability to deal with online purchases (Burroughs & Sabherwal, 2002).
Lastly, income is also positively related to online shopping adoption (Donthu & Garcia, 1999; Koyuncu & Lien, 2003). Taking advantage of the New Theory of Consumer Behavior (Michael & Becker, 1973; Pollak & Wachter, 1975), Kinsey (2011) noticed that when the value of time increases, people prefer to choose the transaction option (credit card) that will make them lose the minimum time. Further, Naseri & Elliott (2011) suggested that people who have higher salaries tend to work longer hours, thus, also their lack of time contributes to a higher interest in online shopping. Finally, consumers with higher incomes can choose to “buy” when facing the service decision “make vs buy”, ending up having more experience within a larger set of services (Keaveney & Parthasarathy, 2001).
Overall, it is expected during this research that the previous demographic variables behave in the same way in regard to food delivery apps.
3.2. E-loyalty & Repurchase Intentions
In an attempt to define loyalty, Keller (1993) concluded that consumers are considered loyal when they have positive attitudes toward a specific subject, which results in repeated purchase behavior over a specific period of time. Nevertheless, other researchers defend that repeated purchase does not include the emotional side of loyalty, ending up reflecting solely the outcome of the decision process (Berkowitz, 1978). For Shankar, Smith, & Rangaswamy (2003) a consumer is considered to be loyal when he/she shows commitment and a strong connection towards a given company, and also when that same person does not get easily interested by other attractive alternatives.
The need to study loyalty in the online context has been an important factor to measure the success of online businesses. Therefore, Srinivasan, Anderson, & Ponnavolu (2002) defined e-loyalty as consumer’s commitment and positive attitudes towards the online platform that fallouts in the repeated purchase. Consequently, due to strong consumer commitment and decreased costs of acquiring new consumers, e-loyalty results in higher profitability to the online platform (Reichheld, Markey, & Hopton, 2000). Indeed, e-loyal customers benefit from lower operating costs when compared to recently acquired consumers (Van Riel, Liljander, & Jurriëns, 2001).
Most importantly, one must understand how e-loyalty is established. E-satisfaction (R. E. Anderson & Srinivasan, 2003) and e-trust (Reichheld & Schefter, 2000) are the two attributes considered to be crucial in the development of e-loyalty, thus, responsible for the consumer’s repurchase intentions.
Given the popularity of food delivery apps, and the lack of research regarding loyalty for this service, the last part of this research will focus on the effects of satisfaction and trust on e-loyalty for those services, and the subsequent effects of e-e-loyalty on repurchase intentions. Hence, according to the previous literature, the following hypothesis was created:
H5: E-loyalty has a positive effect on repurchase intentions.
3.2.1. E-satisfaction
Oliver (1997) defined satisfaction as the pleasing perceptions of fulfillment consumers experience in each transaction. Likewise, e-satisfaction can be described as a cumulative concept since it consists on the sum of satisfaction on each purchase of goods or services over time (E. W. Anderson, Fornell, & Lehmann, 1994). In an online context, customer satisfaction is highly important for the firm’s relationship with its customers (Winer, 2001). Furthermore, Ram & Jung (1991) proved that satisfied consumers are related to increased levels of service
usage. Besides, satisfied consumers tend to have more repurchase intentions as well as recommend the product or service to others (J. Kim et al., 2009; Zeithaml, Berry, & Parasuraman, 1996). As expected, dissatisfied consumers have higher incentives to search for substitute information and tend to switch to other online platforms (J. Kim et al., 2009). However, one should acknowledge that there are external factors that might influence consumer’s e-satisfaction, such as the quality of his/her equipment and of the internet.
Lastly, although there are several studies proving the influence of e-satisfaction on e-loyalty, no one has yet studied this relationship for food delivery apps, thus, the following hypothesis was derived:
H6: E-satisfaction has a positive effect on e-loyalty.
3.2.2. E-trust
Trust can be expressed as the consumer’s confidence in the reliability and quality of a specific service (Garbarino & Johnson, 1999). E-trust is thereby defined as the level of confidence consumers have in an online platform, and in its transactions (Ribbink, Streukens, Van Riel, & Liljander, 2004).
Moreover, Reichheld et al. (2000) suggested that when consumers choose to establish a closer connection with one online platform, trust is the utmost important attribute, not price as some would expect. Additionally, Reichheld & Schefter (2000) defend that when online platforms want to gain their consumer’s loyalty, they need to assure they gain their trust first. Indeed, several researchers have proved the positive influence that e-trust has on e-loyalty (C. H. Park & Kim, 2003; Pitta, Franzak, & Fowler, 2006; Reichheld et al., 2000).
Additionally, other studies discovered that e-trust has not only a direct effect on e-loyalty but also an indirect effect through e-satisfaction (Gummerus, Liljander, Pura, & Van Riel, 2004). When purchasing a product or service, the trust evaluations consumers have over a particular transaction have a direct effect on their post-purchase satisfaction (Singh & Sirdeshmukh, 2000). When it comes to online services, consumers acknowledge they face higher risks when compared to offline services, in regard to payments, delivery and their personal information disclosure (J. Kim et al., 2009; Singh & Sirdeshmukh, 2000). Thus, they have a stronger need to opt for the online platforms they trust the most. Hence, one can argue that to have satisfied consumers, trust must be established first.
Accordingly, the following hypotheses are proposed in regard to food delivery apps:
H8: E-trust has a positive effect on e-satisfaction.
4. Methodology
In this chapter, the research methods and the strategies behind them are presented, as well as details of how they were designed and analyzed.
4.1. Research Method
Researchers can follow two distinct analysis to test their hypothesis: a qualitative and a quantitative analysis. Due to the novelty of the food ordering service through apps, both a qualitative and a quantitative analysis were conducted.
Additionally, to better understand consumer’s perspectives in regard to food delivery apps, it is crucial to analyze what are the characteristics of this service consumers dislike or would like to see improvements. Due to the lack of literature regarding the consumers’ degree of dissatisfaction with the referred service, a thorough analysis on the market players’ consumer comments helped in pointing low variety, quality of the food, packaging, time of delivery, and the way companies handle problems as the characteristics they would appreciate seeing improvements. Hence, the previous aspects will be tested and validated during this research.
4.1.1. Qualitative Analysis
In-depth interviews were the qualitative method chosen. This research technique encompasses conducting one-on-one interviews in order to investigate the respondents’ perspectives upon a specific product, service, or simply an idea (Boyce & Neale, 2006). In-depth interviews allow the researcher to obtain very detailed insights into the consumer’s behaviors and thoughts, allowing the generation of new ideas and helping in better design the questions for the quantitative analysis (Boyce & Neale, 2006).
Additionally, this analysis allows the interviewees to feel more comfortable, being able to give more personal insights even upon more sensitive subjects (Steber, 2017). Yet, there are some disadvantages: interviews can be time-consuming, which can lead to exhaustive analysis due to big amounts of information and, also, to smaller samples that might not be enough to reach valid conclusions (Boyce & Neale, 2006).
For this study, 12 in-depth interviews were conducted – 6 to users and 6 to non-users of food delivery apps. The research proceeded with the conduction of an online survey.
4.1.2. Quantitative Analysis
The second analysis of this study involved an online survey. In detail, online surveys are able to reach a much wider audience, with extremely low costs in a short period of time, when
compared to a qualitative analysis. Indeed, online surveys have many strengths, such as flexibility, speed, convenience, low administration cost, question diversity, large sample easy to obtain, ease of data entry and analysis, and control of answer order (Evans & Mathur, 2005). Nevertheless, Evans & Mathur (2005) concluded that privacy issues, the fact that online surveys are impersonal, and the possible lack of online experience/expertise from the respondent constitute the main weaknesses of online surveys.
Lastly, in the same way it was defined for the qualitative analysis, the survey was divided into 2 different parts according to the respondent’s previous experience with food delivery apps.
4.2. Research Design and Instruments
4.2.1. Qualitative Analysis – In-depth interviews
The 12 interviews were carried out face-to-face and lasted between 15 to 30 minutes. Two distinct scripts were designed – one for users and another for non-users.
On one hand, the script (Appendix 1) for users was divided into 6 distinct parts: demographic data (gender, age, education level, and monthly income), simple questions about the general concept of food delivery apps, monthly usage frequency, attributes (to discover which one consumers value the most), loyalty (including questions about their level of trust and satisfaction) and, finally, points to improve.
On the other hand, the script (Appendix 2) for the non-user’s was divided into 5 parts: demographic data (same as the user’s script), then the general concept of food delivery apps was introduced and explained, later the interviewees were asked about their main barriers & concerns towards the service, as well as about the aspects they like about the service, and lastly, recommendations were requested.
4.2.2. Quantitative Analysis – Online survey
First of all, the online survey was prepared using the online Qualtrics software and it was accessible for one week. The survey was revised by asking 6 people to read it, to make sure the survey was clear and easy to understand. Consequently, it was later modified in terms of layout and wording according to the suggestions.
Secondly, the survey (Appendix 3) followed different routes depending on the respondent’s use of food delivery apps. The first part of the survey explained the participants the purpose of this study and informed them about the chance they had to participate in a draw of a card from FNAC of 30€ at the end of the survey. In the second part, yes or no questions were asked to identify the participant’s previous experience with food delivery in general. Afterward, an explanation of the service of ordering food through apps was provided, to ensure all participants
understand the referred service. Then, the participants were asked if they had ever used the service. This separated the survey into different parts: one for the respondents who had used and another for the ones who did not.
On one hand, the third part for users involved, firstly, questions about their food order frequency and, secondly, the participants were asked to state their level of agreement with several characteristics related with the food delivery app’s attributes: online convenience, visual design, perceived control and order accuracy. This part was finalized by asking them to rank the four attributes in relation to each other, according to their level of importance. Moreover, the fourth part included questions about consumers satisfaction, trust, loyalty, and repurchase intentions. This part was finalized by asking the consumers to attribute 100 points, according to their level of dissatisfaction, upon the quality of the food, the packaging, the way the app handles problems, variety, and time of delivery.
On the other hand, for the non-users, the third part consisted mainly of questions about the barriers & concerns (perceived technology anxiety, perceived need for interaction, privacy & security and lack of customer service) they might have towards the referred service. The last question on this section aimed to test the intention the non-users have to start using this service. The final part of the online survey was the same for both users and non-users and included questions related to demographic factors and the participants’ emails were requested to allow them to participate in the draw.
4.2.2.1. Measurement of Variables – Online survey a) Food delivery app’s attributes - Users
For each food delivery app attribute multi-items scales were developed. The Likert scales are widely used when analyzing attitudinal and behavioral elements (Boone & Boone, 2012). Therefore, the five-point Likert scale was chosen to measure those items. In this scale, 1 corresponded to “Strongly disagree” and 5 to “Strongly agree”.
In general, the item-scales were based on previous literature related to online food ordering and online transactions and were later adapted for the food delivery service through apps. Firstly, the item-scales for online convenience were based on the presented theoretical framework and on Yeo, Goh, & Rezaei (2017) and Kimes (2011a) studies. Secondly, the constructs for the visual design were created accordingly to Kapoor & Vij (2018) measurement of items. Thirdly, perceived control measurement of items was also based on insights from the Kimes (2011a) study of electronic food ordering along with the other previous literature. Lastly, order accuracy measurements were based on the Wolfinbarger & Gilly (2003) study of service quality in an online context.
b) E-Loyalty and Repurchase Intentions - Users
For this part, the fivpoint Likert scale was once more chosen. The items to measure e-satisfaction were established based on J. Kim et al. (2009) and on Fornell, Johnson, Anderson, Cha, & Bryant (1996) and were adapted to the service of food delivery. Moreover, for e-satisfaction the scale ranged from 1 to 5, where 1 corresponded to “Not satisfied at all” and 5 to “Completely satisfied”. For e-trust, the constructs were taken and adapted from the research of Garbarino & Johnson (1999).
To measure e-loyalty, the study of Srinivasan et al. (2002) about e-loyalty in an online context was chosen. Finally, repurchase intentions were measured by a single item based on both studies of Cho et al. (2018) and Yeo et al. (2017), aiming to find out if consumers intend to use food delivery apps in the short run. It was used a five-point scale, where 1 was “Would definitely not order” and 5 was “Would definitely order”.
c) Barriers & Concerns – Non-users
For the main barriers & concerns, the five-point Likert scale was preferred once again. The items for perceived technology anxiety and perceived need for interaction were both based and adapted from the study of Kimes (2011a) regarding electronic food ordering. The items for privacy & security were based on the previous theoretical framework along with the study of Wolfinbarger & Gilly (2003). Lastly, the lack of social interaction was adapted from the research of Ahuja et al. (2003) about consumer purchasing behavior in an online context.
4.3. Data Collection – Research Sample
4.3.1. Qualitative Analysis – In-depth interviews
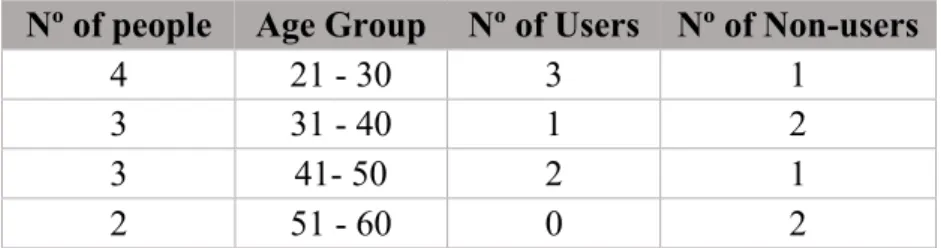
For the in-depth interviews, 12 Portuguese people were selected according to purposive sampling, i.e., a non-probability sampling method which implies that researchers choose their samples according to their judgments and it is often used when dealing with very small samples (Saunders, Lewis, & Thornhill, 2009). Further, as it was previously mentioned, there were chosen 6 users and 6 non-users of food delivery apps. Additionally, according to Kolsaker & Payne (2002) division of age range (21-30; 31 – 40; 41 – 50; 51 - 60), the interviewees were also chosen according to their age (to make sure the sample included at least 2 people of each age group – Table 1). Lastly, from the 12 interviewees, 7 were female and 5 were male.
Table 1 - Age group of the interviewees
Nº of people Age Group Nº of Users Nº of Non-users
4 21 - 30 3 1
3 31 - 40 1 2
3 41- 50 2 1
2 51 - 60 0 2
4.3.2. Quantitative Analysis – Online survey
The survey was written in Portuguese and it was designed to target only Portuguese individuals, both users, and non-users of food delivery apps. Most participants were recruited on social media, through Facebook posts and private messages on WhatsApp. And a few respondents were recruited through private emails. Further, the hypotheses derived from the previous theoretical framework were tested on a sample of 202 people, where 127 were users and 75 were non-users.
4.4. Data Analysis
4.4.1. Qualitative Analysis – In-depth interviews
All 12 in-depth interviews were audio-recorded and later transcribed, i.e., replicated in a written file (Saunders et al., 2009). Moreover, the interviews were held in Portuguese, meaning that after they were transcribed, they were carefully translated into English.
4.4.2. Quantitative Analysis – Online survey
The collected data was analyzed through the statistical software – IBM SPSS (Statistical Package for the Social Sciences) 24.
Initially, the sample was divided between users and non-users of food delivery apps, in the same way it was done for the in-depth interviews.
Later, the statistical analysis involved using descriptive and inferential statistics. The level of significance to reject the null hypothesis was set at (α) ≤ .05. Moreover, the Cronbach’s alpha method was applied to prove internal consistency (J. Kim et al., 2009) of the measurement items used for the attributes, for the e-loyalty factors, and for the barriers & concerns. In detail, its values were evaluated based on George & Mallery (2003) rules of thumb: values lower than 5 are considered unacceptable, higher than 5 are poor, higher than 6 are questionable, higher than 7 are acceptable, higher than 8 are good, and finally higher than 9 are excellent.
Moreover, the Chi-square test of independence, the Anova Repeated Measures, and the Student t-test for independent samples were used. The homogeneity of variances was analyzed with the
Levene test. Additionally, when the normality assumption of the Student T-test for independent samples was not satisfied, it was alternatively used the Mann-Whitney test. When the Chi-square assumption that there should be no more than 20% of the cells with expected frequencies less than 5 was not satisfied, the Chi-square test was used by Monte Carlo simulation.
A Confirmatory Factor analysis (CFA) was conducted with the IBM SPSS Software AMOS 24 for the attributes and e-loyalty to verify if there is both internal and external consistency of the measurement items of those variables (Cho et al., 2018). Likewise, the previous software was used for the structural equation model (SEM) for repurchase intentions. The scales to measure the fit indexes of the results from the CFA were based on the study of Hu & Bentler (1999). These researchers defend that the values for the c2/df (Chi-square/degrees of freedom) below 2
are considered very good and lower than 5 are acceptable. The CFI (Comparative fit index) and GFI (Goodness fit index) should be higher than 9. Finally, for the RMSEA (Root mean square error of approximation) the fit is considered good for values lower than 0.05, moderate for lower than 0.1 and poor for values higher than 0.1.
5. Results 5.1. Qualitative Analysis – In-depth interviews
The results of the in-depth interviews are presented in two distinct parts: one for users and another for non-users. In the end, it is presented a comparative analysis between both groups.
5.1.1. Users
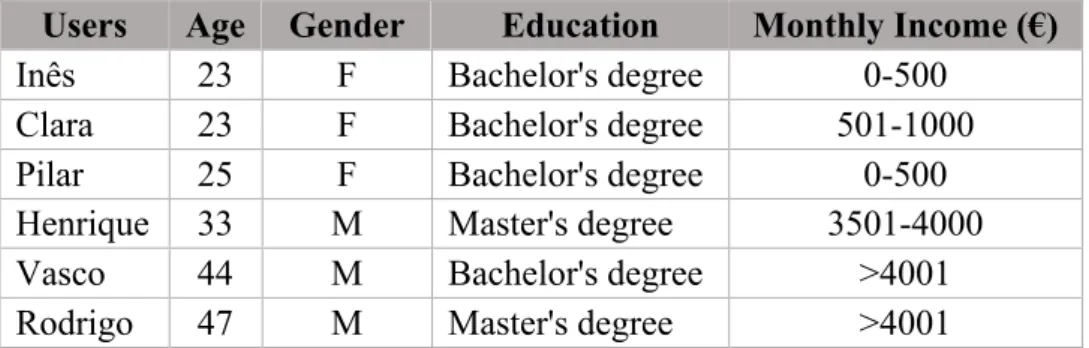
Table 2 presents the results of the users’ demographic variables.
Table 2 - Users’ Demographic Variables
Users Age Gender Education Monthly Income (€)
Inês 23 F Bachelor's degree 0-500 Clara 23 F Bachelor's degree 501-1000 Pilar 25 F Bachelor's degree 0-500 Henrique 33 M Master's degree 3501-4000 Vasco 44 M Bachelor's degree >4001 Rodrigo 47 M Master's degree >4001
All 6 interviewees stated that before having the ability to order food through apps, they used to call directly the restaurants or order food from their website. Yet, when it became possible to order their meals through apps, all of them prefer to use this service.
The monthly usage frequency of food delivery apps varied among the 6 participants (Table 3). On average, the interviewees order food 5.5 times a month.
Table 3 – Monthly Usage Frequency
Users Monthly Usage Frequency
Inês 3 Clara 2 Pilar 1 Henrique 6 Vasco 15 Rodrigo 6 Mean 5.5
Further, the most mentioned reasons of why the interviewees use the referred service were the ability to stay at home and to save time, while being able to order food from a very diverse set
of options. Indeed, consumers value the fact that using these apps is practical, easy and fast, being perfect for time-constraint circumstances.
Upon the major attributes that are important for consumers, the one they tend to value the most is its convenience, in which they expressed, by considering this service simple, intuitive and fast, where they can easily select what they want while being able to stay at the comfort of their homes. Likewise, they value the fact that they can have access to their previous orders and choose exactly the same meal they did in the past, saving time. Moreover, the interviewees mentioned they valued the variety these apps offer when it comes to the number of restaurants and menus available for them to choose from, which is also related to online convenience. Secondly, the majority of the interviewees value the fact that they can have real-time feedback – they know when their order is being prepared and they can follow the path of the delivery person, including time estimations of the delivery (aspects related with consumer’s perceptions of control over the process). At this point, none of them made references in regard to the app’s visual design and order accuracy.
Furthermore, the interviewees are satisfied with the service and the purchase experience through mobile apps. However, when asked about their level of satisfaction with the app itself their level of satisfaction changes depending on the app. Overall, all of them have tried Uber Eats, and they confirmed their satisfaction with the app and their willingness to both keep on using it and recommend it to others. The ones who tried Glovo have had bad experiences which made them not use the app again.
Additionally, all users trust these apps when it comes to the quality of the service and do not have any problems in providing their personal details to the companies. Currently, all users mentioned using the same app when they want to order food, yet, they mentioned the possibility to try a different app if the monetary incentives are better or if more variety is offered. The fact that the interviewees already have an account in Uber, because of the cars service, it is a big incentive for them to choose this app.
Lastly, some consumers mentioned being afraid of the quality of the food, and sometimes they do not like the packaging. Other concerns were related to the time estimations and the variety offered – the demand for healthier options and better estimations of time was noticed. Besides, interviewees mentioned times they were unhappy with the way the company handled problems with their orders.
Half of the participants suggested that the apps should start making promotions, like after a number of orders they would not have to pay the delivery fee.
Overall, as expected by previous literature, online convenience appears to be the attribute consumer’s value the most. Additionally, it seems that e-satisfaction and e-trust positively
affect consumer’s loyalty towards this service. Nevertheless, the participants are not as loyal to the app, but they intend to re-use it. Either way, these relationships will be deeper analyzed in the qualitative analysis. Also, the interviews made it possible to validate the factors previously identified as the dislikes of users – the quality of the food, packaging, time of delivery, low variety and the way the company handles some problems.
5.1.2. Non-users
First of all, Table 4 presents the sample characteristics of the non-users.
Table 4 - Non-users' Demographic Variables
Non-users Age Gender Education Monthly Income (€)
Mariana 26 F Bachelor's degree 1001-1500 Pedro 32 M Master's degree 1001-1500 Francisca 37 F Bachelor's degree 1001-1500 Carla 41 F Bachelor's degree 2001-2500 Luís 52 M Bachelor's degree 3501-4000 Ana 56 F Master's degree 2001-2500
Secondly, it appears that some interviewees have previous experience with food ordering, mentioning that they called directly the restaurant. From those, only one consumer had tried to order it online through the restaurant’s website. Half of the interviewees were familiar with the concept of food delivery apps. Either way, a careful explanation of the concept was given to all participants, which included showing one app and the process of ordering food.
Further, half of the participants mentioned technology as their main barrier to start using the referred service, they do not consider themselves very technological people. Besides, the inability to solve unexpected situations related to their meals in real-time consists of a barrier, as well as they feel they cannot reach an employee. Furthermore, they are concerned with the payment methods (the fact that you only use credit cards). Additionally, they commented that the features/attributes that would make them start using these apps were the fact that it is a practical, fast and easy to use service, and they believe the apps’ design is attractive.
Finally, the main things consumers do not like about the service are related to the inherent decline of the quality of the food, when compared to the one they get at the physical restaurant, and the lack of social interaction. All of them are skeptical in providing their personal details to the app, yet, they said that might not be a barrier at the end of the day. Some argued that if the service provided special promotions that would be an incentive to start using it. Curiously,
half of the interviewees mentioned the fact that using these apps appears to be so easy and practical, that they are afraid of wasting too much money if they get used to it, so they rather not make it a habit.
Overall, it seems that technology anxiety, privacy & security concerns, perceived need for interaction and the lack of customer service are indeed barriers preventing them to start using these apps, yet, one must validate these results with the ones from the survey.
5.1.3. Users vs. Non-users – Demographics
When looking at the age of all the interviewees, it is possible to recognize that age tends to have a negative impact upon the use of food delivery apps, which is aligned with the previous literature review. For the variables gender, education, and income is not possible to take significant conclusions, since there are no differences between users and non-users. Therefore, the results of the survey analysis will be crucial to validate the theoretical framework.
5.2. Quantitative Analysis – Online survey
The online survey (Appendix 3) followed different directions depending on the respondent’s previous experience with food delivery apps. Therefore, the same approach chosen to analyze the results of the in-depth interviews separately was used.
5.2.1. General Sample Characteristics
First of all, 263 people started the survey but only 215 finished it, which translates into an 82% response rate, leading one to conclude that the survey length was adequate. Secondly, after cleaning the data set and deleting outliers the final sample was composed of 202 people. The results for the sample characteristics are presented in Appendix 4. In regard to age, 77% of the respondents belong to the 21-30 range, while the other ranges were uniformly distributed, with the exception of the range – (>60) – which only had one respondent. Moreover, the sample is composed mostly of women (72.3%) rather than men (27.7%). When it comes to education, most respondents (93.6%) had a higher level of education (Bachelor’s degree – 54%; Master’s Degree – 39.1%; Ph.D. – 0.5%), in contrast with 6,4% that finished their education in high school. Besides, the majority (65.8%) of the participants has a monthly income smaller or equal to 1000€ (0-500€: 39.1%; 501-1000€: 26.7%), when compared to the other ranges.
On average, the typical respondent of this survey is a woman aged between 21-30, with a bachelor’s degree and a monthly income between 501-1000€.
Furthermore, 88.1% of the participants have past experiences in food delivery, i.e., they have ordered food in the past (Appendix 5). Likewise, almost all respondents (82.2%) are familiar with the service of ordering food through mobile apps (Appendix 6).
5.2.2. Users
From the total number (202) of participants, 127 were users (62.9%) of food delivery apps (Appendix 7). Therefore, for the following analysis, the sample was composed of 127 people.
(a) Food delivery in general
The sample of 127 users includes both people who have ordered food through apps and continue to order, as well as people who have ordered but do not order any more (Appendix 7). Throughout the analysis, the two groups are analyzed together as users.
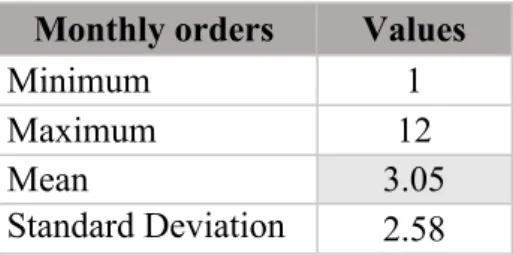
Participants order food through apps, on average, 3 times a month (Table 5).
Table 5 - Descriptive Statistics for frequency of monthly ordering (N=127) Monthly orders Values
Minimum 1
Maximum 12
Mean 3.05
Standard Deviation 2.58
(b) Attributes
To validate the reliability of the constructs of the four attributes of food delivery apps, the Cronbach’s alpha was analyzed (Table 6) and the results were interpreted according to the values presented in the last Chapter. Online convenience has the lowest Cronbach alpha, indicating a questionable reliability yet, it is very close to 7, which is considered acceptable. In contrast, visual design presents a Cronbach alpha above 8, which is considered good. And finally, both perceived control and order accuracy present a Cronbach alpha above 7, values that are perceived as acceptable.
Even with satisfactory values of the Cronbach’s Alphas of the items used to measure the attributes, one should notice that it does not prove that the scale is unidimensional (Gliem & Gliem, 2003). Therefore, the results were further analyzed by conducting a Confirmatory Factor Analysis. Almost all the standardized factor loadings are above 0.5 (Appendix 8), which according to Hair, Black, Babin, & Anderson (2010), are considered good, indicating their convergence on the latent construct. Besides, Table 6 presents the values for the Construct
Reliability (CR) and for the Average Variance Extracted (AVE), which values should be higher than 7 and 5, respectively, in agreement with Hair et al. (2010). Although not all the values for the AVE are higher than 5, the values of the CR are all higher than 7, indicating a good convergent validity. Furthermore, Table 6 also presents the values of the Maximum Shared Variance (MSV), which should be lower than the AVE values to ensure discriminant validity (Hu & Bentler, 1999). Hair et al. (2010) describe discriminant validity as the difference between constructs, i.e., the uniqueness of each construct is related to high discriminant validity. In fact, AVE values are higher than the ones of the MSV, which ensures discriminant validity. Overall, the results show an acceptable quality of adjustment (c2/df=1.354; CFI= 0.941; GFI=0.895;
RMSEA=0.053), according to the rules presented in the last chapter.
Table 6 - Cronbach's Alpha & Confirmatory Factor Analysis
Attributes Nº of items Cronbach´s Alfa CR AVE MSV
Online Convenience 5 .691 0.735 0.369 0.115 Visual Design 4 .810 0.816 0.532 0.239 Perceived Control 3 .703 0.725 0.471 0.091 Order Accuracy 3 .711 0.732 0.481 0.239
In general, the majority (Appendix 9) of respondents expressed their agreement with the items related with each attribute, and only a few exceptions were detected. The results of the means for each attribute are presented in Appendix 10.
When it comes to online convenience, respondents do not find it that easy to solve unexpected problems that might arise with their order (mean of 2.99). Likewise, it is evident some indifference related to the variety offered by the apps in terms of restaurants (mean of 3.72). Nevertheless, in general, participants perceived the service as convenient (mean of 3.9). Respondents find the visual design of food delivery apps as generally attractive and consistent in aesthetic and informational terms (mean of 3.91).
Regarding perceptions of control, participants are indifferent when it comes to perceived level of control while ordering food without the presence of an employee (mean of 3.5). However, the majority believes they are able to order what they want, when they want, and where they want, as well as, being able to have real-time information. Therefore, they tend to feel they are in control while using this service (mean of 3.86).
Order accuracy is the most challenging attribute (mean of 3.56). Respondents do not perceive the time of delivery as accurate as they wish (mean of 3.26), and they do not always receive
what they order. Yet, they tend to perceive the information on the app as accurate (mean of 3.89).
Finally, respondents were asked to rank the attributes according to their level of preference or relevance/importance they give to them. The results of the ranking are presented in Appendix 11. In this case, a lower average means that a higher importance was given to the attribute. Therefore, by looking at the means, one can recognize that online convenience (mean of 1.69) is the attribute that participants value the most. Order accuracy (mean of 1.90) is the second attribute they consider more important, followed by perceived control (mean of 2.91) and visual design (mean of 3.5). In point f), the hypothesis for the attributes are further discussed.
(c) E-loyalty and Repurchase Intentions
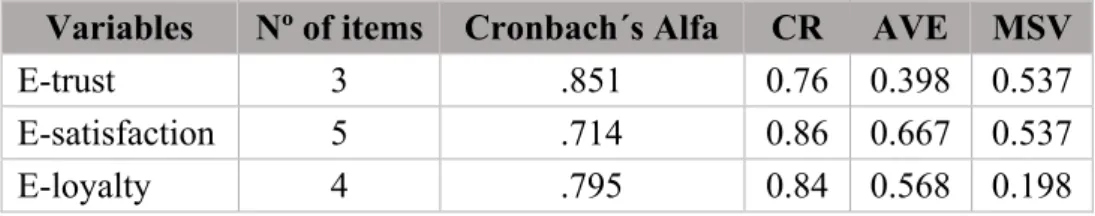
First of all, it was analyzed the consistency of the measurement of satisfaction, trust, and loyalty. The values for the Cronbach’s alpha (Table 7) are considered good for both e-satisfaction and e-loyalty, and acceptable for e-trust.
Secondly, the results from the confirmatory factor analysis are presented in Appendix 13. Once more, the majority of the standardized factor loadings are above 0.5, indicating a good convergence on the latent construct. Indeed, the values of the AVE and CR (Table 7) are almost all above the standard rule (CR>7; AVE>5), enhancing convergence validity. Yet, not all values of the MSV are lower than the AVE, implying some discriminant validity problems.
Overall, the results of the fit indexes indicate a questionable quality of adjustment (χ2/df=3.116;
CFI=.845; GFI=.842; RMSEA=.130).
Table 7 - Cronbach's Alpha & Confirmatory Factor Analysis
Variables Nº of items Cronbach´s Alfa CR AVE MSV
E-trust 3 .851 0.76 0.398 0.537 E-satisfaction 5 .714 0.86 0.667 0.537 E-loyalty 4 .795 0.84 0.568 0.198
Furthermore, the majority of the respondents is satisfied with the food delivery app they use, and they trust it, yet, they are not as loyal to the app as expected but they intend to re-use it in the short run (Appendix 14). The results of the means for e-satisfaction, e-trust, e-loyalty, and repurchase intentions are presented in Appendix 15.
Participants expressed their satisfaction with the app in general (mean of 4.10), with the service provided (mean of 4.09) and with the whole purchasing/ordering experience (mean of 4.11). When it comes to their level of trust, respondents believe the app they use to be reliable (mean