CERN-EP-2017-120 2018/05/03
CMS-TOP-16-007
Measurement of normalized differential tt cross sections in
the dilepton channel from pp collisions at
√
s
=
13 TeV
The CMS Collaboration
∗Abstract
Normalized differential cross sections for top quark pair production are measured in the dilepton (e+e−, µ+µ−, and µ∓e±) decay channels in proton-proton collisions
at a center-of-mass energy of 13 TeV. The measurements are performed with data
corresponding to an integrated luminosity of 2.1 fb−1 using the CMS detector at the
LHC. The cross sections are measured differentially as a function of the kinematic properties of the leptons, jets from bottom quark hadronization, top quarks, and top quark pairs at the particle and parton levels. The results are compared to several Monte Carlo generators that implement calculations up to next-to-leading order in perturbative quantum chromodynamics interfaced with parton showering, and also to fixed-order theoretical calculations of top quark pair production up to next-to-next-to-leading order.
Published in the Journal of High Energy Physics as doi:10.1007/JHEP04(2018)060.
c
2018 CERN for the benefit of the CMS Collaboration. CC-BY-4.0 license
∗See Appendix C for the list of collaboration members
1
Introduction
The measurement of tt differential cross sections can provide a test of perturbative quantum chromodynamic (QCD) calculations and also improve the knowledge of parton distribution functions (PDFs) [1]. Previous measurements of differential cross sections for tt production have been performed in proton-proton (pp) collisions at the CERN LHC at center-of-mass en-ergies of 7 [2, 3] and 8 TeV [4–12]. The dilepton (electron or muon) final state of the tt decay helps in the suppression of background events. This paper presents the first CMS
measure-ment at √s = 13 TeV in the dilepton decay final state and includes the same-flavor lepton
channels (e+e−and µ+µ−), using data corresponding to an integrated luminosity of 2.1 fb−1.
The statistical precision of the measurements is improved by the increased data sample from including the same-flavor lepton channels. The data were recorded by the CMS experiment at the LHC in 2015, and this measurement complements other recent measurements that have been reported in a different decay channel [13] and by a different experiment [14, 15].
The tt differential cross section measurements are performed at the particle and parton lev-els. Particle-level measurements use final-state kinematic observables that are experimentally measurable and theoretically well defined. Corrections are limited mainly to detector effects that can be determined experimentally. The particle-level measurements are designed to have minimal model dependencies. The visible differential cross section is defined for a phase space within the acceptance of the experiment. Large extrapolations into inaccessible phase-space regions are thus avoided in particle-level differential cross section measurements. In contrast, the parton-level measurement of the top quark pair production cross sections is performed in the full phase space. This facilitates comparisons to predictions in perturbative QCD.
The normalized tt differential cross sections are measured as a function of the kinematic prop-erties of the tt system, the top quarks and the top quark decay products, which include the jets coming from the hadronization of bottom quarks and the leptons. The particle-level mea-surements are performed with respect to the transverse momentum of the leptons and of the jets. The cross sections as a function of the invariant mass and rapidity of the tt system are also measured to help in understanding the PDFs. The angular difference in the transverse plane between the top and anti-top quarks is provided to compare to predictions of new physics be-yond the standard model [16]. In addition, the normalized tt cross sections are measured as a function of the transverse momenta of the top quark and of the top quark pair.
2
The CMS detector and simulation
2.1 The CMS detector
The central feature of the CMS apparatus is a superconducting solenoid of 6 m internal diam-eter, providing a magnetic field of 3.8 T. The solenoid volume encases the silicon pixel and strip tracker, a lead tungstate crystal electromagnetic calorimeter, and a brass and scintillator hadron calorimeter, each composed of a barrel and two endcap sections. Forward calorimeters extend the pseudorapidity (η) coverage provided by the barrel and endcap detectors. Muons are detected in gas-ionization chambers embedded in the steel flux-return yoke outside the solenoid. A more detailed description of the CMS detector, together with a definition of the coordinate system used and the relevant kinematic variables, can be found in Ref. [17]. The particle-flow (PF) algorithm [18] is used to reconstruct objects in the event, combining
infor-mation from all the CMS subdetectors. The missing transverse momentum vector (~pTmiss) is
defined as the projection onto the plane perpendicular to the beam axis of the negative vector
2.2 Signal and background simulation
Monte Carlo (MC) techniques are used to simulate the tt signal and the background processes.
We use thePOWHEG (v2) [20–23] generator to model the nominal tt signal at next-to-leading
order (NLO). In order to simulate tt events with additional partons, MADGRAPH5 aMC@NLO
(v2.2.2) [24] (MG5 aMC@NLO) is used, which includes both leading-order (LO) and NLO matrix
elements (MEs). Parton shower (PS) simulation is performed withPYTHIA8 (v8.205) [25], using
the tune CUETP8M1 [26] to model the underlying event. Up to two partons in addition to the tt
pair are calculated at NLO and combined with thePYTHIA8 PS simulation using the FXFX [27]
algorithm, denoted asMG5 aMC@NLO+PYTHIA8[FXFX]. Up to three partons are considered at
LO and combined with the PYTHIA8 PS simulation using the MLM [28] algorithm, denoted
asMG5 aMC@NLO+PYTHIA8[MLM]. The data are also compared to predictions obtained with
POWHEGsamples interfaced withHERWIG++ [29] (v 2.7.1) using the tune EE5C [30]. The signal
samples are simulated assuming a top quark mass of 172.5 GeV and normalized to the inclusive cross section calculated at NNLO precision with next-to-next-to-leading-logarithmic (NNLL) accuracy [31].
For the simulation of W boson production and the Drell–Yan process, theMG5 aMC@NLO
gen-erator is used, and the samples are normalized to the cross sections calculated at NNLO [32].
The t-channel single top quark production in the tW channel is simulated with the POWHEG
generator based on the five-flavor scheme [33, 34], and normalized to the cross sections
calcu-lated at NNLO [35]. Diboson samples (WW, WZ, and ZZ) are simucalcu-lated at LO usingPYTHIA8,
and normalized to the cross section calculated at NNLO for the WW sample [36] and NLO for the WZ and ZZ samples [37].
The detector response to the final-state particles is simulated using GEANT4 [38, 39]. Additional
pp collisions in the same or nearby beam crossings (pileup) are also simulated with PYTHIA8
and superimposed on the hard-scattering events using a pileup multiplicity distribution that reflects that of the analyzed data. Simulated events are reconstructed and analyzed with the same software used to process the data.
3
Object and event selection
The dilepton final state of the tt decay consists of two leptons (electrons or muons), at least
two jets, and pmissT from the two neutrinos. Events are selected using dilepton triggers with
asymmetric pTthresholds. The low transverse momentum (pT) threshold is 8 GeV for the muon
and 12 GeV for the electron, and the high-pT threshold is 17 GeV for both muon and electron.
The trigger efficiency is measured in data using triggers based on pmissT [40].
The reconstructed and selected muons [41] and electrons [42] are required to have pT>20 GeV
and|η| <2.4. Since the primary leptons that originated from top quark decays are expected to
be isolated, an isolation criterion is placed on each lepton to reduce the rate of secondary lep-tons from non-top hadronic decays. A relative isolation parameter is used, which is calculated
as the sum of the pT of charged and neutral hadrons and photons in a cone of angular radius
∆R=
√
(∆φ)2+ (∆η)2)around the direction of the lepton, divided by the lepton pT, where∆φ
and∆η are the azimuthal and pseudorapidity differences, respectively, between the directions
of the lepton and the other particle. Any mismodeling of the lepton selection in the simulation is accounted for by applying corrections derived using a “tag-and-probe” technique based on control regions in data [43].
45], with∆R = 0.4. The momenta of jets are corrected to account for effects from pileup, as well as nonuniformity and nonlinearity of the detector. For the data, energy corrections are also applied to correct the detector response [46]. We select jets with pT >30 GeV and|η| <2.4
that pass identification criteria designed to reject noise in the calorimeters.
Jets from the hadronization of b quarks (b jets) are identified by the combined secondary vertex b tagging algorithm [47]. The jets are selected using a loose working point [48], corresponding to an efficiency of about 80% and a light-flavor jet rejection probability of 85%. The b tagging efficiency in the simulation is corrected to be consistent with that in data.
Events are required to have exactly two oppositely charged leptons with the invariant mass
of the dilepton system M`+`− > 20 GeV, and two or more jets, at least one of which has to
be identified as a b jet. For the same-flavor lepton channels (ee and µµ), additional selection criteria are applied to reject events from Drell–Yan production: pmissT > 40 GeV and|M`+`− −
MZ| > 15 GeV, where MZis the Z boson mass [49]. The selected numbers of events after the
selection are listed in Table 1.
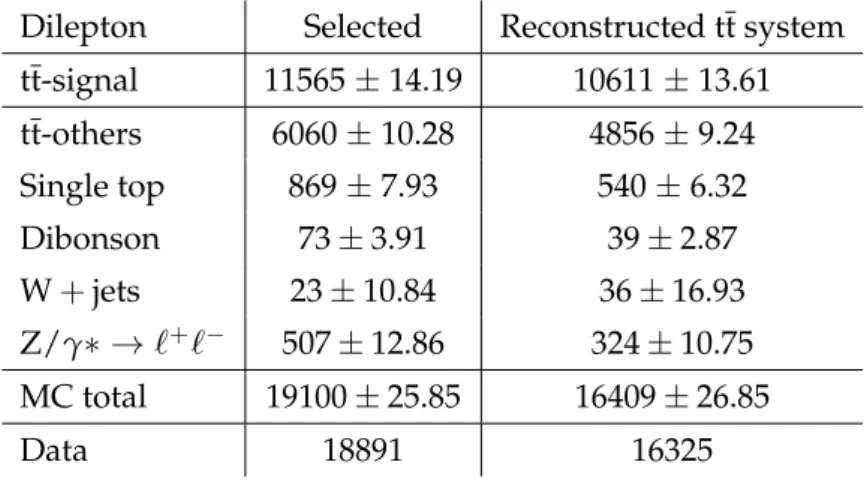
Table 1: The expected and observed numbers of events after selection are listed in the second column. The third column shows the numbers of reconstructed tt events.
Dilepton Selected Reconstructed tt system
tt-signal 11565±14.19 10611±13.61 tt-others 6060±10.28 4856±9.24 Single top 869±7.93 540±6.32 Dibonson 73±3.91 39±2.87 W+jets 23±10.84 36±16.93 Z/γ∗ → `+`− 507±12.86 324±10.75 MC total 19100±25.85 16409±26.85 Data 18891 16325
4
Signal definition
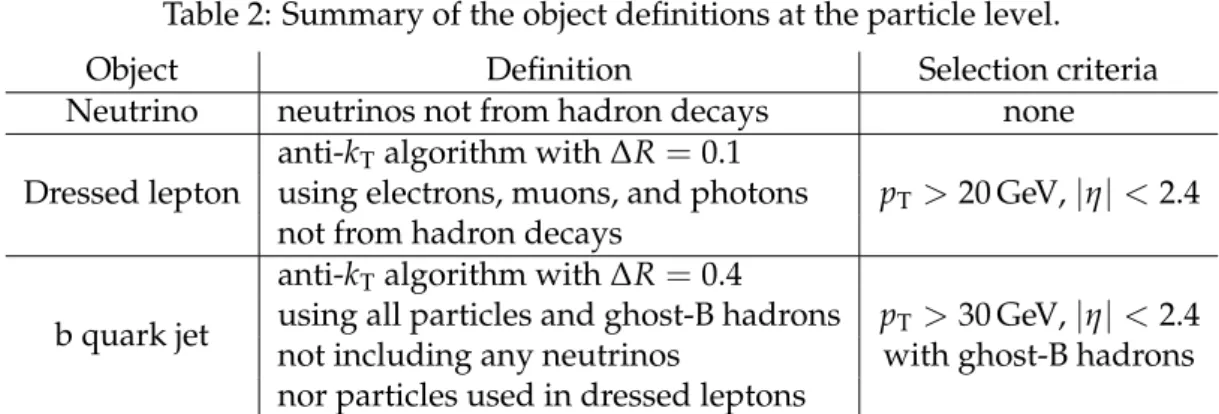
The measurements of normalized tt differential cross sections are performed at both particle and parton levels as a function of kinematic observables, defined at the generator level. The particle-level top quark is defined at the generator level using the procedure described below. This approach avoids theoretical uncertainties in the measurements due to the different calcu-lations within each generator, and leads to results that are largely independent of the generator implementation and tuning. Top quarks are reconstructed in the simulation starting from the final-state particles with a mean lifetime greater than 30 ps at the generator level, as summa-rized in Table 2.
Leptons are “dressed”, which means that leptons are defined using the anti-kTclustering
algo-rithm [44, 45] with∆R=0.1 to account for final-state radiated photons. To avoid the ambiguity
of additional leptons at the generator level, the clustering is applied to electrons, muons, and photons not from hadron decays. Events with leptons associated with τ lepton decays are treated as background. Leptons are required to satisfy the same acceptance requirements as imposed on the reconstructed objects described in Section 3, i.e., pT >20 GeV and|η| <2.4.
cluster-ing is applied to all final-state particles except neutrinos and particles already included in the
dressed-lepton definition. Jets are required to have pT > 30 GeV and |η| < 2.4 to be
consis-tent with the reconstructed-object selection. To identify the bottom quark flavor of the jet, the ghost-B hadron technique [13] is used in which short-lifetime B hadrons are included in the jet clustering after scaling down their momentum to be negligible. A jet is identified as a b jet if it contains any B hadrons among its constituents.
Table 2: Summary of the object definitions at the particle level.
Object Definition Selection criteria
Neutrino neutrinos not from hadron decays none
Dressed lepton
anti-kTalgorithm with∆R=0.1
using electrons, muons, and photons pT >20 GeV,|η| <2.4
not from hadron decays b quark jet
anti-kTalgorithm with∆R=0.4
using all particles and ghost-B hadrons pT >30 GeV,|η| <2.4
not including any neutrinos with ghost-B hadrons
nor particles used in dressed leptons
A W boson at the particle level is defined by combining a dressed lepton and a neutrino. In each event, a pair of particle-level W bosons is chosen among the possible combinations such that the sum of the absolute values of the invariant mass differences with respect to the W bo-son mass is minimal [49]. Similarly, a top quark at the particle level is defined by combining a particle-level W boson and a b jet. The combination of a W boson and a b jet with the min-imum invariant mass difference from the correct top quark mass [49] is selected. Events are considered to be in the visible phase space if they contain a pair of particle-level top quarks, constructed from neutrinos, dressed leptons, and b jets. Simulated dilepton events that are not in the visible phase space are considered as background and combined with the non-dilepton tt decay background contribution, subsequently denoted as tt-others.
In addition, the top quark and tt system observables are defined before the top quark decays into a bottom quark and a W boson and after QCD radiation, which we refer to as the parton level. The tt system at the parton level is calculated in the generator at NLO. The normalized differential cross sections at the parton level are derived by extrapolating the measurements into the full phase space, which includes the experimentally inaccessible regions, such as at high rapidity and low transverse momentum of the leptons and jets.
5
Reconstruction of the tt system
The top quark reconstruction method is adopted from the recent CMS measurement of the dif-ferential tt cross section [4]. In the dilepton channel, the reconstruction of the neutrino and antineutrino is crucial in measuring the top quark kinematic observables. Using an analytical approach [50, 51], the six unknown neutrino degrees of freedom are constrained by the two
measured components of~pTmissand the assumed invariant masses of both the W boson and top
quark. The efficiency for finding a physical solution depends on the detector resolution, which is accounted for by reconstructing the tt system in both the MC simulation and data with 100 trials, using random modifications of the measured leptons and b jets within their resolution functions. The efficiency for finding a physical solution to the kinematic reconstruction is ap-proximately 90%, as determined from simulation and data. The numbers of events remaining after reconstructing the ttbar system are listed in Table 1.
weight is calculated based on the expected invariant mass distribution of the lepton and b jet
pairs (M`b) at generator level. The lepton and b jet pairs with the maximum sum of weights
are chosen for the final solution of the tt system, and the reconstructed neutrino momentum is taken from the weighted average over the trials.
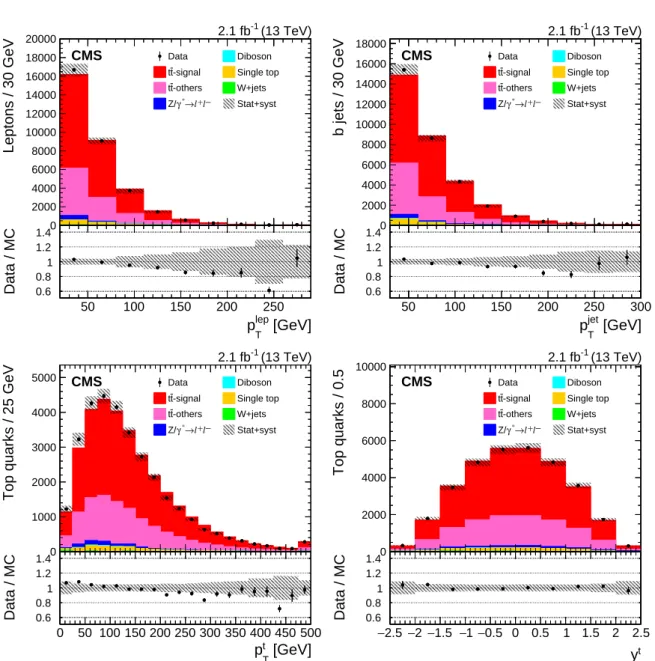
The kinematic variables of the leptons, b jets, top quarks, and tt system are taken from the selected final solution. Figure 1 shows the distributions of the transverse momenta of leptons (pTlep), jets (pTjet), and top quarks (ptT), and the rapidity of the top quarks (yt). Figure 2 displays
the distributions of the transverse momentum (ptt
T), rapidity (ytt), and invariant mass (Mtt) of
the tt system, and the azimuthal angle between the top quarks (∆φtt). In the upper panel of
each figure, the data points are compared to the sum of the expected contributions obtained from MC simulated events reconstructed as the data. The lower panel shows the ratio of the data to the expectations. The measured pTlep, pTjet, and ptT distributions are softer than those predicted by the MC simulation, resulting in the negative slopes observed in the bottom panels. However, in general, there is reasonable agreement between the data and simulation within the uncertainties, which are discussed in Sec. 7.
6
Normalized differential cross sections
The normalized differential tt cross sections(1/σ)(dσ/dX)are measured as a function of
sev-eral different kinematic variables X. The variables include ptT, pttT, yt, ytt, Mtt, and∆φtt, at both
the particle and parton levels. In addition, the measurements are performed with plep
T and pTjet
at the particle level. The measurements are compared to the predictions ofPOWHEG+PYTHIA8,
MG5 aMC@NLO+PYTHIA8[FXFX],MG5 aMC@NLO+PYTHIA8[MLM], andPOWHEG+HERWIG++.
The non-tt backgrounds are estimated from simulation and subtracted from the data. For Drell–Yan processes the normalization of the simulation is determined from the data using
the “Rout/in” method [52–54]. The non-tt backgrounds are first subtracted from the measured
distributions. The data distributions are slightly lower than those from the MC simulation. The tt-others backgrounds are then removed as a proportion of the total tt contribution by applying a single correction factor k shown in Eq. (1), using Eq. (2):
k= N
data−NMC non-tt
Ntt-sigMC +Ntt-othersMC , (1) Ntt-sigdata =Ndata−Nnon-ttMC −kNtt-othersMC . (2)
Here, NMC
non-ttis the total estimate for the non-tt background from the MC simulation, Ntt-sigMC is
the total MC-predicted tt signal yield, and NMC
tt-othersis the total MC prediction of the remaining
tt background. The tt signal yield, Ndata
tt-sig, is then extracted from the number of data events,
Ndata, separately in each bin of the kinematic distributions, as shown in Eq. (2).
The bin widths of the distributions are chosen to control event migration between the bins at the reconstruction and generator level due to detector resolutions. We define the purity (stability) as the number of events generated and correctly reconstructed in a certain bin, divided by the total number of events in the reconstruction-level (generator-level) bin. The bin widths are chosen to give both a purity and a stability of about 50%.
Detector resolution and reconstruction efficiency effects are corrected using an unfolding pro-cedure. The method relies on a response matrix that maps the expected relation between the
Leptons / 30 GeV 0 2000 4000 6000 8000 10000 12000 14000 16000 18000 20000 Data Diboson -signal t t Single top -others t t W+jets − l + l → * γ Z/ Stat+syst (13 TeV) -1 2.1 fb CMS [GeV] lep T p 50 100 150 200 250 Data / MC 0.6 0.8 1 1.2 1.4 b jets / 30 GeV 0 2000 4000 6000 8000 10000 12000 14000 16000 18000 Data Diboson -signal t t Single top -others t t W+jets − l + l → * γ Z/ Stat+syst (13 TeV) -1 2.1 fb CMS [GeV] jet T p 50 100 150 200 250 300 Data / MC 0.6 0.8 1 1.2 1.4
Top quarks / 25 GeV
0 1000 2000 3000 4000 5000 Data Diboson -signal t t Single top -others t t W+jets − l + l → * γ Z/ Stat+syst (13 TeV) -1 2.1 fb CMS [GeV] t T p 0 50 100 150 200 250 300 350 400 450 500 Data / MC 0.6 0.8 1 1.2 1.4 Top quarks / 0.5 0 2000 4000 6000 8000 10000 Data Diboson -signal t t Single top -others t t W+jets − l + l → * γ Z/ Stat+syst (13 TeV) -1 2.1 fb CMS t y 2.5 − −2 −1.5 −1−0.5 0 0.5 1 1.5 2 2.5 Data / MC 0.6 0.8 1 1.2 1.4
Figure 1: Reconstructed plep
T (upper left), pTjet(upper right), ptT(lower left), and yt(lower right)
distributions from data (points) and from MC simulation (shaded histograms). The signal def-inition for particle level is considered to distinguish tt-signal and tt-others. All corrections described in the text are applied to the simulation. The last bin includes the overflow events. The uncertainties shown by the vertical bars on the data points are statistical only while the hatched band shows the combined statistical and systematic uncertainties added in quadra-ture. The lower panels display the ratios of the data to the MC prediction.
Top quark pairs / 40 GeV 0 1000 2000 3000 4000 5000 6000 7000 Data Diboson -signal t t Single top -others t t W+jets − l + l → * γ Z/ Stat+syst (13 TeV) -1 2.1 fb CMS [GeV] t t T p 0 50 100 150 200 250 300 350 400 Data / MC 0.6 0.8 1 1.2 1.4
Top quark pairs / 0.5
0 1000 2000 3000 4000 5000 6000 Data Diboson -signal t t Single top -others t t W+jets − l + l → * γ Z/ Stat+syst (13 TeV) -1 2.1 fb CMS t t y 2.5 − −2 −1.5 −1−0.5 0 0.5 1 1.5 2 2.5 Data / MC 0.6 0.8 1 1.2 1.4
Top quark pairs / 90 GeV
0 1000 2000 3000 4000 5000 6000 7000 Data Diboson -signal t t Single top -others t t W+jets − l + l → * γ Z/ Stat+syst (13 TeV) -1 2.1 fb CMS [GeV] t t M 300 400 500 600 700 800 900 100011001200 Data / MC 0.6 0.8 1 1.2 1.4
Top quark pairs / 0.314 rad
0 2000 4000 6000 8000 10000 12000 14000 Data Diboson -signal t t Single top -others t t W+jets − l + l → * γ Z/ Stat+syst (13 TeV) -1 2.1 fb CMS [rad] t t φ ∆ 0 0.5 1 1.5 2 2.5 3 Data / MC 0.6 0.8 1 1.2 1.4
Figure 2: Reconstructed pttT(upper left), ytt(upper right), Mtt(lower left), and∆φtt(lower right) distributions from data (points) and from MC simulation (shaded histograms). The signal def-inition for particle level is considered to distinguish tt-signal and tt-others. All corrections described in the text are applied to the simulation. The last bin includes the overflow events. The uncertainties shown by the vertical bars on the data points are statistical only while the hatched band shows the combined statistical and systematic uncertainties added in quadra-ture. The lower panels display the ratios of the data to the MC prediction.
true and reconstructed variables taken from thePOWHEG+PYTHIA8 simulation. The D’Agostini method [55] is employed to perform the unfolding. The effective regularization strength of the iterative D’Agostini unfolding is controlled by the number of iterations. A small number of iterations can bias the measurement towards the simulated prediction, while with a large num-ber of iterations the result converges to that of a matrix inversion. The numnum-ber of iterations is optimized for each distribution, using simulation to find the minimum number of iterations that reduces the bias to a negligible level. This optimization is performed with the multiplica-tion of the response matrix and does not require any regularizamultiplica-tion. A detailed descripmultiplica-tion of the method can be found in Ref. [13].
7
Systematic uncertainties
Several sources of systematic uncertainties are studied. The normalized differential cross sec-tions are remeasured with respect to each source of systematic uncertainty individually, and the differences from the nominal values in each bin are taken as the corresponding systematic uncertainty. The overall systematic uncertainties are then obtained as the quadratic sum of the individual components.
The pileup distribution used in the simulation is varied by shifting the assumed total
inelas-tic pp cross section by±5%, in order to determine the associated systematic uncertainty. The
systematic uncertainties in the lepton trigger, identification, and isolation efficiencies are deter-mined by varying the measured scale factors by their total uncertainties. Uncertainties coming from the jet in the jet energy scale (JES) and jet energy resolution (JER) are determined on a per-jet basis by shifting the energies of the jets [56] within their measured energy scale and resolution uncertainties. The b tagging uncertainty is estimated by varying its efficiency uncer-tainty.
The uncertainty in the non-tt background normalization is estimated using a 15–30% variation in the background yields, which is based on a previous CMS measurement of the tt cross sec-tion [40]. The uncertainty in the shape of the tt-others contribusec-tion is obtained by reweighting
the pT distribution of the top quark for the tt-others events to match the data and comparing
with the unweighted contribution. For the theoretical uncertainties, we investigate the effect
of the choice of PDFs, factorization and renormalization scales (µFand µR), variation of the top
quark mass, top quark pT, and hadronization and generator modeling.
The PDF uncertainty is estimated using the uncertainties in the NNPDF30 NLO as 0118 set
with the strong coupling strength αs = 0.118 [57]. We measure 100 individual uncertainties
and take the root-mean-square as the PDF uncertainty, following the PDF4LHC
recommenda-tion [58]. In addirecommenda-tion, we consider the PDF sets with αs = 0.117 and 0.119. The MC generator
modeling uncertainties are estimated by taking the difference between the results based on the
POWHEGandMG5 aMC@NLOgenerators.
The uncertainty from the choice of µFand µRis estimated by varying the scales by a factor of
two up and down inPOWHEGindependently for the ME and PS steps. For the ME calculation,
all possible combinations are considered independently, excluding the most extreme cases of
(µF, µR) = (0.5, 2) and (2, 0.5) [59, 60]. The scale uncertainty in the PS modeling is assessed
using dedicated MC samples with the scales varied up and down together. The uncertainties in the factorization and renormalization scales in the ME and PS calculations are taken as the envelope of the differences with respect to the nominal parameter choice.
nominal MC sample with a top quark mass of 172.5 GeV and samples with masses of 171.5 and
173.5 GeV. The tt signal cross sections are not corrected for the mismodeling of the top quark pT
distribution in simulation. Instead, a systematic uncertainty from this mismodeling is obtained by comparing the nominal results to the results obtained from a response matrix using tt-signal
in which the top quark pT distribution is reweighted to match the data. The uncertainty from
hadronization and PS modeling is estimated by comparing the results obtained fromPOWHEG
samples interfaced withPYTHIA8 and withHERWIG++.
Table 3 lists typical values for the statistical and systematic uncertainties in the measured nor-malized tt differential cross sections. The table gives the uncertainty sources and corresponding range of the median uncertainty of each distribution, at both the particle and parton levels. The
hadronization is the dominant systematic uncertainty source for pt
T (4.9% at particle and 7.1%
at parton level) and Mtt(5.9% at particle and 7.4% at parton level), and the MC generator
mod-eling is dominant for yt (2.3% at particle and 2.2% at parton level), pttT (6.1% at particle and
3.9% at parton level), ytt(1.2% at particle and 1.6% at parton level), and∆φtt(9.2% at particle
and 7.3% at parton level). In general, the MC generator modeling and hadronization are the dominant systematic uncertainty sources for both the particle- and parton-level measurements. Table 3: Statistical and systematic uncertainties in the normalized tt differential cross sections at particle and parton levels. The uncertainty sources and the corresponding range of the median uncertainty of each distribution are shown in percent.
Uncertainty source Particle level [%] Parton level [%]
Statistical 0.24 – 0.59 0.36 – 0.63 Pileup modeling 0.02 – 0.48 0.07 – 0.49 Trigger efficiency 0.03 – 0.67 0.06 – 0.82 Lepton efficiency 0.06 – 0.94 0.07 – 0.90 JES 0.14 – 2.04 0.29 – 1.44 JER 0.04 – 0.85 0.29 – 0.65 b jet tagging 0.12 – 1.19 0.26 – 1.16 Background 0.13 – 2.14 0.09 – 1.28 PDFs 0.15 – 0.96 0.17 – 0.97 MC generator 0.66 – 9.24 1.61 – 7.32 Fact./renorm. 0.10 – 4.15 0.17 – 4.15
Top quark mass 0.49 – 1.89 0.68 – 3.05
Top quark pT 0.02 – 1.74 0.02 – 0.69
Hadronization — PS modeling 0.70 – 5.85 0.41 – 7.44
Total systematic uncertainty 1.7 – 15 3.1 – 13
8
Results
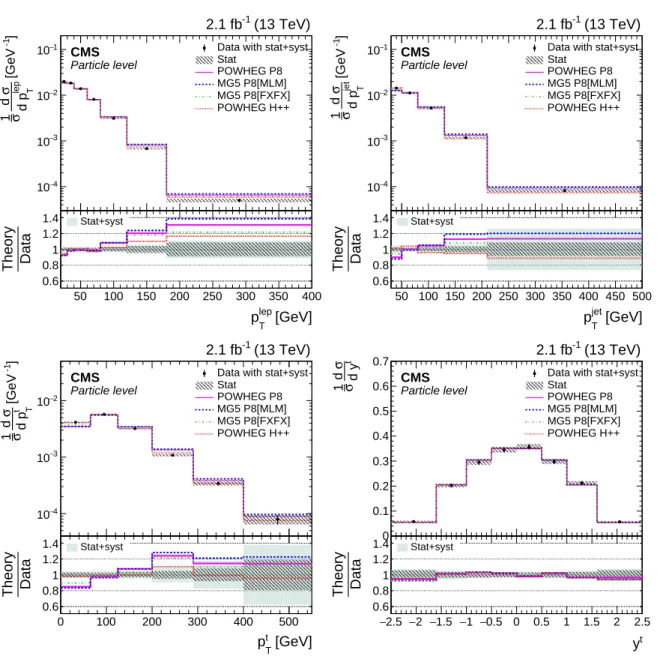
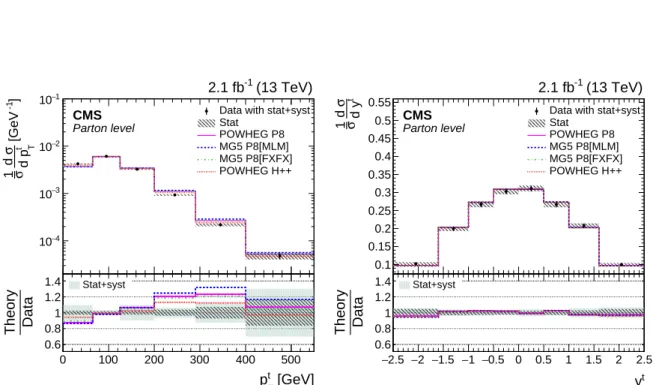
The normalized differential tt cross sections are measured by subtracting the background con-tribution, correcting for detector effects and acceptance, and dividing the resultant number of tt signal events by the total inclusive tt cross section. Figs. 3 and 4 show the normalized differ-ential tt cross sections as a function of pTlep, pTjet, ptT, yt, pttT, ytt, Mtt, and∆φttat the particle level in the visible phase space. Parton-level results are also independently extrapolated to the full
phase space using thePOWHEG+PYTHIA8 tt simulation. Figures 5 and 6 show the normalized
full phase space. The measured data are compared to different standard model predictions
from POWHEG+PYTHIA8, MG5 aMC@NLO+PYTHIA8[FXFX], MG5 aMC@NLO+PYTHIA8[MLM],
andPOWHEG+HERWIG++ in the figures. The values of the measured normalized differential tt
cross sections at the parton and particle levels with their statistical and systematic uncertainties are listed in Appendices A and B.
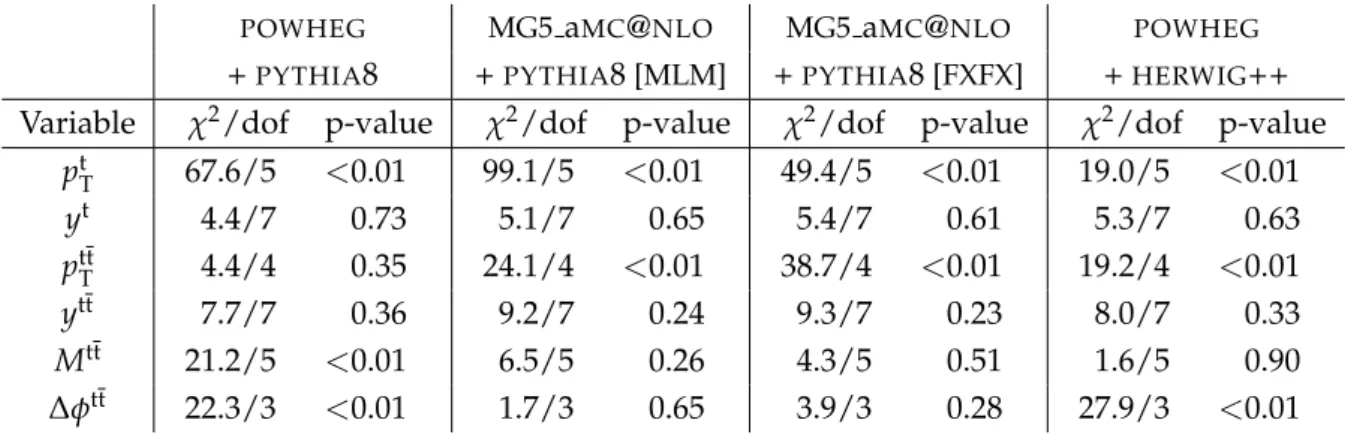
The compatibility between the measurements and the predictions is quantified by means of a
χ2test performed with the full covariance matrix from the unfolding procedure, including the
systematic uncertainties. Tables 4 and 5 report the values obtained for the χ2with the numbers
of degrees of freedom (dof) and the corresponding p-values [61]. The lepton, jet, and top quark
pT spectra in data tend to be softer than the MC predictions for the high-pT region. A similar
trend was also observed at√s = 8 TeV by both the ATLAS and CMS experiments [4, 5]. The
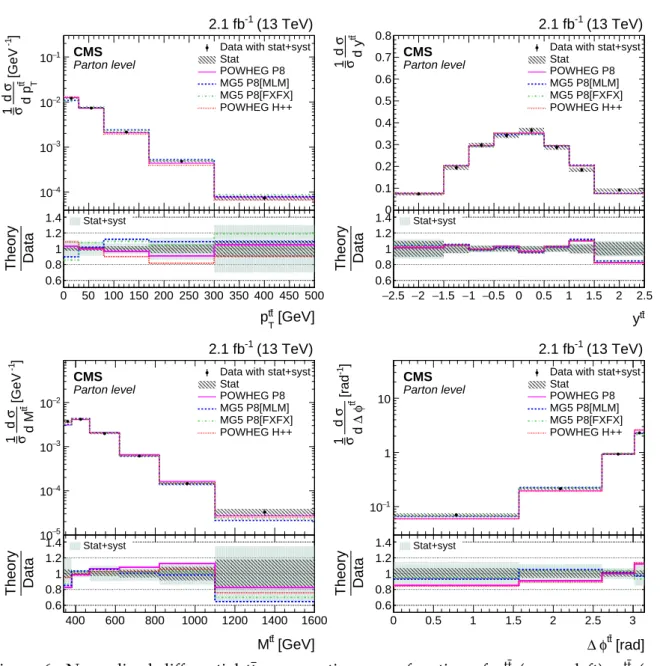
POWHEG+PYTHIA8 generator better describes the pttT, yt, and yttdistributions at the particle and
parton levels, while POWHEG+HERWIG++ is found to be in good agreement for the ptT at the
parton and particle levels. In general, measurements are found to be in fair agreement with predictions within the uncertainties.
The parton-level results are also compared to the following perturbative QCD calculations:
• An approximate NNLO calculation based on QCD threshold expansions beyond the
leading-logarithmic approximation using the CT14nnlo PDF set [62].
• An approximate next-to-NNLO (N3LO) calculation performed with the
resumma-tion of soft-gluon contriburesumma-tions in the double-differential cross secresumma-tion at NNLL ac-curacy in momentum space using the MMHT2014 PDF set [63, 64].
• An improved NNLL QCD calculation (NLO+NNLL’) [65] with simultaneous
resum-mation of soft and small-mass logarithms to NNLL accuracy, matched with both the standard soft-gluon resummation at NNLL accuracy and the fixed-order calculation at NLO accuracy, using the MTSW2008nnlo PDF set.
• A full NNLO calculation based on the NNPDF3.0 PDF set [66].
The measurements and the perturbative QCD predictions are shown in Figs. 7 and 8. Table 6
gives the χ2/dof and the corresponding p-values for the agreement between the measurements
and QCD calculations. The normalized differential tt cross sections as a function of the yt,
ytt, and pttT are found to be in good agreement with the different predictions considered. We
observe some tension between the data and the NNLO predictions for other variables such as the ptTand Mtt.
9
Summary
The normalized differential cross sections for top quark pair production have been presented
by the CMS experiment in the dilepton decay channel in pp collisions at √s = 13 TeV with
data corresponding to an integrated luminosity of 2.1 fb−1. The differential cross sections are
measured as a function of several kinematic variables at particle level in a visible phase space corresponding to the detector acceptance and at parton level in the full phase space. The mea-surements are compared to the predictions from Monte Carlo simulations and calculations in perturbative quantum chromodynamics. In general, the measurements are in fairly good
agree-ment with predictions. We confirm that the top quark pT spectrum in data is softer than the
Monte Carlo predictions at both particle and parton levels, as reported by the ATLAS and CMS experiments. The present results are in agreement with the earlier ATLAS and CMS measure-ments. We also find that the measurements are in better agreement with calculations within
] -1 [GeV lep T d p σ d σ 1 4 − 10 3 − 10 2 − 10 1 − 10 (13 TeV) -1 2.1 fb CMS Particle level
Data with stat+syst Stat POWHEG P8 MG5 P8[MLM] MG5 P8[FXFX] POWHEG H++ [GeV] lep T p 50 100 150 200 250 300 350 400 Data Theory 0.6 0.8 1 1.2 1.4 Stat+syst ] -1 [GeV jet T d p σ d σ 1 4 − 10 3 − 10 2 − 10 1 − 10 (13 TeV) -1 2.1 fb CMS Particle level
Data with stat+syst Stat POWHEG P8 MG5 P8[MLM] MG5 P8[FXFX] POWHEG H++ [GeV] jet T p 50 100 150 200 250 300 350 400 450 500 Data Theory 0.6 0.8 1 1.2 1.4 Stat+syst ] -1 [GeVt T d p σ d σ 1 4 − 10 3 − 10 2 − 10 (13 TeV) -1 2.1 fb CMS Particle level
Data with stat+syst Stat POWHEG P8 MG5 P8[MLM] MG5 P8[FXFX] POWHEG H++ [GeV] t T p 0 100 200 300 400 500 Data Theory 0.6 0.8 1 1.2 1.4 Stat+syst t d y σ d σ 1 0 0.1 0.2 0.3 0.4 0.5 0.6 0.7 (13 TeV) -1 2.1 fb CMS Particle level
Data with stat+syst Stat POWHEG P8 MG5 P8[MLM] MG5 P8[FXFX] POWHEG H++ t y 2.5 − −2 −1.5 −1 −0.5 0 0.5 1 1.5 2 2.5 Data Theory 0.6 0.8 1 1.2 1.4 Stat+syst
Figure 3: Normalized differential tt cross sections as a function of lepton (upper left), jet
(upper right), and top quark pT (lower left) and top quark rapidity (lower right),
mea-sured at the particle level in the visible phase space and combining the distributions for top quarks and antiquarks. The measured data are compared to different standard model
predic-tions fromPOWHEG+PYTHIA8 (POWHEG P8),MG5 aMC@NLO+PYTHIA8[MLM](MG5 P8[MLM]),
MG5 aMC@NLO+PYTHIA8[FXFX] (MG5 P8[FXFX]), and POWHEG+HERWIG++ (POWHEG H++).
The vertical bars on the data points indicate the total (combined statistical and systematic) un-certainties while the hatched band shows the statistical uncertainty. The lower panel gives the ratio of the theoretical predictions to the data. The light-shaded band displays the combined statistical and systematic uncertainties added in quadrature.
] -1 [GeV tt T d p σ d σ 1 4 − 10 3 − 10 2 − 10 1 − 10 (13 TeV) -1 2.1 fb CMS Particle level
Data with stat+syst Stat POWHEG P8 MG5 P8[MLM] MG5 P8[FXFX] POWHEG H++ [GeV] t t T p 0 50 100 150 200 250 300 350 400 450 500 Data Theory 0.6 0.8 1 1.2 1.4 Stat+syst tt d y σ d σ 1 0 0.1 0.2 0.3 0.4 0.5 0.6 0.7 0.8 0.9 (13 TeV) -1 2.1 fb CMS Particle level
Data with stat+syst Stat POWHEG P8 MG5 P8[MLM] MG5 P8[FXFX] POWHEG H++ t t y 2.5 − −2 −1.5 −1 −0.5 0 0.5 1 1.5 2 2.5 Data Theory 0.6 0.8 1 1.2 1.4 Stat+syst ] -1 [GeV tt d M σ d σ 1 4 − 10 3 − 10 2 − 10 (13 TeV) -1 2.1 fb CMS Particle level
Data with stat+syst Stat POWHEG P8 MG5 P8[MLM] MG5 P8[FXFX] POWHEG H++ [GeV] t t M 400 600 800 1000 1200 1400 1600 Data Theory 0.6 0.8 1 1.2 1.4 Stat+syst ] -1 [rad tt φ ∆ d σ d σ 1 1 − 10 1 10 (13 TeV) -1 2.1 fb CMS Particle level
Data with stat+syst Stat POWHEG P8 MG5 P8[MLM] MG5 P8[FXFX] POWHEG H++ [rad] t t φ ∆ 0 0.5 1 1.5 2 2.5 3 Data Theory 0.6 0.8 1 1.2 1.4 Stat+syst
Figure 4: Normalized differential tt cross sections as a function of pttT (upper left), ytt
(up-per right), Mtt (lower left), and ∆φtt (lower right), measured at the particle level in the
visible phase space. The measured data are compared to different standard model
predic-tions fromPOWHEG+PYTHIA8 (POWHEG P8),MG5 aMC@NLO+PYTHIA8[MLM](MG5 P8[MLM]),
MG5 aMC@NLO+PYTHIA8[FXFX] (MG5 P8[FXFX]), and POWHEG+HERWIG++ (POWHEG H++).
The vertical bars on the data points indicate the total (combined statistical and systematic) un-certainties while the hatched band shows the statistical uncertainty. The lower panel gives the ratio of the theoretical predictions to the data. The light-shaded band displays the combined statistical and systematic uncertainties added in quadrature.
] -1 [GeVt T d p σ d σ 1 4 − 10 3 − 10 2 − 10 1 − 10 (13 TeV) -1 2.1 fb CMS Parton level
Data with stat+syst Stat POWHEG P8 MG5 P8[MLM] MG5 P8[FXFX] POWHEG H++ [GeV] t T p 0 100 200 300 400 500 Data Theory 0.6 0.8 1 1.2 1.4 Stat+syst t d y σ d σ 1 0.1 0.15 0.2 0.25 0.3 0.35 0.4 0.45 0.5 0.55 (13 TeV) -1 2.1 fb CMS Parton level
Data with stat+syst Stat POWHEG P8 MG5 P8[MLM] MG5 P8[FXFX] POWHEG H++ t y 2.5 − −2 −1.5 −1 −0.5 0 0.5 1 1.5 2 2.5 Data Theory 0.6 0.8 1 1.2 1.4 Stat+syst
Figure 5: Normalized differential tt cross sections as a function of top quark pT (left)
and top quark rapidity (right), measured at the parton level in the full phase space and combining the distributions for top quarks and antiquarks. The measured data are
com-pared to different standard model predictions from POWHEG+PYTHIA8 (POWHEG P8),
MG5 aMC@NLO+PYTHIA8[MLM] (MG5 P8[MLM]), MG5 aMC@NLO+PYTHIA8[FXFX] (MG5
P8[FXFX]), andPOWHEG+HERWIG++ (POWHEG H++). The vertical bars on the data points indi-cate the total (combined statistical and systematic) uncertainties while the hatched band shows the statistical uncertainty. The lower panel gives the ratio of the theoretical predictions to the data. The light-shaded band displays the combined statistical and systematic uncertainties added in quadrature.
] -1 [GeV tt T d p σ d σ 1 4 − 10 3 − 10 2 − 10 1 − 10 (13 TeV) -1 2.1 fb CMS Parton level
Data with stat+syst Stat POWHEG P8 MG5 P8[MLM] MG5 P8[FXFX] POWHEG H++ [GeV] t t T p 0 50 100 150 200 250 300 350 400 450 500 Data Theory 0.6 0.8 1 1.2 1.4 Stat+syst tt d y σ d σ 1 0 0.1 0.2 0.3 0.4 0.5 0.6 0.7 0.8 (13 TeV) -1 2.1 fb CMS Parton level
Data with stat+syst Stat POWHEG P8 MG5 P8[MLM] MG5 P8[FXFX] POWHEG H++ t t y 2.5 − −2 −1.5 −1 −0.5 0 0.5 1 1.5 2 2.5 Data Theory 0.6 0.8 1 1.2 1.4 Stat+syst ] -1 [GeV tt d M σ d σ 1 5 − 10 4 − 10 3 − 10 2 − 10 (13 TeV) -1 2.1 fb CMS Parton level
Data with stat+syst Stat POWHEG P8 MG5 P8[MLM] MG5 P8[FXFX] POWHEG H++ [GeV] t t M 400 600 800 1000 1200 1400 1600 Data Theory 0.6 0.8 1 1.2 1.4 Stat+syst ] -1 [rad tt φ ∆ d σ d σ 1 1 − 10 1 10 (13 TeV) -1 2.1 fb CMS Parton level
Data with stat+syst Stat POWHEG P8 MG5 P8[MLM] MG5 P8[FXFX] POWHEG H++ [rad] t t φ ∆ 0 0.5 1 1.5 2 2.5 3 Data Theory 0.6 0.8 1 1.2 1.4 Stat+syst
Figure 6: Normalized differential tt cross sections as a function of pttT (upper left), ytt
(up-per right), Mtt (lower left), and ∆φtt (lower right), measured at the parton level in the
full phase space. The measured data are compared to different standard model
predic-tions fromPOWHEG+PYTHIA8 (POWHEG P8),MG5 aMC@NLO+PYTHIA8[MLM](MG5 P8[MLM]),
MG5 aMC@NLO+PYTHIA8[FXFX] (MG5 P8[FXFX]), and POWHEG+HERWIG++ (POWHEG H++).
The vertical bars on the data points indicate the total (combined statistical and systematic) un-certainties while the hatched band shows the statistical uncertainty. The lower panel gives the ratio of the theoretical predictions to the data. The light-shaded band displays the combined statistical and systematic uncertainties added in quadrature.
Table 4: The χ2/dof and p-values for the comparison of the measured normalized tt differential cross sections with different model predictions at the particle level for each of the kinematic variables.
POWHEG MG5 aMC@NLO MG5 aMC@NLO POWHEG
+PYTHIA8 +PYTHIA8[MLM] +PYTHIA8[FXFX] +HERWIG++
Variable χ2/dof p-value χ2/dof p-value χ2/dof p-value χ2/dof p-value
plep T 63.4/6 <0.01 79.5/6 <0.01 44.1/6 <0.01 20.2/6 <0.01 pTjet 32.4/4 <0.01 60.0/4 <0.01 10.8/4 0.029 11.1/4 0.03 pt T 57.2/5 <0.01 77.7/5 <0.01 31.6/5 <0.01 4.2/5 0.53 yt 5.1/7 0.65 4.7/7 0.69 3.7/7 0.81 4.9/7 0.67 pttT 2.6/4 0.62 7.1/4 0.13 13.1/4 0.01 9.5/4 0.05 ytt 8.6/7 0.28 12.3/7 0.09 8.8/7 0.26 10.0/7 0.19 Mtt 16.9/4 <0.01 16.5/4 <0.01 5.3/4 0.26 14.2/4 <0.01 ∆φtt 14.7/3 <0.01 1.1/3 0.79 1.3/3 0.74 9.7/3 0.02
Table 5: The χ2/dof and p-values for the comparison of the measured normalized tt differential
cross sections with different model predictions at the parton level for each of the kinematic variables.
POWHEG MG5 aMC@NLO MG5 aMC@NLO POWHEG
+PYTHIA8 +PYTHIA8[MLM] +PYTHIA8[FXFX] +HERWIG++
Variable χ2/dof p-value χ2/dof p-value χ2/dof p-value χ2/dof p-value
pt T 67.6/5 <0.01 99.1/5 <0.01 49.4/5 <0.01 19.0/5 <0.01 yt 4.4/7 0.73 5.1/7 0.65 5.4/7 0.61 5.3/7 0.63 pttT 4.4/4 0.35 24.1/4 <0.01 38.7/4 <0.01 19.2/4 <0.01 ytt 7.7/7 0.36 9.2/7 0.24 9.3/7 0.23 8.0/7 0.33 Mtt 21.2/5 <0.01 6.5/5 0.26 4.3/5 0.51 1.6/5 0.90 ∆φtt 22.3/3 <0.01 1.7/3 0.65 3.9/3 0.28 27.9/3 <0.01
quantum chromodynamics up to next-to-next-to-leading-order accuracy at the parton level compared to previous next-to-leading-order predictions.
Table 6: The χ2/dof and p-values for the comparison of the measured normalized tt differential cross sections with published perturbative QCD calculations.
Approx. NNLO [62] Approx. N3LO [63] NLO+NNLL’ [65] NNLO [66] Variable χ2/dof p-value χ2/dof p-value χ2/dof p-value χ2/dof p-value
ptT 27.9/5 <0.01 43.8/5 <0.01 24.1/5 <0.01 44.8/5 <0.01 yt 4.2/7 0.76 3.75/7 0.81 3.8/7 0.80 pttT 4.0/4 0.40 ytt 7.6/7 0.37 Mtt 68.3/5 <0.01 47.6/5 <0.01 ] -1 [GeVt T d p σ d σ 1 4 − 10 3 − 10 2 − 10 1 − 10 (13 TeV) -1 2.1 fb CMS Parton level
Data with stat+syst Stat POWHEG P8 Approx. NNLO LO 3 Approx. N NLO+NNLL' NNLO [GeV] t T p 0 100 200 300 400 500 Data Theory 0.6 0.8 1 1.2 1.4 Stat+syst t d y σ d σ 1 0 0.1 0.2 0.3 0.4 0.5 0.6 (13 TeV) -1 2.1 fb CMS Parton level
Data with stat+syst Stat POWHEG P8 Approx. NNLO LO 3 Approx. N NNLO t y 2.5 − −2 −1.5 −1 −0.5 0 0.5 1 1.5 2 2.5 Data Theory 0.6 0.8 1 1.2 1.4 Stat+syst
Figure 7: Normalized differential tt cross sections as a function of top quark pT (left) and top
quark rapidity (right), measured at the parton level in the full phase space and combining the distributions for top quarks and antiquarks. The vertical bars on the data points indicate the total (combined statistical and systematic) uncertainties, while the hatched band shows the statistical uncertainty. The measurements are compared to different perturbative QCD
calcula-tions of an approximate NNLO [62], an approximate next-to-NNLO (N3LO) [63], an improved
NLO+NNLL (NLO+NNLL’) [65], and a full NNLO [66]. The lower panel gives the ratio of the theoretical predictions to the data.
] -1 [GeV tt T d p σ d σ 1 4 − 10 3 − 10 2 − 10 1 − 10 (13 TeV) -1 2.1 fb CMS Parton level
Data with stat+syst Stat POWHEG P8 NNLO [GeV] t t T p 0 50 100 150 200 250 300 350 400 450 500 Data Theory 0.6 0.8 1 1.2 1.4 Stat+syst tt d y σ d σ 1 0 0.1 0.2 0.3 0.4 0.5 0.6 (13 TeV) -1 2.1 fb CMS Parton level
Data with stat+syst Stat POWHEG P8 NNLO t t y 2.5 − −2 −1.5 −1 −0.5 0 0.5 1 1.5 2 2.5 Data Theory 0.6 0.8 1 1.2 1.4 Stat+syst ] -1 [GeV tt d M σ d σ 1 5 − 10 4 − 10 3 − 10 2 − 10 (13 TeV) -1 2.1 fb CMS Parton level
Data with stat+syst Stat POWHEG P8 NLO+NNLL' NNLO [GeV] t t M 400 600 800 1000 1200 1400 1600 Data Theory 0.6 0.8 1 1.2 1.4 Stat+syst
Figure 8: Normalized differential tt cross sections as a function of pttT (upper left), ytt (upper
right), and Mtt (lower) for the top quarks or antiquarks, measured at parton level in the full
phase space. The vertical bars on the data points indicate the total (combined statistical and sys-tematic) uncertainties, while the hatched band shows the statistical uncertainty. The measure-ments are compared to different perturbative QCD calculations of an improved NLO+NNLL (NLO+NNLL’) [65] and a full NNLO [66]. The lower panel gives the ratio of the theoretical predictions to the data.
Acknowledgments
We congratulate our colleagues in the CERN accelerator departments for the excellent perfor-mance of the LHC and thank the technical and administrative staffs at CERN and at other CMS institutes for their contributions to the success of the CMS effort. In addition, we grate-fully acknowledge the computing centres and personnel of the Worldwide LHC Computing Grid for delivering so effectively the computing infrastructure essential to our analyses. Fi-nally, we acknowledge the enduring support for the construction and operation of the LHC and the CMS detector provided by the following funding agencies: the Austrian Federal Min-istry of Science, Research and Economy and the Austrian Science Fund; the Belgian Fonds de la Recherche Scientifique, and Fonds voor Wetenschappelijk Onderzoek; the Brazilian Fund-ing Agencies (CNPq, CAPES, FAPERJ, and FAPESP); the Bulgarian Ministry of Education and Science; CERN; the Chinese Academy of Sciences, Ministry of Science and Technology, and Na-tional Natural Science Foundation of China; the Colombian Funding Agency (COLCIENCIAS); the Croatian Ministry of Science, Education and Sport, and the Croatian Science Foundation; the Research Promotion Foundation, Cyprus; the Secretariat for Higher Education, Science, Technology and Innovation, Ecuador; the Ministry of Education and Research, Estonian Re-search Council via IUT23-4 and IUT23-6 and European Regional Development Fund, Estonia; the Academy of Finland, Finnish Ministry of Education and Culture, and Helsinki Institute of Physics; the Institut National de Physique Nucl´eaire et de Physique des Particules / CNRS, and Commissariat `a l’ ´Energie Atomique et aux ´Energies Alternatives / CEA, France; the Bundes-ministerium f ¨ur Bildung und Forschung, Deutsche Forschungsgemeinschaft, and Helmholtz-Gemeinschaft Deutscher Forschungszentren, Germany; the General Secretariat for Research and Technology, Greece; the National Scientific Research Foundation, and National Innova-tion Office, Hungary; the Department of Atomic Energy and the Department of Science and Technology, India; the Institute for Studies in Theoretical Physics and Mathematics, Iran; the Science Foundation, Ireland; the Istituto Nazionale di Fisica Nucleare, Italy; the Ministry of Science, ICT and Future Planning, and National Research Foundation (NRF), Republic of Ko-rea; the Lithuanian Academy of Sciences; the Ministry of Education, and University of Malaya (Malaysia); the Mexican Funding Agencies (BUAP, CINVESTAV, CONACYT, LNS, SEP, and UASLP-FAI); the Ministry of Business, Innovation and Employment, New Zealand; the Pak-istan Atomic Energy Commission; the Ministry of Science and Higher Education and the Na-tional Science Centre, Poland; the Fundac¸˜ao para a Ciˆencia e a Tecnologia, Portugal; JINR, Dubna; the Ministry of Education and Science of the Russian Federation, the Federal Agency of Atomic Energy of the Russian Federation, Russian Academy of Sciences, the Russian Foun-dation for Basic Research and the Russian Competitiveness Program of NRNU “MEPhI”; the Ministry of Education, Science and Technological Development of Serbia; the Secretar´ıa de Es-tado de Investigaci ´on, Desarrollo e Innovaci ´on, Programa Consolider-Ingenio 2010, Plan de Ciencia, Tecnolog´ıa e Innovaci ´on 2013-2017 del Principado de Asturias and Fondo Europeo de Desarrollo Regional, Spain; the Swiss Funding Agencies (ETH Board, ETH Zurich, PSI, SNF, UniZH, Canton Zurich, and SER); the Ministry of Science and Technology, Taipei; the Thailand Center of Excellence in Physics, the Institute for the Promotion of Teaching Science and Tech-nology of Thailand, Special Task Force for Activating Research and the National Science and Technology Development Agency of Thailand; the Scientific and Technical Research Council of Turkey, and Turkish Atomic Energy Authority; the National Academy of Sciences of Ukraine, and State Fund for Fundamental Researches, Ukraine; the Science and Technology Facilities Council, UK; the US Department of Energy, and the US National Science Foundation.
Individuals have received support from the Marie-Curie program and the European Research Council and Horizon 2020 Grant, contract No. 675440 (European Union); the Leventis
Foun-dation; the A. P. Sloan FounFoun-dation; the Alexander von Humboldt FounFoun-dation; the Belgian Fed-eral Science Policy Office; the Fonds pour la Formation `a la Recherche dans l’Industrie et dans l’Agriculture (FRIA-Belgium); the Agentschap voor Innovatie door Wetenschap en Technologie (IWT-Belgium); the Ministry of Education, Youth and Sports (MEYS) of the Czech Republic; the Council of Scientific and Industrial Research, India; the HOMING PLUS program of the Foun-dation for Polish Science, cofinanced from European Union, Regional Development Fund, the Mobility Plus program of the Ministry of Science and Higher Education, the National Science Center (Poland), contracts Harmonia 2014/14/M/ST2/00428, Opus 2014/13/B/ST2/02543, 2014/15/B/ST2/03998, and 2015/19/B/ST2/02861, Sonata-bis 2012/07/E/ST2/01406; the National Priorities Research Program by Qatar National Research Fund; the Programa Clar´ın-COFUND del Principado de Asturias; the Thalis and Aristeia programs cofinanced by EU-ESF and the Greek NSRF; the Rachadapisek Sompot Fund for Postdoctoral Fellowship, Chula-longkorn University and the ChulaChula-longkorn Academic into Its 2nd Century Project Advance-ment Project (Thailand); and the Welch Foundation, contract C-1845.
References
[1] M. Czakon, M. L. Mangano, A. Mitov, and J. Rojo, “Constraints on the gluon PDF from top quark pair production at hadron colliders”, JHEP 07 (2013) 167,
doi:10.1007/JHEP07(2013)167, arXiv:1303.7215.
[2] CMS Collaboration, “Measurement of differential top-quark-pair production cross
sections in pp colisions at√s=7 TeV”, Eur. Phys. J. C 73 (2013) 2339,
doi:10.1140/epjc/s10052-013-2339-4, arXiv:1211.2220.
[3] ATLAS Collaboration, “Differential top-antitop cross-section measurements as a function
of observables constructed from final-state particles using pp collisions at√s =7 TeV in
the ATLAS detector”, JHEP 06 (2015) 100, doi:10.1007/JHEP06(2015)100, arXiv:1502.05923.
[4] CMS Collaboration, “Measurement of the differential cross section for top quark pair
production in pp collisions at√s =8 TeV”, Eur. Phys. J. C 75 (2015) 542,
doi:10.1140/epjc/s10052-015-3709-x, arXiv:1505.04480.
[5] ATLAS Collaboration, “Measurements of top-quark pair differential cross-sections in the
lepton+jets channel in pp collisions at√s=8 TeV using the ATLAS detector”, Eur. Phys.
J. C 76 (2016) 538, doi:10.1140/epjc/s10052-016-4366-4, arXiv:1511.04716. [6] CMS Collaboration, “Measurement of the differential cross sections for top quark pair
production as a function of kinematic event variables in pp collisions at√s=7 and
8 TeV”, Phys. Rev. D 94 (2016) 052006, doi:10.1103/PhysRevD.94.052006,
arXiv:1607.00837.
[7] CMS Collaboration, “Measurement of the integrated and differential tt production cross
sections for high-pTtop quarks in pp collisions at
√
s=8 TeV”, Phys. Rev. D 94 (2016)
072002, doi:10.1103/PhysRevD.94.072002, arXiv:1605.00116.
[8] CMS Collaboration, “Measurement of the tt production cross section in the all-jets final
state in pp collisions at√s =8 TeV”, Eur. Phys. J. C 76 (2016) 128,
[9] CMS Collaboration, “Measurement of tt production with additional jet activity, including
b quark jets, in the dilepton decay channel using pp collisions at√s=8 TeV”, Eur. Phys.
J. C 76 (2016) 379, doi:10.1140/epjc/s10052-016-4105-x, arXiv:1510.03072. [10] ATLAS Collaboration, “Measurement of jet activity in top quark events using the eµ final
state with two b-tagged jets in pp collisions at√s=8 TeV with the ATLAS detector”,
JHEP 09 (2016) 074, doi:10.1007/JHEP09(2016)074, arXiv:1606.09490. [11] ATLAS Collaboration, “Measurement of top quark pair differential cross-sections in the
dilepton channel in pp collisions at√s=7 and 8 TeV with ATLAS”, Phys. Rev. D 94
(2016) 092003, doi:10.1103/PhysRevD.94.092003, arXiv:1607.07281. [12] CMS Collaboration, “Measurement of double-differential cross sections for top quark
pair production in pp collisions at√s=8 TeV and impact on parton distribution
functions”, Eur. Phys. J. C 77 (2017) 459, doi:10.1140/epjc/s10052-017-4984-5,
arXiv:1703.01630v2.
[13] CMS Collaboration, “Measurement of differential cross sections for top quark pair production using the lepton+jets final state in proton-proton collisions at 13 TeV”, Phys. Rev. D 95 (2017) 092001, doi:10.1103/PhysRevD.95.092001, arXiv:1610.04191. [14] ATLAS Collaboration, “Measurement of jet activity produced in top-quark events with
an electron, a muon and two b-tagged jets in the final state in pp collisions at√s=13 TeV
with the ATLAS detector”, Eur. Phys. J. C 77 (2017) 220,
doi:10.1140/epjc/s10052-017-4766-0, arXiv:1610.09978.
[15] ATLAS Collaboration, “Measurements of top-quark pair differential cross-sections in the
eµ channel in pp collisions at√s=13 TeV using the ATLAS detector”, Eur. Phys. J. C 77
(2017) 292, doi:10.1140/epjc/s10052-017-4821-x, arXiv:1612.05220. [16] S. Choi and H. S. Lee, “Azimuthal decorrelation in tt production at hadron colliders”,
Phys. Rev. D 87 (2013) 034012, doi:10.1103/PhysRevD.87.034012, arXiv:1207.1484.
[17] CMS Collaboration, “The CMS experiment at the CERN LHC”, JINST 3 (2008) S08004, doi:10.1088/1748-0221/3/08/S08004.
[18] CMS Collaboration, “Particle-flow reconstruction and global event description with the CMS detector”, JINST 12 (2017) P10003, doi:10.1088/1748-0221/12/10/P10003. [19] CMS Collaboration, “Missing transverse energy performance of the CMS detector”,
JINST 6 (2011) P09001, doi:10.1088/1748-0221/6/09/P09001, arXiv:1106.5048.
[20] P. Nason, “A new method for combining NLO QCD with shower Monte Carlo algorithms”, JHEP 11 (2004) 040, doi:10.1088/1126-6708/2004/11/040,
arXiv:hep-ph/0409146.
[21] S. Frixione, P. Nason, and C. Oleari, “Matching NLO QCD computations with parton shower simulations: the POWHEG method”, JHEP 11 (2007) 070,
doi:10.1088/1126-6708/2007/11/070, arXiv:0709.2092.
[22] S. Alioli, P. Nason, C. Oleari, and E. Re, “A general framework for implementing NLO calculations in shower Monte Carlo programs: the POWHEG BOX”, JHEP 06 (2010) 043,
[23] J. M. Campbell, R. K. Ellis, P. Nason, and E. Re, “Top-pair production and decay at NLO matched with parton showers”, JHEP 04 (2015) 114,
doi:10.1007/JHEP04(2015)114, arXiv:1412.1828.
[24] J. Alwall et al., “The automated computation of tree-level and next-to-leading order differential cross sections, and their matching to parton shower simulations”, JHEP 07 (2014) 079, doi:10.1007/JHEP07(2014)079, arXiv:1405.0301.
[25] T. Sj ¨ostrand, S. Mrenna, and P. Skands, “A brief introduction to PYTHIA 8.1”, Comp. Phys. Comm. 178 (2008) 852, doi:10.1016/j.cpc.2008.01.036,
arXiv:0710.3820.
[26] P. Skands, S. Carrazza, and J. Rojo, “Tuning PYTHIA 8.1: the Monash 2013 tune”, Eur. Phys. J. C 74 (2014) 3024, doi:10.1140/epjc/s10052-014-3024-y,
arXiv:1404.5630.
[27] R. Frederix and S. Frixione, “Merging meets matching in MC@NLO”, JHEP 12 (2012) 061, doi:10.1007/JHEP12(2012)061, arXiv:1209.6215.
[28] J. Alwall et al., “Comparative study of various algorithms for the merging of parton showers and matrix elements in hadronic collisions”, Eur. Phys. J. C 53 (2008) 473, doi:10.1140/epjc/s10052-007-0490-5, arXiv:0706.2569.
[29] M. Bahr et al., “Herwig++ physics and manual”, Eur. Phys. J. C 58 (2008) 639,
doi:10.1140/epjc/s10052-008-0798-9, arXiv:0803.0883.
[30] M. H. Seymour and A. Siodmok, “Constraining MPI models using σeff and recent
Tevatron and LHC Underlying Event data”, JHEP 10 (2013) 113,
doi:10.1007/JHEP10(2013)113, arXiv:1307.5015.
[31] M. Czakon and A. Mitov, “Top++: A program for the calculation of the top-pair cross-section at hadron colliders”, Comput. Phys. Commun. 185 (2014) 2930,
doi:10.1016/j.cpc.2014.06.021, arXiv:1112.5675.
[32] Y. Li and F. Petriello, “Combining QCD and electroweak corrections to dilepton production in FEWZ”, Phys. Rev. D 86 (2012) 094034,
doi:10.1103/PhysRevD.86.094034, arXiv:1208.5967.
[33] S. Frixione et al., “Single-top hadroproduction in association with a W boson”, JHEP 07 (2008) 029, doi:10.1088/1126-6708/2008/07/029, arXiv:0805.3067.
[34] E. Re, “Single-top Wt-channel production matched with parton showers using the POWHEG method”, Eur. Phys. J. C 71 (2011) 1547,
doi:10.1140/epjc/s10052-011-1547-z, arXiv:1009.2450.
[35] N. Kidonakis, “NNLL threshold resummation for top-pair and single-top production”, Phys. Part. Nucl. 45 (2014) 714, doi:10.1134/S1063779614040091,
arXiv:1210.7813.
[36] T. Gehrmann et al., “W+W−production at hadron colliders in next to next to leading
order QCD”, Phys. Rev. Lett. 113 (2014) 212001,
[37] J. M. Campbell and R. K. Ellis, “MCFM for the Tevatron and the LHC”, Nucl. Phys. Proc. Suppl. 205-206 (2010) 10, doi:10.1016/j.nuclphysbps.2010.08.011,
arXiv:1007.3492.
[38] J. Allison et al., “GEANT4 developments and applications”, IEEE Trans. Nucl. Sci. 53 (2006) 270, doi:10.1109/TNS.2006.869826.
[39] GEANT4 Collaboration, “GEANT4—a simulation toolkit”, Nucl. Instrum. Meth. A 506 (2003) 250, doi:10.1016/S0168-9002(03)01368-8.
[40] CMS Collaboration, “Measurement of the tt production cross section using events in the
eµ final state in pp collisions at√s=13 TeV”, Eur. Phys. J. C 77 (2017) 172,
doi:10.1140/epjc/s10052-017-4718-8, arXiv:1611.04040.
[41] CMS Collaboration, “Performance of CMS muon reconstruction in pp collision events at√
s =7 TeV”, JINST 7 (2012) P10002, doi:10.1088/1748-0221/7/10/P10002,
arXiv:1206.4071.
[42] CMS Collaboration, “Performance of electron reconstruction and selection with the CMS
detector in proton-proton collisions at√s=8 TeV”, JINST 10 (2015) P06005,
doi:10.1088/1748-0221/10/06/P06005, arXiv:1502.02701.
[43] CMS Collaboration, “Measurement of the top quark pair production cross section in
proton-proton collisions at√s=13 TeV”, Phys. Rev. Lett. 116 (2016) 052002,
doi:10.1103/PhysRevLett.116.052002, arXiv:1510.05302.
[44] M. Cacciari, G. P. Salam, and G. Soyez, “FastJet user manual”, Eur. Phys. J. C 72 (2012) 1896, doi:10.1140/epjc/s10052-012-1896-2, arXiv:1111.6097.
[45] M. Cacciari, G. P. Salam, and G. Soyez, “The anti-ktjet clustering algorithm”, JHEP 04
(2008) 063, doi:10.1088/1126-6708/2008/04/063, arXiv:0802.1189. [46] CMS Collaboration, “Jet energy scale and resolution in the CMS experiment in pp
collisions at 8 TeV”, JINST 12 (2017) P02014,
doi:10.1088/1748-0221/12/02/P02014, arXiv:1607.03663.
[47] CMS Collaboration, “Identification of b-quark jets with the CMS experiment”, JINST 8 (2013) P04013, doi:10.1088/1748-0221/8/04/P04013, arXiv:1211.4462. [48] CMS Collaboration, “Identification of b quark jets at the CMS experiment in the LHC
Run 2”, CMS Physics Analysis Summary CMS-PAS-BTV-15-001, 2016.
[49] Particle Data Group, C. Patrignani et al., “Review of particle physics”, Chin. Phys. C 40 (2016) 100001, doi:10.1088/1674-1137/40/10/100001.
[50] L. Sonnenschein, “Analytical solution of tt dilepton equations”, Phys. Rev. D 73 (2006) 054015, doi:10.1103/PhysRevD.73.054015, arXiv:hep-ph/0603011. [Erratum: doi:10.1103/PhysRevD.78.079902].
[51] R. H. Dalitz and G. R. Goldstein, “Analysis of top-antitop production and dilepton decay events and the top quark mass”, Phys. Lett. B 287 (1992) 225,
doi:10.1016/0370-2693(92)91904-N.
[52] CMS Collaboration, “First measurement of the cross section for top-quark pair
production in proton-proton collisions at√s=7 TeV”, Phys. Lett. B 695 (2011) 424,
[53] CMS Collaboration, “Measurement of the tt production cross section and the top quark
mass in the dilepton channel in pp collisions at√s =7 TeV”, JHEP 07 (2011) 049,
doi:10.1007/JHEP07(2011)049, arXiv:1105.5661.
[54] CMS Collaboration, “Measurement of the tt production cross section in the dilepton
channel in pp collisions at√s =7 TeV”, JHEP 11 (2012) 067,
doi:10.1007/JHEP11(2012)067, arXiv:1208.2671.
[55] G. D’Agostini, “A multidimensional unfolding method based on Bayes’ theorem”, Nucl. Instrum. Meth. A 362 (1995) 487, doi:10.1016/0168-9002(95)00274-X.
[56] CMS Collaboration, “Determination of jet energy calibration and transverse momentum resolution in CMS”, JINST 6 (2011) P11002,
doi:10.1088/1748-0221/6/11/P11002, arXiv:1107.4277.
[57] NNPDF Collaboration, “Parton distributions for the LHC Run II”, JHEP 04 (2015) 040, doi:10.1007/JHEP04(2015)040, arXiv:1410.8849.
[58] J. Butterworth et al., “PDF4LHC recommendations for LHC Run II”, J. Phys. G 43 (2016) 023001, doi:10.1088/0954-3899/43/2/023001, arXiv:1510.03865.
[59] M. Cacciari et al., “The tt cross-section at 1.8 TeV and 1.96 TeV: A study of the systematics due to parton densities and scale dependence”, JHEP 04 (2004) 068,
doi:10.1088/1126-6708/2004/04/068, arXiv:hep-ph/0303085.
[60] S. Catani, D. de Florian, M. Grazzini, and P. Nason, “Soft gluon resummation for Higgs boson production at hadron colliders”, JHEP 07 (2003) 028,
doi:10.1088/1126-6708/2003/07/028, arXiv:hep-ph/0306211.
[61] E. Gross and O. Vitells, “Trial factors or the look elsewhere effect in high energy physics”, Eur. Phys. J. C 70 (2010) 525, doi:10.1140/epjc/s10052-010-1470-8,
arXiv:1005.1891.
[62] M. Guzzi, K. Lipka, and S.-O. Moch, “Top-quark pair production at hadron colliders: differential cross section and phenomenological applications with DiffTop”, JHEP 01 (2015) 082, doi:10.1007/JHEP01(2015)082, arXiv:1406.0386.
[63] N. Kidonakis, “NNNLO soft-gluon corrections for the top-quark pTand rapidity
distributions”, Phys. Rev. D 91 (2015) 031501, doi:10.1103/PhysRevD.91.031501,
arXiv:1411.2633.
[64] L. A. Harland-Lang, A. D. Martin, P. Motylinski, and R. S. Thorne, “Parton distributions in the LHC era: MMHT 2014 PDFs”, Eur. Phys. J. C 75 (2015) 204,
doi:10.1140/epjc/s10052-015-3397-6, arXiv:1412.3989.
[65] B. D. Pecjak, D. J. Scott, X. Wang, and L. L. Yang, “Resummed differential cross sections for top-quark pairs at the LHC”, Phys. Rev. Lett. 116 (2016) 202001,
doi:10.1103/PhysRevLett.116.202001, arXiv:1601.07020.
[66] M. Czakon, D. Heymes, and A. Mitov, “High-precision differential predictions for top-quark pairs at the LHC”, Phys. Rev. Lett. 116 (2016) 082003,
A
Tables of differential tt cross sections at the particle level
Table 7: Normalized differential tt cross sections with statistical and systematic uncertainties at the particle level as a function of plep
T . The factor given in the last column applies to the values
of the normalized cross section and the statistical and systematic uncertainties in that row.
pTlep [GeV] (1/σ)(dσ/dpTlep) stat syst factor
[20, 30] 2.00 0.04 0.03 ×10⁻² [30, 40] 1.84 0.04 0.03 ×10⁻² [40, 60] 1.38 0.02 0.01 ×10⁻² [60, 80] 8.12 0.17 0.11 ×10⁻³ [80, 120] 3.12 0.07 0.09 ×10⁻³ [120, 180] 6.79 0.29 0.25 ×10⁻⁴ [180, 400] 5.01 0.44 0.33 ×10⁻⁵
Table 8: Normalized differential tt cross sections with statistical and systematic uncertainties at the particle level as a function of pTjet. The factor given in the last column applies to the values of the normalized cross section and the statistical and systematic uncertainties in that row.
pjet
T [GeV] (1/σ)(dσ/dpTjet) stat syst factor
[30, 50] 1.42 0.03 0.07 ×10⁻²
[50, 80] 1.12 0.02 0.02 ×10⁻²
[80, 130] 5.24 0.11 0.18 ×10⁻³
[130, 210] 1.18 0.04 0.06 ×10⁻³
[210, 500] 8.2 0.71 2.1 ×10⁻⁵
Table 9: Normalized differential tt cross sections with statistical and systematic uncertainties at
the particle level as a function of ptT. The factor given in the last column applies to the values
of the normalized cross section and the statistical and systematic uncertainties in that row. pt
T[GeV] (1/σ)(dσ/dptT) stat syst factor
[0, 65] 4.14 0.12 0.13 ×10⁻³ [65, 125] 5.73 0.16 0.23 ×10⁻³ [125, 200] 3.20 0.10 0.13 ×10⁻³ [200, 290] 1.08 0.05 0.09 ×10⁻³ [290, 400] 3.42 0.27 0.54 ×10⁻⁴ [400, 550] 7.9 1.5 2.6 ×10⁻⁵
Table 10: Normalized differential tt cross sections with statistical and systematic uncertainties
at the particle level as a function of yt. The factor given in the last column applies to the values
of the normalized cross section and the statistical and systematic uncertainties in that row.
yt (1/σ)(dσ/dyt) stat syst factor
[−2.5,−1.6] 5.80 0.34 0.23 ×10⁻² [−1.6,−1.0] 2.02 0.08 0.08 ×10⁻¹ [−1.0,−0.5] 2.95 0.10 0.07 ×10⁻¹ [−0.5, 0.0] 3.45 0.11 0.05 ×10⁻¹ [0.0, 0.5] 3.57 0.11 0.11 ×10⁻¹ [0.5, 1.0] 2.98 0.10 0.05 ×10⁻¹ [1.0, 1.6] 2.12 0.08 0.08 ×10⁻¹ [1.6, 2.5] 5.71 0.34 0.26 ×10⁻²
Table 11: Normalized differential tt cross sections with statistical and systematic uncertainties at the particle level as a function of pttT. The factor given in the last column applies to the values of the normalized cross section and the statistical and systematic uncertainties in that row.
pttT [GeV] (1/σ)(dσ/dpttT) stat syst factor
[0, 30] 1.01 0.03 0.14 ×10⁻²
[30, 80] 8.16 0.26 0.65 ×10⁻³
[80, 170] 2.34 0.10 0.17 ×10⁻³
[170, 300] 4.81 0.39 0.72 ×10⁻⁴
[300, 500] 7.6 1.3 2.6 ×10⁻⁵
Table 12: Normalized differential tt cross sections with statistical and systematic uncertainties at the particle level as a function of ytt. The factor given in the last column applies to the values of the normalized cross section and the statistical and systematic uncertainties in that row.
ytt (1/σ)(dσ/dytt) stat syst factor
[−2.5,−1.5] 2.57 0.32 0.19 ×10⁻² [−1.5,−1.0] 1.68 0.10 0.07 ×10⁻¹ [−1.0,−0.5] 3.37 0.14 0.04 ×10⁻¹ [−0.5, 0.0] 4.30 0.16 0.11 ×10⁻¹ [0.0, 0.5] 4.60 0.16 0.06 ×10⁻¹ [0.5, 1.0] 3.28 0.14 0.08 ×10⁻¹ [1.0, 1.5] 1.58 0.10 0.07 ×10⁻¹ [1.5, 2.5] 3.35 0.33 0.20 ×10⁻²
Table 13: Normalized differential tt cross sections with statistical and systematic uncertainties at the particle level as a function of Mtt. The factor given in the last column applies to the values of the normalized cross section and the statistical and systematic uncertainties in that row.
Mtt[GeV] (1/σ)(dσ/dMtt) stat syst factor
[300, 400] 3.07 0.13 0.12 ×10⁻³
[400, 500] 3.07 0.15 0.20 ×10⁻³
[500, 650] 1.44 0.08 0.08 ×10⁻³
[650, 1000] 3.85 0.26 0.80 ×10⁻⁴
[1000, 1600] 5.9 0.90 1.6 ×10⁻⁵
Table 14: Normalized differential tt cross sections with statistical and systematic uncertainties
at the particle level as a function of ∆φtt. The factor given in the last column applies to the
values of the normalized cross section and the statistical and systematic uncertainties in that row.
∆φtt[rad] (1/σ)(dσ/d∆φtt) stat syst factor
[0, 1.57] 6.79 0.60 1.04 ×10⁻²
[1.57, 2.61] 2.26 0.14 0.26 ×10⁻¹
[2.61, 3.016] 9.52 0.44 0.71 ×10⁻¹
B
Tables of differential cross section at the parton level
Table 15: Normalized differential tt cross sections with statistical and systematic uncertainties
at the parton level as a function of ptT. The factor given in the last column applies to the values
of the normalized cross section and the statistical and systematic uncertainties in that row. pt
T[GeV] (1/σ)(dσ/dptT) stat syst factor
[0, 65] 4.24 0.11 0.40 ×10⁻³ [65, 125] 6.10 0.13 0.14 ×10⁻³ [125, 200] 3.25 0.08 0.31 ×10⁻³ [200, 290] 9.31 0.37 0.47 ×10⁻⁴ [290, 400] 2.18 0.16 0.22 ×10⁻⁴ [400, 550] 4.8 0.79 1.2 ×10⁻⁵
Table 16: Normalized differential tt cross sections with statistical and systematic uncertainties
at the parton level as a function of yt. The factor given in the last column applies to the values
of the normalized cross section and the statistical and systematic uncertainties in that row.
yt (1/σ)(dσ/dyt) stat syst factor
[−2.5,−1.6] 1.02 0.05 0.03 ×10⁻¹ [−1.6,−1.0] 1.99 0.06 0.05 ×10⁻¹ [−1.0,−0.5] 2.67 0.08 0.06 ×10⁻¹ [−0.5, 0.0] 3.03 0.08 0.04 ×10⁻¹ [0.0, 0.5] 3.11 0.08 0.11 ×10⁻¹ [0.5, 1.0] 2.67 0.08 0.05 ×10⁻¹ [1.0, 1.6] 2.08 0.06 0.10 ×10⁻¹ [1.6, 2.5] 1.00 0.05 0.05 ×10⁻¹