1
Development of Scale-Up Methodologies for
Pharmaceutical Crystallization Processes
Dissertation presented for the Doctor of Philosophy degree in Refining,
Petrochemical and Chemical Engineering
by
Ameessa Viliam Tulcidas
Supervisors: Prof. Fernando Rocha
Dr. Bruno Santos
Dr. Sylwin Pawlowski
ii This work was developed for NORTE-08-5369-FSE-000042, co-financed by FSE (Fundo Social Europeu), under North’s Regional Operational Program (Norte 2020).
i
Acknowledgments
Firstly, I would like to thank my supervisors Prof. Fernando Rocha, Dr. Sylwin Pawlowski and industrial coordinator Dr. Bruno Santos, for the guidance provided. I also would like to acknowledge NORTE2020 for this Ph.D. research grant, since this work was a result of the project Operation NORTE-08-5369-FSE-000042 supported by Norte Portugal Regional Operational Program (NORTE 2020), under the PORTUGAL 2020 Partnership Agreement, through the European Social Fund (ESF). This work was financially supported by project UID/EQU/00511/2019 - Laboratory for Process Engineering, Environment, Biotechnology and Energy – LEPABE funded by national funds through FCT/MCTES (PIDDAC). I would also like to acknowledge the director of this doctoral program, Prof. Fernando Martins, for always being available to solve any grant-related issues.
Major thanks to Rafael Antunes and his R&D Products group members Nuno Torres, Isabel Martins, Margarida Figueiredo, Carmelina Frazão, Sérgio Silva, Sara Sequeira (my dearest SEM images provider), Joana Fernandes, Sara Cardoso (my dearest ex-coworker), Patrícia Serrano and many others who gave me chemical and analytical support.
I would also like to thank Rui Loureiro and the Process Chemistry Development group members for lending me their fume hoods and also giving me the training to operate with the reactors, Huber, FBRM probe and many more: Albertina Dias, Alexandra Vaz, Ana Cruz, André Carlos, António Henriques, Daniel Filipe Santos, Filipe Ataíde, Emília Leitão, Jorge Ferreira, José Pereira, Lucinda Conceição, Maria de Fátima Carvalho, Ricardo Mendonça, Ricardo Rosa, Rui Campos, Sílvia Cecília and many others.
Huge thanks to Miguel Cansado for taking some time from his busy schedule to share knowledge on how to create engaging presentations (this world definitely needs more humble leaders willing to teach and spread knowledge).
Many thanks also to João Bandarra and his Technical Services group for providing help, fume hoods and analytical support: Cláudio Leal, Gilda Lameira, João Rafael (PDG), João Lavrado, Marco António Silva, Paulo Glória, Pedro Borges and anyone I might have forgotten to mention.
Big thanks to Pedro Santos and his group members João Sequeira and Susana Medinas for giving me product and data.
I would also like to express my gratitude to Filipe Neves, Susana Nascimento and the remaining Pilot Plant team members. Especially to Maria Inês Lopes (aka 1000), Margarida Coutinho and Gonçalo Poeiras, for always giving a pat on my back after excessive venting. I must also thank Pilot Plant’s B22
ii
Formulation group for the laughter and friendly environment provided. Will definitely miss José Palma Oliveira aka Palm Olive’s singing.
To my friends and ex-colleagues from the analytical department, a huge thank you for the kind words and positivity shown. Thanks, Lúcia Sousa and Ricardo Gonçalves for the help provided in the analytical field. Huge thanks to António Serôdio for the discussion about particle size. Thanks Catarina Vieira and Inês Silva for injecting my HPLC samples when I lost my access to the software.
I would also like to express gratitude towards all my fellow students and the Innovation team of Hovione.
Last but not the least, I would like to thank my ENGIQ family (Ana, André, Churro, Fred, Patrícia, Pedro and Tiago) for the discussions and gatherings; Diogo for the countless emotional support given and my family.
iii
Abstract
The scale-up of crystallization processes is extremely challenging. Increase of equipment size leads to a decrease of surface area to volume ratio and development of temperature and/or concentration gradients, which, in turn, can affect the API (active pharmaceutical ingredients) crystals’ properties (e.g. particle size distribution (PSD), crystal habit, etc.). Challenges such as the formation of fines and consequent loss of yield are reported at scale-up and therefore it becomes critical to understand and control the crystallization processes in order to obtain API with the desired properties.
This thesis aims at a better understanding of pharmaceutical crystallization processes and the development of methodologies that can help overcome the previously mentioned challenges. Hence, two case studies were considered, which embrace challenging crystallization techniques: evaporative crystallization followed by cooling and anti-solvent crystallization.
The first case study highlights the relevant aspects to be taken into consideration in the early stages of the development of a crystallization process. It reports the attempts in modifying the crystal habit and increasing the particle size of an API in a laboratory-scale evaporative followed by cooling crystallization. Ostwald ripening phenomenon was induced while monitoring the particle dimensions and population throughout the time with a Process Analytical Technology (PAT) tool. The solubility and supersolubility curves were determined to obtain the Metastable Zone Width (MSZW) and to further quantify the supersaturation attained in the process. Experiments with lower supersaturation and seeding were performed to attempt crystal growth, using the desired process solvent. Additionally, polymorphic stability, crystal habit, and size assessment studies were carried out in a different solvent system. It was found that working at a temperature above the melting point of the API seems to lead to the most stable polymorph, with a different crystal habit, size, and an acceptable purity, as desired.
The second case study addresses an anti-solvent crystallization system of an API with strict particle size requirements. Unlike the former case study, this case has a well-defined solvent system and crystallization technique, yet there are some variables needed to be further controlled in order to obtain the desired product. Therefore, statistical modeling was applied to assess the impact of mixing parameters such as suspension height to clearance ratio (H/C), percentage of filling volume in the reactor (%Volume), power per volume (PV) and tip speed (TS) on the particle size distribution. A statistical methodology was also proposed for the scale-up of anti-solvent crystallization processes by using models developed with data obtained in scale-down experiments, which predict the particle size and were validated with batches from the production scale. Furthermore, the models developed herein were used to estimate design spaces through Monte-Carlo simulations, indicating the operating conditions that lead to a higher probability of success, i.e., probability of obtaining API with particle size distribution parameters within specification.
Lastly, some guidelines were provided based on the actions taken in this work that allowed attaining the desired product properties and thus, can be helpful to follow in the development of similar crystallization systems.
iv
Resumo
O scale-up de processos de cristalização é extremamente desafiante, dado que à medida que a escala aumenta, o rácio entre a área superficial e volume diminui, e os gradientes de temperatura e/ou concentração tornam-se significativos, o que por sua vez, poderá impactar determinadas propriedades dos cristais de API (ingrediente farmacêutico activo), como por exemplo a distribuição do tamanho de partícula, o hábito cristalino, entre outros. São reportados, no scale-up, desafios como a formação de finos e a consequente perda de rendimento e, como tal, é crítico compreender e controlar o processo de cristalização de forma a produzir um API com as propriedades desejadas.
O objetivo da presente tese consiste em adquirir conhecimento relativamente a processos de cristalização e desenvolver metodologias que facilitem a minimização da ocorrência de desafios no futuro. Por conseguinte, atentou-se particulamente na fase de desenvolvimento do processo (escala laboratorial). Com este intuito, consideraram-se dois casos de estudo da Hovione, que abrangem técnicas de cristalização exigentes: cristalização por evaporação seguida de arrefecimento e cristalização por anti-solvente.
O primeiro caso de estudo destaca os aspetos relevantes a serem considerados numa fase embrionária do desenvolvimento de processos de cristalização. Este reporta as tentativas de alterar o hábito cristalino e aumentar o tamanho da partícula de um API num processo de cristalização por evaporação seguida de arrefecimento, na escala laboratorial. Induziu-se o fenómeno de Ostwald ripening durante a monitorização da dimensão e população das partículas ao longo do processo por meio de uma ferramenta PAT (Tecnologia Analítica de Processo). Determinou-se a curva de solubilidade e curva de supersolubilidade do produto para estimar a zona metastável (MSZW) e posteriormente quantificar a sobressaturação atingida no processo. Adicionalmente, foram testadas experiências a baixa sobressaturação e com semente de forma a promover o crescimento dos cristais, no solvente de processo (etanol). Estudos relativos à avaliação da estabilidade polimórfica, hábito cristalino e tamanho de partícula foram executados usando um sistema distinto de solventes (heptano:1,2-dimetoxietano). Observou-se que operando a uma temperatura acima da temperatura de fusão do API leva à cristalização de produto na sua forma mais estável, com um hábito cristalino e tamanho diferentes e com uma pureza aceitável, tal como desejado.
O segundo caso de estudo, distintamente do caso de estudo anterior, possui um sistema de solventes e uma técnica de cristalização bem consolidada, porém, requer um estudo mais aprofundado de certas variáveis para se obter o produto desejado. Este, por sua vez, aborda uma técnica de cristalização por anti-solvente, em que é necessário obter um API cuja distribuição do tamanho de partícula cumpra uma especificação bastante restrita. Nesse sentido, recorreu-se à modelação estatística para avaliar o impacto de parâmetros de mistura como o rácio entre a altura da suspensão e clearance (H/C), percentagem de volume ocupado no reactor (%Volume), potência aplicada por unidade de volume (PV) e tip speed (TS) na distribuição do tamanho de partícula. Propôs-se uma metodologia estatística para o scale-up de processos de cristalização por anti-solvente, que prevê o
v
tamanho de partícula com base em modelos desenvolvidos com dados de experiências de scale-down e validados com dados de lotes na escala de produção.
Complementarmente, os modelos desenvolvidos ao longo do doutoramento foram utilizados para estimar janelas operacionais através de simulações Monte-Carlo, indicando as condições operatórias que levam a uma maior probabilidade de sucesso, isto é, maior probabilidade de produzir API com uma distribuição de tamanho de partícula que cumpra a especificação.
Para finalizar, sugeriram-se algumas linhas orientadoras, com base nas acções tomadas neste trabalho que levaram à obtenção de um produto com as propriedades físicas desejadas, e cuja aplicação poderá vir a ser útil em processos de cristalização similares.
vi
Table of Contents
Introduction ... 1 1.1. Motivation ... 1 1.2. Thesis contributions ... 2 Publications ... 2 Oral communications ... 2 1.3. Thesis outline ... 3 References ... 4 State-of-the-art ... 52.1. Crystallization – crystalline state and applications ... 5
2.1.1. Crystallization definition and crystalline state ... 5
2.1.2. Applications ... 6
2.1.3. Crystallization in the Pharmaceutical Industry ... 7
2.2. Crystallization principles and techniques ... 9
2.3. Kinetic parameters ... 12
2.3.1. Nucleation ... 12
2.3.2. Crystal growth ... 15
2.4. Scale-up of pharmaceutical crystallization processes ... 19
2.4.1. Batch crystallizers ... 19
2.4.2. Scale-up foresight ... 20
References ... 23
Characterization at lab-scale of crystal habit, size and polymorphic stability of an API… ....26
3.1. Scope... 26
3.2. Introduction ... 27
3.3. Experimental methods and materials ... 28
3.3.1. Particle size monitoring with FBRM probe ... 28
3.3.2. Solubility and metastable zone width determination of the API in ethanol ... 30
vii
3.3.4. Cooling crystallization – Seeding experiment... 32
3.3.5. New solvents’ system approach and polymorphic stability studies ... 33
3.4. Results and discussion ... 35
3.4.1. Particle size monitoring with FBRM probe ... 35
3.4.2. Solubility and metastable zone width determination of the API in ethanol ... 38
3.4.3. Cooling crystallization – Lower supersaturation ... 39
3.4.4. Cooling crystallization – Seeding experiment... 40
3.4.5. New solvents’ system approach and polymorphic stability studies ... 42
3.5. Conclusions ... 57
References ... 59
Characterization at lab-scale of the influence of the mixing conditions on the particle size in anti-solvent crystallization of an API ...61
4.1. Scope... 61
4.2. Introduction ... 62
4.3. Experimental methodology ... 63
4.3.1. Materials and experimental procedure ... 63
4.3.2. Statistical analysis ... 65
4.4. Results and discussion ... 65
4.4.1. Impact of H/C and PV on the PSD ... 65
4.4.2. Impact of nucleation rate on the PSD ... 69
4.5. Conclusions ... 70
References ... 71
Statistical methodology for scale-up of an anti-solvent crystallization of an API ...73
5.1. Scope... 73
5.2. Introduction ... 74
5.3. Materials and experimental procedure ... 75
5.3.1. Anti-solvent crystallization procedure ... 75
5.3.2. Models’ development ... 76
5.4. Results and discussion ... 80
5.4.1. Collinearity assessment... 80
5.4.2. MLR modelling ... 80
viii
5.5. Conclusions ... 85
References ... 85
Quality by statistical control: Probability of success of having particle size distribution within specification in an anti-solvent crystallization ...88
6.1. Scope... 88
6.2. Introduction ... 89
6.3. Design space development methodology ... 90
6.3.1. Preliminary design space ... 90
6.3.2. Design space comprising the probability of success ... 90
6.4. Results and discussion ... 94
6.4.1. Preliminary design space ... 94
6.4.2. Design space comprising the probability of success ... 96
6.5. Conclusions ... 100
References ... 100
Final Remarks ...102
7.1. Conclusions ... 102
7.1.1. Characterization at lab-scale of crystal habit, size and polymorphic stability of an API ... 102
7.1.2. Characterization at lab-scale of the influence of the mixing conditions on the particle size in anti-solvent crystallization of an API ... 103
7.1.3. Statistical methodology for scale-up of an anti-solvent crystallization of an API ... 104
7.1.4. Quality by statistical control: Probability of success of having particle size distribution within specification in an anti-solvent crystallization ... 104
7.2. Guidelines for similar process challenges ... 105
ix
List of Figures
Figure 2.1. Surface structure of a growing crystal. ... 16
Figure 2.2. Two-dimensional nucleus formation on a crystal surface [30]. ... 16
Figure 2.3. Development of a spiral growth from a screw dislocation of a SnS2 crystal [31]. ... 17
Figure 2.4. Batch laboratorial scale crystallizer [44]. ... 19
Figure 2.5. Agitated batch pilot plant crystallizer [41]. ... 20
Figure 2.6. The SEM of sodium sulphate crystals under different cooling rate and agitation rate (a) 300 rpm and (b) 900 rpm [35]. ... 21
Figure 2.7. The effect of the polarity of the solvents on the crystal habit [30]. ... 22
Figure 3.1. The effect of polarity of solvents on the crystal habit of hydrocortisone [9]. ... 28
Figure 3.2. FBRM probe’s components and features [13]. ... 29
Figure 3.3. Process block flow diagram. ... 30
Figure 3.4. System of 50 mL reactors coupled with turbidity and temperature probes and impeller. ... 31
Figure 3.5. Experimental setup for the cooling crystallization experiment. ... 32
Figure 3.6. Experimental process flow for polymorphic stability tests. ... 33
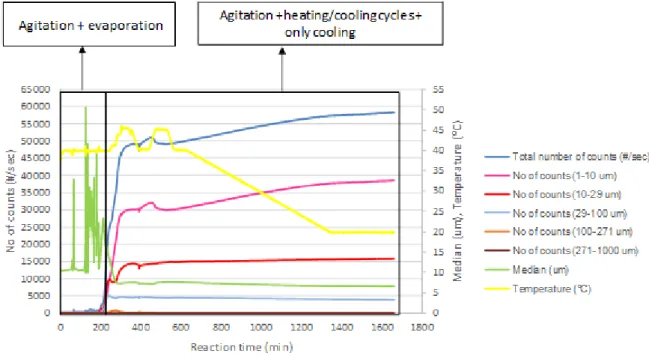
Figure 3.7. FBRM data acquired throughout the time during evaporation and subsequent cooling. .... 35
Figure 3.8. Chord length distribution obtained from raw data of FBRM in each step of the process. ... 36
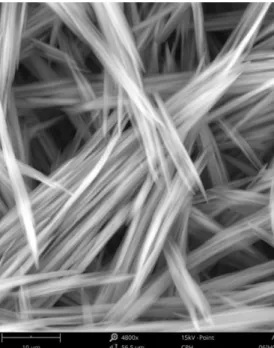
Figure 3.9. Needles of API obtained after evaporation and cooling, observed using the SEM technique (Zoom x4800). ... 37
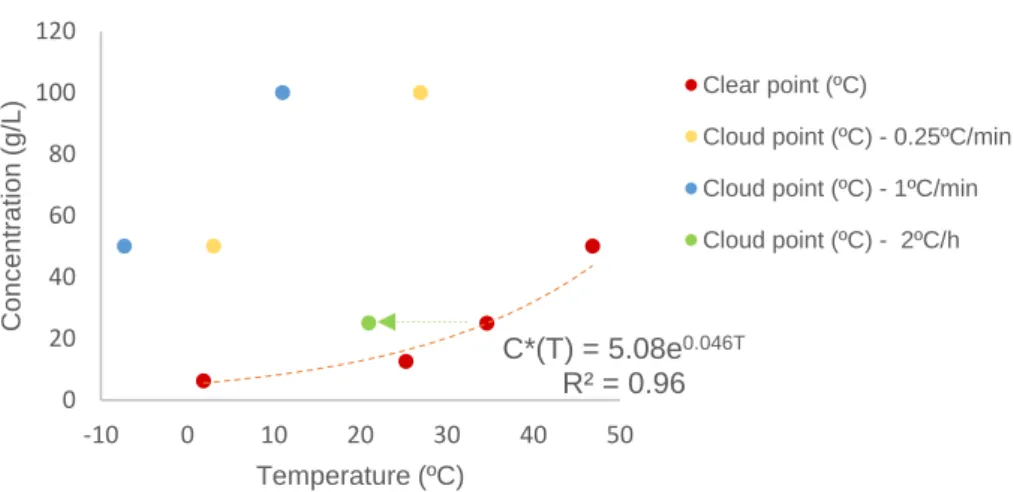
Figure 3.10. Measured solubility curve (clear points) and cloud points obtained at a cooling rate of 0.25ºC per min and 1ºC per min of the API in ethanol. ... 38
Figure 3.11. Solubility curve (clear points) and cloud points detected at different cooling rates for each concentration. ... 39
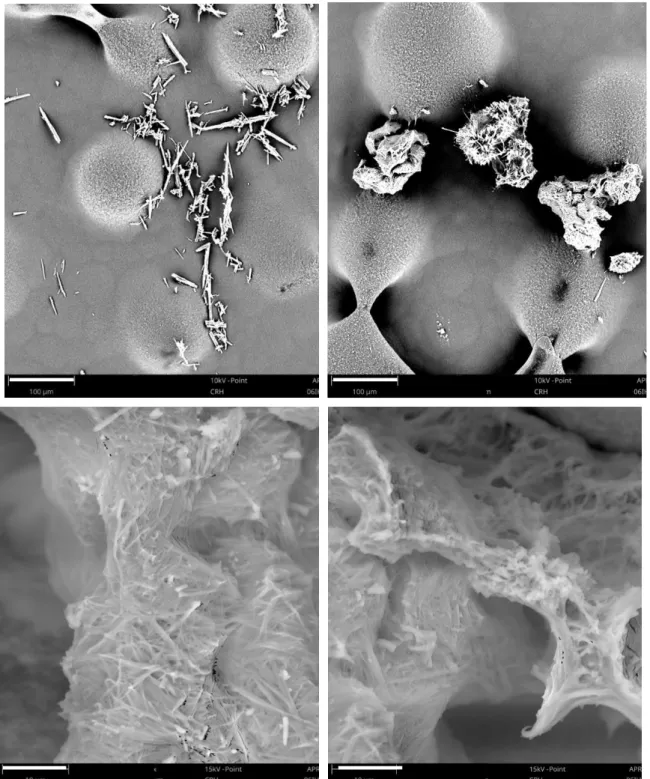
Figure 3.12. Morphology of the crystals obtained during cooling crystallization (supersaturation ratio of 2.0) by SEM analysis (zoom of 480x and 4800x respectively). ... 40
Figure 3.13. Metastable zone width obtained when using a cooling rate of 1 ºC per minute and the seeding point (orange spot). ... 40
Figure 3.14. Morphology of the crystals obtained after the seeding experiment (top - zoom 480x; bottom – zoom 4800x) by SEM analysis. ... 41
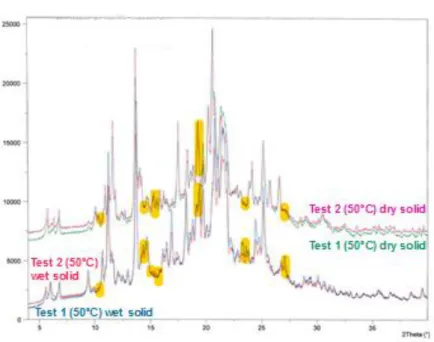
Figure 3.15. XRPD diffractograms of wet and dry solids of tests 1 and 2. ... 43
Figure 3.16. XRPD diffractograms' overlay of wet solid from test 1 and form XII obtained externally. . 44
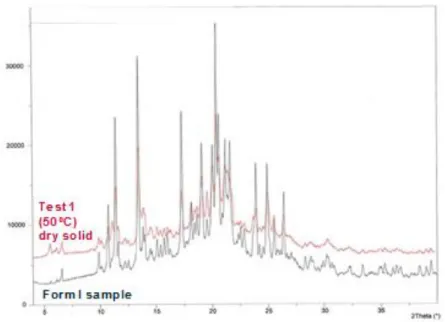
Figure 3.17. XRPD diffractograms' overlay of dry solid from test 1 and form I. ... 45
Figure 3.18. Overlay of the diffractograms of wet and dry solids of test 3 and form I. ... 45
Figure 3.19. Overlay of the diffractograms of the wet and dry solids from test 4 with form XII obtained externally. ... 46
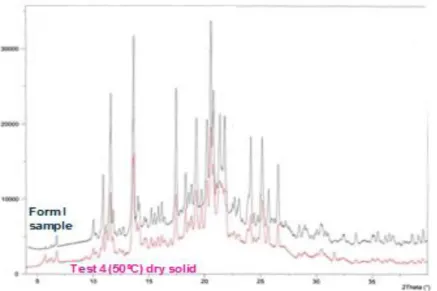
Figure 3.20. Overlay of the diffractograms of the dry solids from test 4 with one of form I. ... 46 Figure 3.21.Overlay of the diffractogram of wet solids of test 5 with the form XII obtained externally. 47
x
Figure 3.22. Overlay of the diffractogram of wet solids of test 6 with a standard diffractogram of form I. ... 47 Figure 3.23. Overlay of test 6 dry solids’ diffractogram with form I. ... 48 Figure 3.24. Comparison of the morphology of the crystals before and after the slurry tests 1 and 2 by SEM (Zoom 4800x). ... 52 Figure 3.25. Comparison of the morphology of the crystals before and after the slurry test 3 by SEM (Zoom 4800x). ... 53 Figure 3.26. Comparison of the morphology of the crystals before and after the slurry test 4 by SEM (Zoom 4800x). ... 53 Figure 3.27. Comparison of the morphology of the crystals before and after the slurry test 5 by SEM (Zoom 4800x). ... 53 Figure 3.28. Comparison of the morphology of the crystals before and after the slurry test 6 by SEM (Zoom 4800x). ... 54 Figure 3.29. Thicker crystals obtained when performing the heating step at 80ºC in the slurry test 6 (Zoom 2000x). ... 55 Figure 3.30. Comparison of the crystal habit obtained in the ethanol evaporative crystallization and test 6 performed with 1,2-dimethoxyethane (Zoom x4800). ... 57 Figure 4.1. Top and vertical view of the reactor used in the experiments. ... 64 Figure 4.2. Experimental conditions of H/C, stirring speed (and the corresponding power per volume) used during the anti-solvent crystallization experiments at lab-scale. Filled dots represent the experiments performed. ... 64 Figure 4.3. Regression coefficient values and respective standard deviation, for each output variable and the comparison between the modelled and experimental data. ... 67 Figure 4.4. Comparison of the PSD parameters predicted by the leave-one-out method with the experimental PSD values. ... 68 Figure 4.5. Relationship between normalized particle size parameters (Dv50 and Dv90) and normalized nucleation rate. ... 69 Figure 4.6. SEM images of the morphology of the API crystals obtained after drying (Zoom of 440x and 4800x, respectively). ... 70 Figure 5.1. Experimental conditions used during the anti-solvent crystallization experiments at lab-scale. ... 76 Figure 5.2. Statistical methodology employed to develop statistical models and evaluate the influence of the mixing conditions on the particle size distribution parameters. ... 79 Figure 5.3. Predictors’ regression coefficients, and their respective errors, of models predicting PSD parameters (Dv10, Dv50 and Dv90). The predictors’ sets were a) %volume and power per volume (PV); b) %volume and tip speed (TS), respectively. ... 82 Figure 5.4. Training data, validation points and confidence limits of the optimized models with different predictors: a) %volume and PV; b) %volume and TS. Hollow symbols – conditions out of the calibration range. ... 83 Figure 6.1. Methodology followed to obtain a design space comprising the probability of success of obtaining PSD parameters within specification, considering dependent events. ... 93
xi
Figure 6.2. Left: preliminary design space indicating the operating zone where Dv10, Dv50 and Dv90 simultaneously meet the specifications (when I (Dv10, Dv50, Dv90) from Equation 6.2 equals to 1; yellow area). Right: preliminary design space for each PSD parameter Dv10, Dv50 and Dv90. ... 94 Figure 6.3. Preliminary design space depicting the operating zone where Dv10, Dv50 and Dv90 simultaneously meet the specifications, built from the models developed when using %Vol and PV as predictors (left) and %Vol and TS as predictors (right). ... 95 Figure 6.4. Resampled regression coefficients for each models with different set of predictors (H/C – PV, %Vol – PV and %Vol – TS) and the outliers identified as red. Dotted lines are the boundaries (mean value ± 3.standard deviation). ... 96 Figure 6.5. Comparison of the design space quantifying the probability of obtaining Dv10, Dv50 and Dv90 within specification, considering dependent events and the preliminary space (red lines) for each developed model. ... 98 Figure 6.6. Design space depicting the experimental points performed to develop the models (red dots). ... 99
xii
List of Tables
Table 2.1 - The seven crystal systems (from [2]). ... 6 Table 2.2 - Crystal properties controlled by crystallization and their influence on the final drug product (based on [7]). ... 7 Table 3.1 - Operating conditions employed in the polymorphic stability tests. ... 34 Table 3.2 - Summary of the XRPD data obtained in each of the slurry tests. ... 48 Table 3.3 – Melting point, heat of fusion and degradation temperature obtained for the starting material, wet and dry solids for each test, by DSC. ... 49 Table 3.4 - Purity results of the starting material, wet and dry product analyzed by HPLC. ... 50 Table 3.5 – Measurements of length and width of the crystals obtained in each slurry test, using the SEM technique; SM – starting material; DS – dry solid obtained after the slurry test... 56 Table 4.1 – R2 and adjusted R2 of the simple linear and with interaction parameters (optimized) models.
... 66 Table 5.1 - %Volume, power per volume and tip speed conditions from the production batches used to validate the models. ✓ - within the calibration range; ✗ - outside the calibration range. ... 78 Table 5.2 - VIF values obtained for each of the predictor variables when regressing them against each other. ... 80 Table 5.3 – Adjusted R2 of the simple linear and with interaction parameters (optimized) models. .... 81 Table 5.4 – Deviation values obtained for the particle size distribution parameters obtained experimentally in the production batches (industrial-scale) and estimated by the models developed based on lab-scale results. ... 84 Table 6.1 – Models used in this study and the respective adjusted R2. ... 94
Table 7.1 – Summary of some actions taken to overcome certain challenges, based on the conclusions of this thesis. ... 105
1
Introduction
1.1. Motivation
Above 90% of all pharmaceutical products including tablets, aerosols, capsules, suspensions, and suppositories contain the drug in particulate form, generally crystalline [1]. Therefore, it is critical to master and control the crystallization process to produce an API (Active Pharmaceutical Ingredient) or drug product with the desired solid-state characteristics: purity, crystal morphology and particle size distribution (PSD) [2].
The difficulty in capturing the detailed mixing and heat transfer of an industrial scale vessel using a geometrically similar laboratory vessel leads to several problems during the scale-up of crystallization processes. Furthermore, particle size does not scale with the vessel dimensions, nor do the transport properties associated with the particles and suspension. At last but not the least, it is tempting to maintain the specific power input of the agitator in both scales, albeit the power required is often too large and may end up damaging the growing crystals and leading to unwanted secondary nucleation [2].
Challenges such as fines’ formation, undesired crystal form and habit are the most common to befall during the scale-up. These modifications of the crystal properties have a high impact on the downstream unit operations such as filtration, where fine crystals can cause clogging of the porous membrane, which decreases the product yield and delays the process. Drying and milling operations can also be influenced [3]. Moreover, the physical and chemical properties, such as dissolution rate and solubility and consequently the bioavailability of the final drug product can also be affected by the aforementioned properties [4].
For instance, the desired particle size can be attained by controlling the nucleation and growth kinetics. Operating near the supersolubility curve favors spontaneous nucleation and thus, fines’ formation, whereas, the growth of crystals is promoted in regions near the solubility curve. Supersaturation, the driving force of crystallization processes, can be achieved by temperature reduction (cooling), solvent evaporation, anti-solvent addition and precipitation [5]. The latter is commonly used in the pharmaceutical industry. Regularly, a seeding process is also combined with the aforementioned techniques to control the crystal size and form [6]. The zone between the supersolubility curve and the solubility curve is defined as the metastable zone, which is commonly used to understand when nucleation occurs and determine the operation window for crystallization processes. The metastable zone width (MSZW) can be influenced by several process parameters, as for instance, cooling, agitation and evaporation rates as well as the presence of impurities [7] which, in turn, are decisive in the scale-up process.
Consequently, the main goal of this work is to understand two challenging crystallization processes at Hovione and develop methodologies that can help avoid or minimize their occurrence in the future.
2
Moreover, tackling these hindrances can also aid in reducing the financial loss caused by having out of specification batches.
1.2. Thesis contributions
The work developed during this Ph.D. resulted in several scientific contributions.
Publications
- A. Tulcidas, N. M. T. Lourenço, R. Antunes, B. Santos, S. Pawlowski and F. Rocha, “Crystal habit modification and polymorphic stability assessment of a long-acting, β2-adrenergic agonist”,
CrystEngComm, vol. 21, pp. 3460 - 3470, 2019.
- A. Tulcidas, S. Nascimento, B. Santos, C. Alvarez, S. Pawlowski and F. Rocha, “Statistical methodology for scale-up of an anti-solvent crystallization process in the pharmaceutical industry”, Separation and Purification Technology, vol. 213, pp. 56 - 62, 2019.
- A. Tulcidas, B. Santos, S. Pawlowski and F. Rocha, “Quality by statistical control in crystallization - Assessment of mixing conditions and probability of obtaining the desired particle size”, Industrial & Engineering Chemistry Research, vol. 58, pp. 20162 - 20172, 2019.
Oral communications
- "Development of scale-up methodologies for pharmaceutical crystallization processes" at 2nd
Doctoral Congress in Engineering; FEUP; Porto; 8th - 9th June 2017.
- "Impact of mixing conditions on the nucleation rate and particle size of an API in an anti-solvent crystallization" at 13th International Chemical and Biological Engineering Conference (ChemPor
2018); Aveiro; 2nd - 4th October 2018.
- "QbD in pharmaceutical anti-solvent crystallization: probability of obtaining the desired particle size" at 3rd International Congress of Chemical Engineering; Santander, Spain; 19th - 21st June
2019.
- "Crystal habit modification and polymorphic stability assessment of a drug substance" at 3rd
Doctoral Congress in Engineering; FEUP; Porto; 27th - 28th June 2019.
3
1.3.
Thesis outline
The work developed in this thesis is described in seven chapters.
Chapters 1 and 2 provide the motivation and goals of this thesis, as well as the theoretical background regarding crystallization principles.
Chapter 3 presents the relevant aspects to be considered in the early stages of the development of crystallization processes. For that purpose, this chapter addresses a case study, where an API with different crystal habit, size and specific polymorphic form was desired, in order to ease the downstream processes. The crystallization process consisted of an evaporation step followed by cooling, leading to needle-shaped crystals, which are not suitable for further processing steps. This chapter describes the attempts performed until achieving the desired physical properties, from using Process Analytical Technology (PAT) tool to monitor the particle counts and dimensions in-situ, MSZW (Metastable Zone Width) determination for supersaturation quantification, execution of experiments with low supersaturation, to slurry tests with a different mixture of solvents at different operational conditions.
Chapters 4, 5 and 6 are based on a case study of an API obtained through an anti-solvent crystallization process that requires meeting very strict particle size specifications. Unlike the first case study, the latter has a well-defined solvent system and crystallization technique. Nevertheless, some variables needed to be explored further to assess their impact on the particle size of the product. Therefore, Chapter 4 provides an insight into the impact of the clearance and agitation applied during an anti-solvent crystallization on the particle size distribution parameters of the product. Additionally, Chapter 5 focuses on building a statistical methodology that can predict the particle size parameters at an industrial scale using data from scale-down anti-solvent crystallization experiments performed at the laboratory scale. Chapter 6 quantifies the risk, i.e., the probability of obtaining the product within specification when working at certain conditions. Thus, a methodology was developed using the models found in chapters 4 and 5, to build a design space that quantifies the probability of the product meeting the particle size specification, which can be helpful in the development of crystallization processes to avoid operating at conditions that can lead to out-of-specification batches.
Chapter 7 summarizes the main conclusions. Furthermore, some guidelines are provided based on the actions taken in this work that allowed attaining the desired product properties, which can be helpful to follow during the development of similar crystallization systems. Lastly, suggestions for future research are presented.
4
References
[1] P. Shekunov, B. Y.; York, “Crystallization process in pharmaceutical technology and drug delivery design.,” J. Cryst. Growth, vol. 211, no. 1–4, pp. 122–136, 2000.
[2] A. S. Myerson, Handbook of Industrial Crystallization, 2nd ed., no. October. Elsevier Science & Technology Books, 2001.
[3] J. Chen, B. Sarma, J. M. B. Evans, and A. S. Myerson, “Pharmaceutical Crystallization Published as part of the Crystal Growth & Design 10th Anniversary Perspective,” Cryst. Growth Des., vol. 11, pp. 887–895, 2011.
[4] C. Schaefer, C. Lecomte, D. Clicq, A. Merschaert, E. Norrant, and F. Fotiadu, “On-line near infrared spectroscopy as a Process Analytical Technology (PAT) tool to control an industrial seeded API crystallization,” J. Pharm. Biomed. Anal., vol. 83, pp. 194–201, 2013.
[5] W. L. McCabe, J. C. Smith, and P. Harriott, Unit Operations of Chemical Engineering, 5th ed. USA: McGraw-Hill, 1993.
[6] R. Hilfiker, Polymorphism in the Pharmaceutical Industry. Germany: Wiley-VCH, 2006.
[7] G. Zeng, H. Li, S. Huang, X. Wang, and J. Chen, “Determination of metastable zone width and the primary nucleation kinetics of sodium sulfate,” Theor. Found. Chem. Eng., vol. 49, no. 6, pp. 869–876, 2015.
5
State-of-the-art
This chapter introduces the theoretical principles of the crystallization process, such as the crystalline state, applications, kinetics, batch crystallizers and scale-up challenges.
2.1. Crystallization – crystalline state and applications
2.1.1. Crystallization definition and crystalline state
Crystallization is a separation process, which forms pure accurately organized solid structures (crystals) from a liquid homogeneous solution. It is the most preferable operation used when producing heat-sensitive particulate products, requiring less energy consumption and being consequently more economical than, for instance, a distillation process [1].
In a crystalline solid, the motion of molecules, atoms or ions is restricted to oscillations about fixed positions arranged in a regular or lattice pattern. Crystals are rarely spherical in shape. When crystals grow, they form polyhedrons with flat sides and sharp corners if ungoverned by other surfaces such as container walls and other crystals.
Crystals consist of many units, each shaped like the larger crystal. This led to the concept of a space lattice as a regular arrangement of points (molecules, atoms, or ions) such that if a line is drawn between any two points and then extended in both directions, the line will pass through other lattice points with identical spacing. In 1848, Bravais showed that only fourteen space lattices are possible. Based on the symmetry of the three mutually perpendicular axes with respect to their relative lengths (a, b, c) and the angles (α, β, γ) between the axes, these fourteen lattices can be classified into the seven crystal systems (Table 2.1).
Table 2.1 - The seven crystal systems (from [2]).
Crystal system Space Lattices Length of axes Angles between axes
Cubic (regular)
Simple cubic Body-centered cubic Face-centered cubic
a = b = c a = β = γ = 90º Tetragonal Square prism
Body-centered square prism a = b < c a = β = γ = 90º Orthorhombic Simple orthorhombic Body-centered orthorhombic Base-centered orthorhombic Face-centered orthorhombic a ≠ b ≠ c a = β = γ = 90º
6
Table 2.1 (Cont.) - The seven crystal systems (from [2]).
Crystal system Space Lattices Length of axes Angles between axes
Cubic (regular)
Simple cubic Body-centered cubic Face-centered cubic
a = b = c a = β = γ = 90º Tetragonal Square prism
Body-centered square prism a = b < c a = β = γ = 90º Orthorhombic Simple orthorhombic Body-centered orthorhombic Base-centered orthorhombic Face-centered orthorhombic a ≠ b ≠ c a = β = γ = 90º
Monoclinic Simple monoclinic
Base-centered monoclinic a ≠ b ≠ c a = γ = 90º β ≠ 90º Rhombohedral (trigonal) Rhombohedral a = b = c a = β = γ ≠ 90º Hexagonal Hexagonal a = b ≠ c a = β = 90º γ ≠ 90º Triclinic Triclinic a ≠ b ≠ c a ≠ β ≠ γ ≠ 90º 2.1.2. Applications
Crystallization is a widely solid-liquid separation process employed in several industries, from agrochemicals, food, petrochemical to pharmaceuticals [2], [3].
Xu et al. [4] simultaneously recovered potassium and phosphorous, from synthetic and real urine, by crystallization of magnesium-potassium-phosphate-hexahydrate, for nutrient recycling which is imperatively necessary for countries that depend strongly on imported potassium fertilizers.
In the food industry, crystallization of sugars is controlled to give the desired textural properties of, for example, hard candies or fondant icing [5].
Curiously, crystallization is also researched in the petrochemical field to avoid the formation of n-paraffin wax crystals, which in turn, clog fuel filters and cease the fuel flow to the engine, leading diesel engines to operate ineffectively [6].
Regarding the pharmaceutical industry, crystallization is widely used during the intermediate and final stages of purification and separation, resulting in a solid intermediate or API.
Detailed information about the crystallization process in the pharmaceutical industry is described in the following section.
7
2.1.3. Crystallization in the Pharmaceutical Industry
Shekunov and York [7] stated that above 90% of all pharmaceutical products including tablets, aerosols, capsules, suspensions, and suppositories contain the drug in particulate form, generally crystalline.
Consequently, it is critical to master and control the crystallization process to produce an API or final product with the desired solid-state characteristics: purity, crystal form and morphology, particle size distribution (PSD), density and flowability [2]. These properties translate into a high impact on the downstream unit operations such as filtration, where fine crystals can cause clogging of the porous membrane, which decreases the product yield and delays the process. Drying and milling operations can also be influenced [8]. Moreover, the physical and chemical properties, such as dissolution rate, solubility and consequently the bioavailability of the final drug product can also be affected by the aforementioned properties [9]. Table 2.2 presents the most relevant solid-state parameters and their subsequent influence on the final drug product.
Table 2.2 - Crystal properties controlled by crystallization and their influence on the final drug product (based on
[7]).
Solid-state properties Effect on final drug product
Structural
Crystallinity (amorphous or
semi-crystalline form) Physical and chemical stability Polymorphs Hygroscopicity
Solvates (hydrates) Solubility profile and dissolution rate Salts All aspects of processing (milling, wet granulation,
oven drying, compaction) Crystal defects
Dimensional
Particle size distribution Processing behaviour: bulk density, agglomeration, flow/rheology, compaction
Particle morphology Particle permeability/adsorption Particle surface structure Bioavailability (drug absorption)
Consistency and uniformity of dosage Chemical
Impurities, residual solvents,
decomposition products Toxicity
Chiral forms and chiral separation Chemical, physical and enantiomeric stability Mechanical
Brittleness Milling and tableting behaviour Fracture stress
Indentation hardness Stress/strain relaxation
Electrical Electrostatic charge distribution Agglomeration and flow properties
The physical and chemical stability of the drug product is linked to the polymorphism (internal structure of the crystal), as amorphous solids are less stable chemically. These are also more hygroscopic since the irregular shape of the powder creates a high surface area, which attracts water
8
molecules. The physical stability of hydrates and anhydrous forms strongly depends upon the relative humidity and/or temperature of the environment. Transitions from one form to another occur as a consequence of variations in storage conditions or technological treatments [10]. For instance, milling can impart a significant amount of energy on a solid, and could potentially lead to a full or partial polymorphic conversion or generation of an amorphous substance (or at least a degree of amorphous content). Amorphous forms, being metastable, can, in turn, reconvert to a crystalline state, which may differ from the originally desired product. Additionally, during wet granulation ‒ a step that often precedes the production of tablets ‒ the API is exposed to a solvent (water or an organic solvent with low toxicity, such as ethanol) and is once more prone to undergoing solvent-mediated transformations. Exposure to humidity can create similar conditions that can lead to hydrate formation. During compaction, unstable polymorphs can convert to the stable form, a fact that can be attributed to the energy applied in the process. The extent of transformation is dependent on the zone of the tablet, the pressure applied, the compression temperature and the particle size of the API powder [11].
The enantiomeric stability of the drug is related to the fact that one isomer may produce the desired therapeutic activities, whereas the other may be inactive or produce unwanted effects [12].
Most of the pharmaceutical powders are dielectric materials and are often unavoidably charged during the manufacturing process due to interparticle and particle-wall collisions. Electrostatic charges of both positive and negative polarities give rise to attractive or repulsive electrostatic forces between the individual particles. As a result, electrostatic charging may cause the agglomeration or segregation of particles during powder dispersion, transport, and other handling processes. Electrostatic charging also has a significant effect on powder blending performance. For example, it was found that the total adhesion forces between the API and excipients decreased with the charge decay during storage [13].
Furthermore, pharmaceutical industries deal with a fast-paced environment, resulting from the excessive pressure to improve process efficiency and reduce time to launch the drug product into the market. Improvements in the process efficiency are always necessary for the manufacture of generic drugs and when large quantities of drugs are needed to cure life-threatening diseases. Additionally, reducing time to market as soon as possible extends the period before patent expiration [14].
According to Myerson [2], several common hurdles are encountered in the crystallization process in the pharmaceutical field, such as:
The control of supersaturation and particle size distribution in a batch crystallizer;
The effective use of seed – Seeding can have two main goals such as, promoting the growth of crystals and controlling particle properties, particularly, polymorphism and particle size distribution. The selection and preparation of the seed, the point of addiction and the relation between the amount used (0.1 – 1 wt% of the solute) and the proceeding of the crystallization, play a determining role for the success of seeding [15];
Identification and retention of the most stable polymorphic form - Polymorphs are essentially different crystalline forms of a solid resulting from different crystal packing of the same molecules or ions. Since polymorphs represent distinct solid phases, their physical properties
9
such as, for instance, solubility and dissolution rate, also differ [16]. Since the molecules are arranged differently in the different polymorphs, it is possible to have different portions or functional groups on the molecule exposed at the surfaces at the crystal. These differences, especially when involving hydrogen bonding groups, can cause the crystal to interact differently with solvents and therefore change the solubility of the drug [17]. Problems encountered range from sudden unexpected inability to produce reliably a form that has been used for pivotal clinical studies to variations in the drug product properties due to seemingly random changes of the solid form during processing or storage [18]. For instance, 2 years after the launch of the first Ritonavir product, a drug used to treat HIV-1 infections, several batches failed dissolution specifications due to the presence of a new thermodynamically stable form II having ~50% solubility of the reference form. This forced the manufacturer to withdraw the original formulation from the market and perform a new reformulation of the product [10].
One other important benefit of understanding the various polymorphs and methods of preparation of different polymorphs is that polymorphs are patentable. This knowledge may thus provide commercial benefits for the organization [17].
Efficient measurement of solubility in multiple solvent systems to maximize purification and yield;
Therefore, to comprehend the aforementioned hindrances, the solubility and supersaturation degree, nucleation and growth kinetics, batch crystallizers and factors governing crystal purity, habit and morphology are under the main scrutiny to achieve the optimal process and the desired specifications. It is necessary to comprehend the complex process that is crystallization.
2.2. Crystallization principles and techniques
To promote crystallization, two primary particle formation processes are necessary: nucleation - the birth of new crystals and their growth [19]. The relation between the nucleation rate and crystal growth rate influences relevant product properties, for instance, product crystal size and size distribution (fast nucleation translates into small-sized crystals). The growth conditions affect the crystal shape, regarding the solvent used or the presence of impurities. The growth rate also has a strong influence in the purity of the crystals, for example, a fast growth promotes the formation of liquid inclusions in the crystal [20]. To meet the desired crystal properties, crystallization thermodynamics including solubility and metastable zone width should be understood.
Supersaturation is the driving force of the crystallization process. According to Myerson [2], a supersaturated solution is defined as a solution in which the solute concentration exceeds the equilibrium (saturation) solute concentration, at a given temperature. Supersaturation, is often expressed, for an ideal solution, as a concentration difference ∆𝑐:
10 and as a ratio of concentrations, 𝑆:
𝑆 = 𝑐
𝑐∗ (2.2)
where 𝑐 is the concentration and 𝑐∗ is the saturation concentration, respectively.
A saturated solution is a solution in which the solute and solvent are in equilibrium at a given temperature [21]. Saturation can be represented by a curve plotting concentration versus temperature (solubility or saturation curve) since it is mainly dependent on the latter [3].
Between the supersolubility and solubility curves, there is a metastable zone, which provides a region of driving force: supersaturation [22]. The solubility curve can be determined accurately experimentally. On the other hand, the position of the supersolubility curve is uncertain, due to its dependence on factors such as the rate of supersaturation generation, the degree of agitation and the presence of crystals or impurities. In the stable unsaturated zone, crystallization is impossible to occur, whereas in the metastable zone, the nucleation is unlikely but growth is possible. Above the supersolubility curve, nucleation of small nuclei, invisible to the naked eye, occurs spontaneously [21], [23].
According to Myerson [2] the effect of size on particle solubility can be expressed by Gibbs-Thomson (Ostwald-Freudlinch) (Equation 2.3):
𝑟 = 𝛽 𝑉𝜎𝑠 𝑘𝐵 𝑇 𝑙𝑛(𝑆)
(2.3)
Where 𝑟 is the particle radius, 𝛽 is the shape factor available in the literature, 𝑉 is the volume of the crystals (m3), 𝜎
𝑠 is the specific surface energy of solid particles (J/m2), 𝑘𝐵 is the Boltzmann constant
(1.346 x 10⁻²³ J/K), 𝑇 is the temperature (K) and 𝑆 is the supersaturation ratio given by Equation 2.2.
Particles have different dissolution rates based on their size when present in a suspension of particles with a size distribution. This difference in solubility results in the small particles dissolving and depositing on the larger particles and therefore increase the average crystal size. This process is called Ostwald ripening and it is important in processes where crystallization is rapid and crystal sizes are small [2].
Supersaturation can be achieved by the following methods [24]: cooling, evaporation, anti-solvent and precipitation (reactive crystallization).
Temperature reduction (cooling)
Cooling is applied when the solubility of the solute increases strongly with the temperature, which is the case of inorganic salts and organic substances. This technique turns a saturated solution into a supersaturated by simple cooling. Normally, the cooling method complements other techniques such as evaporation or anti-solvent addition, in order to achieve higher yields [16].
11 Solvent evaporation or evaporative crystallization
This method is used when the solute solubility is relatively independent of temperature, as is the case of common salt. Supersaturation is attained by evaporating a portion of the solvent [2].
Normally, in pharmaceutical applications, this technique is often combined with cooling crystallization to increase the yield of the product, usually applying a partial vacuum to promote evaporation. In evaporative crystallization, crystals are sometimes observed to form preferentially near the surface of the solution, due to a higher local concentration of solute. The meniscus of a solution can also have geometry favoring higher evaporation rates, with crystals then forming at the contact line with the crystallization vessel [11].
Anti-solvent addition (salting out)
This technique is employed when the solubility of the solute is intensely high in a certain solvent and neither cooling nor evaporation is desirable. It consists of adding a third component, which may form a mixed solvent with the original solvent, reducing significantly the solubility of the solute. The solubility decreases with anti-solvent addition and the metastable zone width will depend primarily on the anti-solvent addition rate [16].
New approaches include, for instance, using gas anti-solvent such as supercritical carbon dioxide to produce high purity anthracene from a highly contaminated feed. The solubility of the impurities was significantly reduced and therefore salted out by the introduction of the supercritical fluid. Similar gas anti-solvent procedures seem to be advantageous in the separation of isomers from solution. Supercritical carbon dioxide has also been used to separate essentially pure β-carotene from carotene oxidation products [25].
Precipitation (reactive crystallization)
Reactive crystallization occurs where two compounds react in solution to give a product that is less soluble than the reactants from which it is formed. Supersaturation is generated by the formation of the new product, and the rate at which it develops is determined by the rate of reaction and the solubility of the product species relative to the reactants and the conditions employed. Reactive crystallizations are employed quite often in the pharmaceutical industry, in particular, when in the final synthesis step a product is less soluble than the reactants and any by-products such that isolation can follow through simply by crystallization or precipitation from the solution in which the reaction has been carried out. Furthermore, it is also important to take into account the heating or cooling applied when the reaction is either exothermic or endothermic, due to its influence on supersaturation [16].
Another common method of reactive crystallization in the pharmaceutical industry is via pH modification. Many drug substances are slightly soluble weak acids or bases, whose anionic or cationic salt forms are much more soluble in water. Adjustment of the pH can thus lead to the crystallization or precipitation of the free acid or base, and this can be used to purify and consolidate the final product. Proton transfer reactions associated with pH shifts are generally rapid, and supersaturation is achieved rapidly [16].
12
The combination of rapid reaction and delayed nucleation usually results in conditions analogous to a very wide metastable zone, promoting the formation of amorphous materials, unstable and metastable polymorphs or crystals of poor quality [16].
As aforementioned, in the majority of crystallizations, either nucleation or growth contribute to the final properties and therefore it is critical to have maximum control and robustness over the crystallization kinetics. The next section discusses the nucleation and growth mechanisms.
2.3. Kinetic parameters
As mentioned in section 2.2, the rates of nucleation and growth play an important role in crystallization processes, due to their influence on the crystal size and size distribution [23].
2.3.1. Nucleation
Nucleation may be primary if the supersaturated solution is free of crystalline surfaces or secondary when it contains crystals. A high level of supersaturation is required for the primary nucleation to occur, being the main mechanism for precipitation. On the other hand, secondary nucleation is the principal mechanism when large crystals are desired. It involves the presence of crystals and their interaction with the environment, such as crystallizer walls or impellers [2], [23].
Primary Nucleation
Primary nucleation occurs in the absence of any foreign matter (neither crystals nor dust) and can be categorized into homogeneous or heterogeneous.
Homogeneous nucleation
The process is initiated when the molecules, present in the supersaturated solution, associate to form a cluster, which can either dissociate or grow. If a cluster grows to an appearance of a lattice structure, it develops into an embryo. Advanced embryo growth can result into a stable crystalline nucleus. The classical theory of nucleation postulates that clusters are created through an addition mechanism which continues until a critical size is attained [2], [23].
The rate of nucleus formation (𝐵0, number of nuclei/cm3.s) by this mechanism is described by
an expression similar to Arrhenius expression (Equation 2.4).
𝐵0 = 𝐴 𝑒𝑥𝑝 (−∆𝐺𝑐𝑟
𝑘𝐵𝑇
) (2.4)
Where 𝐴 is the frequency factor, theoretically equal to 1030 nuclei/cm3.s, ∆𝐺
𝑐𝑟 is the critical free
energy for nucleation (J), 𝑘𝐵 is the Boltzman’s constant in J/K and 𝑇 is the temperature in K.
The free energy change for the formation of this new solid phase (∆𝐺) is the sum of the free energy change for the formation of the nucleus surface (a positive quantity, ∆𝐺𝑠) and the free energy
13
change for the phase transformation (a negative quantity, ∆𝐺𝑣). For spherical nuclei, the free energy
change is given by Equation 2.5:
∆𝐺 = ∆𝐺𝑆 + ∆𝐺𝑣= 4𝜋𝑟2𝜎𝑠,𝐿+
4 3𝜋𝑟
3∆𝐺
𝑣 (2.5)
Where 𝜎𝑠,𝐿 is the interfacial tension (J/m2) and 𝑟 the nucleus’ radius (m).
The critical size (or critical nucleus radius, 𝑟𝑐 in m) can be found by minimizing Equation 2.5:
𝑑(∆𝐺) 𝑑𝑟 = 8𝜋 𝑟𝑐 𝜎𝑠,𝐿+ 4𝜋 𝑟𝑐 2∆𝐺 𝑣= 0 (2.6) Or 𝑟𝑐 = − 2 𝜎𝑠,𝐿 ∆𝐺𝑣 (2.7)
Substituting for ∆𝐺𝑣 from Equation 2.5 and 2.7, it is obtained the critical free energy for nucleation
∆𝐺𝑐𝑟 in Equation 2.8.
∆𝐺𝑐𝑟=
4𝜋 𝑟𝑐2 𝜎𝑠,𝐿
3 (2.8)
The growth of the clusters is expressed by the Gibbs-Thomson equation.
ln (𝑐
𝑐∗) = ln(𝑆) =
2 𝜎𝑠,𝐿 𝑉𝑚
𝑘𝐵 𝑇 𝑟
(2.9)
Where 𝑐 is the concentration of clusters of size 𝑟 and 𝑉𝑚 is the molar volume (m3/mol). Thus,
smaller clusters dissolve (Ostwald ripening as mentioned in the previous subchapter), whereas larger clusters grow until they reach a critical size 𝑟𝑐, and a new phase is created. Substituting for 𝑟𝑐 in Equation
2.8 from Equation 2.9, it is obtained: ∆𝐺𝑐𝑟=
16𝜋 𝑉𝑚2 𝜎𝑠,𝐿3
3(𝑘𝐵 𝑇 ln(𝑆))2
(2.10)
Substituting in Equation 2.4, the nucleation rate is given by [23]:
𝐵0= 𝐴 𝑒𝑥𝑝 [−16 𝜋 𝑉𝑚
2 𝜎
𝑠,𝐿3 𝑁𝑎
3𝑣2 (𝑅𝑇)3 [𝑙𝑛 (𝑆)]2] (2.11)
Where 𝑣 is the number of ions/molecule of solute, 𝑅 is the gas constant (8.314 J/K.mol) and 𝑁𝑎
14 Heterogeneous nucleation
Heterogeneous nucleation is more likely to occur, since it is extremely difficult to prepare solutions without incorporating any foreign particles like dust or colloidal. The presence of foreign substances in a supersaturated solution generally reduces the energy required for nucleation [26]. Since the free energy barrier is lower in the case of a heterogeneous system, nucleation occurs at a lower supersaturation. The decrease in the free energy (𝜑) depends on the wetting angle (𝜃) of the solid phase (Equation 2.13) [2].
∆𝐺ℎ𝑜𝑚𝑜𝑔𝑒𝑛𝑒𝑜𝑢𝑠= 𝜑∆𝐺ℎ𝑒𝑡𝑒𝑟𝑜𝑔𝑒𝑛𝑒𝑜𝑢𝑠 (2.12)
𝜑 = 1
4(2 + cos 𝜃)(1 − cos 𝜃)
2 (2.13)
Spontaneous nucleation would occur for a system with zero contact angle, nevertheless, no such systems occur in practice [2].
Secondary Nucleation
As mentioned previously, secondary nucleation occurs by the presence of crystals in the supersaturated solution [23]. This type of nucleation can be promoted by the following mechanisms [2]: Initial breeding, which occurs when dry crystals are first introduced into a solution. Small crystalline fragments present on the crystal surface are washed from the surface by the solution and form new nuclei;
Polycrystalline breeding, where the fragmentation of irregular polycrystalline aggregates, formed at high supersaturation, serves as nucleation centers;
Abrasion of crystals, caused at high stirring speeds, which results into fragments which serve as nucleation sites;
Fluid shear forces are enough to produce secondary nuclei from an existing crystal surface [27]. For example, when at high supersaturation, dendritic growth takes place at the crystal surface that can break due to the shear flow around it or due to the dendrite coarsening mechanism, being the source of crystal nuclei. Additionally, the shearing action of the fluid is enough to detach a layer of the crystals [2];
Contact nucleation (collision breeding or collision nucleation), the most important mechanism of secondary nucleation in industrial crystallizers, is promoted by the contact between a growing crystal and the walls of the vessel, stirrer or other crystals, resulting into the genesis of contact nuclei. It is the most common type, since it occurs at lower supersaturation values [2].
The following function is widely used, to obtain the rate of secondary nucleation, which correlates much of the experimental data:
𝐵0= 𝑘
𝑁 (𝑆 − 1)𝑏𝑀𝑇 𝑗
15
Where 𝑀𝑇 is the mass of crystals per volume of suspension and N is the agitation rate (rpm of an
impeller). The constants 𝑘𝑁, b, j and r are obtained from experimental data, on the respective system
[23].
Factors that influence secondary nucleation
Supersaturation, degree of agitation and the presence of impurities are the factors that affect secondary nucleation. At a higher supersaturation degree, the adsorbed layer is thicker, resulting in a higher number of nuclei. On the other hand, increasing the agitation degree translates into an increase in the contact between the crystals themselves, crystals and crystallizer walls and crystal-impeller, and hence favor contact nucleation. Furthermore, the agitation also induces flow shear, aiding the secondary nucleation mechanism [28]. The effect of impurities is complex and unpredictable [2]. According to Denk and Botsaris [29], trace amounts of certain dissolved impurities can diminish the nucleation rate of crystals or even hinder their formation. The impurity uptake by the growing seed crystal may lead to an impurity concentration gradient in the boundary layer surrounding the seed crystal. Due to this gradient, the impurity concentration near the crystal surface may be considerably lower than the bulk concentration. The Impurity Concentration Gradient (ICG) nucleation model states that if the conditions were such that the only reason that spontaneous nucleation did not occur in the bulk solution was because of the high impurity concentration that existed there, and if the impurity concentration near the crystal surface was reduced to a low enough level, nucleation could occur in the boundary layer near the crystal surface [29].
As aforementioned, nucleation refers to the birth of new nuclei and once it has been achieved, nuclei growth dominates by the addition of solute molecules from the supersaturated solution (crystal growth).
2.3.2. Crystal growth
Crystal growth is a layer by layer process, where the deposition of the layers is dependent on the crystal packing of the unit cell, which means, how the elements of a specific molecular species are three-dimensionally assembled in a crystalline state [23].
Growth takes place when the rate of integration of single molecules or aggregates into an existing lattice structure transcends the rate of release of these entities from the surface, a process also driven by local concentration variation [30].
The growth of crystals can be described by three mechanisms: continuous growth mechanism, two-dimensional nucleation and spiral growth.
Continuous growth mechanism
According to this growth mechanism, high roughness crystalline material, containing kink and step sites on the surface, accommodates easily any approaching growth unit (Figure 2.1). This might be explained by the fact that molecules tend to bond at the location where they have the maximum number of nearest neighbors.
16
Growth by two-dimensional nucleation mechanism
Many crystallized materials do not have enough roughness to promote continuous growth, hence it is necessary to create steps to accommodate the incoming growth units. The two-dimensional nucleation is a mechanistic explanation for the conception of these steps, through the formation of nucleated circles on the flat surface of the crystal, where the molecules are being adsorbed onto, desorbed from and diffusing to the surface (Figure 2.2).
Figure 2.2. Two-dimensional nucleus formation on a crystal surface [30].
Spiral growth mechanism (screw dislocation)
The spiral growth or screw dislocation mechanism was proposed by Burton, Cabrera and Frank (BCF theory). This mechanism postulates that once the screw dislocation is created, the crystal growth at the edge of the dislocation is energetically favorable, resulting in a spiral growth of the crystal [31].
Dislocation can occur within crystals as a result of stresses in crystal growth on seeds and around surface nuclei and inclusions [30]. Spiral can promote different growth rates on different crystals of the same material, due to the fact that each crystal is responding to the structure of its own unique dislocation (Figure 2.3).
Step
Kink
17
Figure 2.3. Development of a spiral growth from a screw dislocation of a Tin (IV) sulphide crystal [31].
Mass transfer principles
The mass transfer in crystal growth can be described by the two-step theory. In the first step, the mass transfer of the solute occurs from the bulk of the solution to crystal-solution interface and is expressed by Equation 2.15:
𝑑𝑚
𝑑𝑡 = 𝑘𝑐 𝐴 (𝑐 − 𝑐𝑖) (2.15)
Where 𝑑𝑚
𝑑𝑡 is the rate of mass deposited on the crystal surface, 𝑘𝑐 is the mass transfer coefficient
(m/s), 𝐴 is the surface area of the crystal (m2), 𝑐 is the mass solute concentration in the bulk
supersaturated solution (kg/m3) and 𝑐
𝑖 is the supersaturated concentration in the interface (kg/m3). Since
the molecular diffusion of the solute occurs through a thin stagnant film of solution adjacent to the crystal surface: 𝑘𝑐 = 𝐷/𝛿, where 𝐷 is the diffusion coefficient (m2/s) and 𝛿 is the film thickness (m) which
depends on the velocity of the solution past the crystal, which is defined by the degree of agitation [23]. Regarding the second step, a first-order reaction is assumed to occur at the crystal-solution interface, in which solute molecules are integrated into the crystal-lattice structure, being this kinetic step expressed by Equation 2.16:
𝑑𝑚
𝑑𝑡 = 𝑘𝑖 𝐴 (𝑐𝑖− 𝑐
∗) (2.16)
Where 𝑘𝑖 (m/s) is the kinetic coefficient.
Combining both equations 2.15 and 2.16, equation 2.17 is obtained: 𝑑𝑚 𝑑𝑡 = 𝐴 (𝑐 − 𝑐∗) 1 𝑘𝑐+ 1 𝑘𝑖 (2.17)
At low solution agitation velocities, the growth rate may be controlled by the first step. The second step can be important, especially when the solution velocity surrounding the crystal surface is high, such that 𝑘𝑐 is large compared to 𝑘𝑖. The former is independent of the crystallization process and can be
estimated from general fluid-solid particle mass-transfer coefficient correlations, whereas 𝑘𝑖 is peculiar
to the crystallization process. Diverse theories have been advanced for the kinetic step, for instance the one by Burton, Cabrera and Frank (BFC) where their theory indicates that the crystal growth starts from
18
a screw dislocation (imperfection in the crystal structure), confirmed by experiments using scanning-electron microscopy, as aforementioned. The kinetic coefficient 𝑘𝑖, is back-calculated from experimental
data [23].
Although crystals do not grow as spheres, the equation for the rate of increase of the diameter of a spherical particle can be deduced from Equation 2.17, considering an overall coefficient 𝐾𝑐 .
𝑑𝑚
𝑑𝑡 = 𝐾𝑐 𝐴 (𝑐 − 𝑐
∗) (2.18)
Where 𝐴 = 𝜋𝐷𝑝2 and 𝑚 =
𝜋 𝐷𝑝3
6 𝜌, 𝐷𝑝 is the particle (crystal) diameter in m, and 𝜌 is the crystal
density (kg/m3). Therefore, substituting in Equation 2.18:
𝑑𝐷𝑝 𝑑𝑡 = 2𝐾𝑐 (𝑐 − 𝑐∗) 𝜌 = 2𝐾𝑐 ∆𝑐 𝜌 (2.19)
If the rate of growth is controlled by 𝑘𝑖 , which is assumed to be independent of 𝐷𝑝:
∆𝐷𝑝
∆𝑡 = 2𝑘𝑖 ∆𝑐
𝜌 (2.20)
And the rate of crystal size is linear in time for a constant supersaturation. If the growth rate is controlled by 𝑘𝑐 at a low velocity, then from the convective mass transfer using Fick’s law of diffusion:
𝐾𝑐 = 𝑘𝑐 =
2𝐷
𝐷𝑝 (2.21)
Substituting Equation 2.21 into Equation 2.19:
𝑑𝐷𝑝 𝑑𝑡 = 4𝐷 ∆𝑐 𝐷𝑝 𝜌 (2.22) Integrating from 𝐷𝑝0 to 𝐷𝑝: 𝐷𝑝2− 𝐷𝑝02 2 = 4𝐷 ∆𝑐 𝜌 𝑡 (2.23) If 𝐷𝑝0 << 𝐷𝑝: 𝐷𝑝= √ 8𝐷 ∆𝑐 𝑡 𝜌 (2.24)
In this case, the increase in crystal diameter slows with time. It is common to assume that the rate of crystal growth is controlled by 𝑘𝑖 and that it is not dependent on crystal size and is invariant with time
19
The following chapter mentions the concerns that must be taken into account regarding the scale-up stage.
2.4. Scale-up of pharmaceutical crystallization processes
Conventionally, pharmaceutical crystallization processes are operated in batch mode to allow flexibility to produce diverse products and respond to changing market demands [32]. Nevertheless, much effort has been put to transit to continuous operating mode, to achieve homogeneity in the production process and therefore obtain more consistent product specifications [22].
This section will be focused on batch crystallizers since it was the operation mode studied throughout this thesis.
Batch crystallizers are classified according to the method used to generate supersaturation: cooling, evaporation, anti-solvent addition and reaction [33]. Moreover, they are also simple and flexible in operations, involving less investment and less process development than those for a continuous mode [34]. Batch crystallization may also include the semi-batch system in which one or more feed solutions are continuously added to the crystallizer, as for instance in the anti-solvent and reaction methods [2].
2.4.1. Batch crystallizers
Laboratory batch crystallizers have been successfully used during the crystallization process development phase, in order to estimate and measure the effects of the operating conditions on the kinetics, metastable zone width and help decide what crystallization method to use. Additionally, it also aids in the determination of the design features which will lead to the desired yield and crystal properties [2].
According to the literature [35]–[40], the laboratory crystallizers (Figure 2.4) usually consist of agitated jacketed glass vessels with temperature control using a thermo-stated bath, since these emulate the ones employed in the pharmaceutical industrial scale (Figure 2.5).
Jacket
Drain valve Agitator
Figure 2.4. Batch laboratorial scale crystallizer [44].
![Figure 3.1. The effect of polarity of solvents on the crystal habit of hydrocortisone [9]](https://thumb-eu.123doks.com/thumbv2/123dok_br/15725070.1070899/42.892.241.679.99.476/figure-effect-polarity-solvents-crystal-habit-hydrocortisone.webp)