In situ evaluation of water and energy consumptions at the end use level:
The in
fluence of flow reducers and temperature in baths
C. Matos
a,b,⁎
, A. Briga-Sá
a,b, I. Bentes
a,b, D. Faria
a, S. Pereira
a,baECT—School of Science and Technology, University of Trás-os-Montes e Alto Douro UTAD, Quinta de Prados, 5000-801 Vila Real, Portugal bC-MADE—Centre of Materials and Building Technologies, University of Beira Interior, 6201-001 Covilhã, Portugal
H I G H L I G H T S
• Domestic consumption of water and electricity in the baths were assessed; • Presence of flow reducers decreases
water/electricity consumption; • Presence of flow reducers increases the
duration of the baths;
• Lower temperature in water-heater, de-creased water/electricity consumption and the baths duration;
• Flow reducer and lower temperature, had a significant influence on electricity consumption and on the baths dura-tion. G R A P H I C A L A B S T R A C T
a b s t r a c t
a r t i c l e i n f o
Article history: Received 6 December 2016Received in revised form 24 January 2017 Accepted 1 February 2017
Available online 16 February 2017 Editor: D. Barcelo
Nowadays, water and energy consumption is intensifying every year in most of the countries. This perpetual in-crease will not be supportable in the long run, making urgently to manage these resources on a sustainable way. Domestic consumptions of water and electric energy usually are related and it's important to study that relation, identifying opportunities for use efficient improvement. In fact, without an understanding of water-energy rela-tions, there are water efficiency measures that may lead to unintentional costs in the energy efficiency field. In order to take full advantage of combined effect between water and energy water management methodologies, it is necessary to collect data to ensure that the efforts are directed through the most effective paths.
This paper presents a study based in the characterization, measurement and analysis of water and electricity con-sumption in a single family house (2 months period) in order tofind an interdependent relationship between consumptions at the end user level. The study was carried out on about 200 baths, divided in four different sce-narios where the influence of two variables was tested: the flow reducer valve and the bath temperature. Data showed that the presence offlow reducer valve decreased electric energy consumption and water sumption, but increased the bath duration. Setting a lower temperature in water-heater, decreased electric con-sumption, water consumption and bath duration. Analysing the influence of the flow reducer valve and 60 °C temperature simultaneously, it was concluded that it had a significant influence on electric energy consumption and on the baths duration but had no influence on water consumption.
© 2017 The Author(s). Published by Elsevier B.V. This is an open access article under the CC BY-NC-ND license (http://creativecommons.org/licenses/by-nc-nd/4.0/). Keywords: Water-energy relation Baths consumption Residential In situ measurement
⁎ Corresponding author at: Universidade de Trás-os-Montes e Alto Douro (UTAD), Escola de Ciências e Tecnologia, 5000-801 Vila Real, Portugal. E-mail address:[email protected](C. Matos).
http://dx.doi.org/10.1016/j.scitotenv.2017.02.008
0048-9697/© 2017 The Author(s). Published by Elsevier B.V. This is an open access article under the CC BY-NC-ND license (http://creativecommons.org/licenses/by-nc-nd/4.0/).
Contents lists available atScienceDirect
Science of the Total Environment
1. Introduction
Increasing energy consumption is expected over the next few de-cades due to urbanization on a global scale. The water issue is so ur-gent that it is thought that by 2050, about 75% of the world's population mayfind a shortage of fresh water available (Chen and Chen, 2016).
With the increase of world population, social demands of water and energy are increasing significantly. In fact, by 2030 global energy consumption is expected to growth by 50%. This will substantially aggravate the world's water and energy shortages, especially in some regions and countries with energy and/or water scarcity. An integrated approach to the energy-water nexus is needed to study the inseparable relationships between water and energy, which have increased substantially in recent years (Zhang and Vesselinov, 2016).
The residential sector is a large consumer of both energy and water. Worldwide, the domestic water consumption has increased along the last two decades what involves increased energy sumptions and represents about 40% of the total world energy con-sumption. Most of this energy is used for lighting, water heating, cooking and air-conditioning (Duarte et al., 2010). The overall con-tribution of water heating in housings is huge. As an example, in Queensland, Australia, heating and cooling home spaces accounts for 39% of residential energy use while hot water heating alone ac-counts for 27% (Larkin, 2011). In the USA, 14–25% of the energy sup-plied to residences heats water. In the United Kingdom, in 2009, domestic hot water consumption accounted for about 18% of the total domestic energy consumption (Boait et al., 2012).Kenway et al. (2008), refer that in Australia, the energy use for residential hot water isfive (Adelaide) and eleven (Melbourne) times more than the energy required to deliver urban water services.Kenway et al. (2011)estimate that, on average, residential end-use of water ac-counts for approximately 30% of the energy used during the urban water cycle, and energy for water heating accounts for approximate-ly 23% (Binks et al., 2016).
According toINE (2010)in Portugal there are several types of sources for energy and for water heating, namely butane and propane gas, natural gas, solar, diesel, wood and off course electricity. Most of the energy is from butane (34.5%) and natural gas (27.9%). 3.4% of the energy for water heating is delivered by electricity.
Ramos et al. (2010)refer that, according to the typical load curves for water and energy consumption, the periods of highest consumption of water and energy occur at approximately the same time and so, water conservation is directly linked to energy conservation.
In Portugal, building sector presents the second highest growth rate of energy consumption, immediately following the transport sector (Silva-Afonso et al., 2011). Nearly 50% of energy consumption by resi-dential buildings is associated to water heating. Thus, the increase of water efficiency in buildings will lead to the reduction of energy spent in it.
In addition,N50% of the consumption could be reduced if efficien-cy measures are put in practice (ADENE, 2011), such as the use of ef-ficient water use products. Indeed, one way of reducing consumption is the use and certification of efficient products. United Kingdom, Ire-land or the Nordic countries are examples of European countries where this certification is already applied. Outside Europe, there are several examples that can be referenced, including Australia, USA, Japan, among others.
In Portugal, the need of an efficient water use was described in the National Programme of Efficient Water Use (PNUEA, 2001). ANQIP (Na-tional Association for Quality in Building Services) decided to introduce in Portugal a certification system for products, through the labelling of efficient products. Initially, this certification model was only imple-mented for cisterns, as these are the products of higher consumption in buildings in Portugal (Silva-Afonso and Rodrigues, 2008). Today,
the model is already being implemented, in addition to the cisterns, to showers, taps andflush valves.
The potential for energy demand management through water ef fi-ciency measures has been documented (Beal et al., 2012). However, without an understanding of water energy relations, these is a risk that efforts to rise efficiency on one resource (e.g. water) and cut effi-ciency of the other (energy) (Binks et al., 2016).
Alternative choices of water end use may have very different impli-cations for energy demands. In the residential sector, various appliances and processes are major water consuming, like faucets, washers, showers and toilets. End use energy intensity is very high and human behavioural aspects has a determinant role in setting water related en-ergy consumption (Plappally and Lienhard, 2012).
Individual behaviour, lifestyle, psychological, cultural and social factors and gender preferences are some factors that may influence end use energy consumption in a residential sector (Yu et al., 2011). The average showering time for an individual in the UK and Australia was 7.2 min (Walker and Higgins, 2007; Willis et al., 2010).Walker and Higgins (2007)reported that people below the age of 18 spent more time under showers than the 18–34 age group; there was not much change in showering time with respect to gender. Showering, using faucets and bathing in bathtubs on aver-age consumed 5.4 kWh/m3of electricity in Arizona (Hoover and
Scott, 2009).
According toPlappally and Lienhard (2012),Gleick (1996)found that household water use also changes with climate. This researcher de-scribed that the water use in a house hold in a humid developing nation may reach the 0.02–0.04 m3/(capita·d) and in a dry region the value
in-creases to 0.06–0.08 m3/(capita·d).
In this context, the main focus of this work is to study the relation between water and related energy consumptions in households. In order to take full advantage of combined effect between water and en-ergy water management methodologies, it is necessary to collect data to ensure that the efforts are directed through the most effective paths. This is a very ambitious goal and so the study started with the character-ization, measurement and analysis of the water and electricity con-sumption during the baths in order to obtain some references values that may allow the work progress. This was performed in a single-family dwelling, with three members, for a period of 2 months and the results are presented in this paper. The option of start with the baths monitor-ing is related with the fact that baths are the domestic energy to water-related activity that spends the higher part of the domestic water consumptions.
The option of analysing the electric energy is related to the house-hold chose to perform the study. Other energy sources are used for this end-use, and this will be included in future works.
To determine the relationship of water and electric energy con-sumption two variables were introduced: bath temperature and intro-duction of aflow reducer valve. These variables allowed to produce different scenarios and to found some relations between the water use and the energy consumption.
Despite the fact that this is a single house characterization, and so it does not represent a large case study (involving several dwellings and various types of water uses), are presented fundamental results once besides establishing important reference values, are also identified the influence of the use of flow reducing valves and temperature control in water and energy consumptions and in the duration of the bath. Ad-ditionally, it is important to refer the complexity of the sampling meth-od used to quantify the amount of hot water and related energy spend in a bath. This sampling method as it is referred further ahead required discipline and motivation by the users, which is not very easy to guaran-tee. This was one of the main reasons that take the authors to perform the study in a single house.
The results obtained will allow to identify procedures that reduce the consumption of water and energy associated with this consumption without, however, jeopardizing the comfort of the user.
2. Material and methods 2.1. Household characterization
The case study was developed in a single house, type T2, occupied by three people, located in an urban area, in the centre of Vila Real, Portugal. This house hadN20 years, but was undergone a complete res-toration. The house has only one bathroom with shower, a sink and a toilet with dualflush toilet. In the bathroom, there are three mixer taps and in the kitchen, there is also a mixer tap.
In this house, the only source of energy is electricity and for water heating it is used a heat accumulator.
The household is occupied by a Portuguese standard family, consisting of 3 elements: a 24-year-old university student, a 28-year woman on maternity leave and a 32-year-old active professional man.
2.2. Data collection and analysis methods
The study considered an observation period in a total of 2 months, including periods of October, November, December of 2015 and January of 2016. In this period, 193 baths were monitored, divided by 4 different scenarios, were the temperature in the heat-accumulator (60 °C or 75 °C) and the introduction or not of aflow reducer valve were consid-ered, as indicated inTable 1.
A measurement of the water and energy consumptions was carried out in situ. The water consumption was measured on the counter before and after each bath. The corresponding energy consumption was mea-sured by an individual power meter inserted in the heat accumulator, also before and after each bath. The non-simultaneous use was guaranteed.
A correlation analysis was made in order to discover the relationship between the variables: duration of bath and water consumption, duration of bath and energy consumption and water and energy consumptions.
2.2.1. One-way ANOVA statistic
To better understand the relationship between domestic water con-sumption (l) and energy concon-sumption (kWh), one-way ANOVA statis-tics was used to discover the influence of the flow reducers and temperature in the heat-accumulator on this consumptions and bath duration (min). ANOVA provides a statistical test of whether or not the means of several groups are equal, and therefore generalizes the t-test to more than two groups. ANOVA are useful for comparing (t-testing) three or more means (groups or variables) for statistical significance (Munro, 2001).
3. Results and discussion 3.1. Water and energy consumption
Water and energy consumption values obtained during the baths are presented inTable 2. Mean (Μ) and the standard deviation (Ν) values related to water, electric energy (kWh) consumption and duration of the baths obtained for the four scenarios are presented. Calculated values of waterflow (l/min) and the relations between energy con-sumption and water concon-sumption (kWh/m3), on those scenarios are
also presented.
Results allow to conclude that the scenario C1RT60 has the lowest average values in water and electric energy consumption (44.87 l and 1.05 kWh) and in duration of the bath (6.18 min). These values may be explained by the introduction of theflow reducer valve and the fixa-tion of the bath temperature in 60 °C that lead to the decrease of both consumptions and bath duration.
Scenario C2RT75 has higher values, having a consumption of 60.57 l of water for 2.30 kWh of electric energy, representing an increase of 26% and 54%, of water and electrical energy, respectively, when compared with the scenario C1RT60. The higher average values for the bath dura-tion (8.44 min) may be related with the person behaviour during the bath. For scenario C2RT75, the baths were monitored for the same user, revealing similar patterns and avoiding the variability of the values. In fact, the influence of similar values in the duration of the baths under this scenario is seen in the standard deviation (which is lower than in all other scenarios). Scenario C2RT75 doesn't represent the highest average value for water consumption, possibly by the pres-ence of aflow reducer valve. Comparing these results (C2RT75) with the ones obtained for the temperature of 60 °C (C1RT60) it is visible that the electric energy consumption increase with the increase of temperature in the water heater. Increased bath duration and, consequently, energy consumption in C2RT75 can also be explained by the fact that the user feels more comfortable during the bath when the water temperatures is higher. Moreover, taking into account that theflow reducer valve is present in both scenarios (C2RT75 and C1RT60), and so theflow values are very close it may be concluded that the temperature values were de-terminant on the energy consumption values.
Table 2
Mean and standard deviation values on the four scenarios. Electric energy consumption (kWh) (μ ± ν)
% Duration of the bath (min) (μ ± ν) Water consumption (l) (μ ± ν) % Flow (l/min) (μ ± ν) (kWh/m3 ) (μ ± ν) C1RT60 1.05 ± 0.31 −54% C2RT75 −55% C3T75 −36% C4T60 6.18 ± 2.04 44.87 ± 16.10 −26% C2RT75 −39% C3T75 −12% C4T60 7.22 ± 0.96 25.03 ± 6.23 C2RT75 2.30 ± 0.39 +54% C1RT60 −2% C3T75 +38% C4T60 8.44 ± 1.09 60.57 ± 11.61 +26% C1RT60 −18% C3T75 +12% C4T60 7.19 ± 1.10 39.34 ± 9.29 C3T75 2.34 ± 0.52 +55% C1RT60 +2% C2RT75 +39% C4T60 7.08 ± 1.97 73.66 ± 22.89 +39% C1RT60 +18% C2RT75 +45% C4T60 10.42 ± 1.44 33.26 ± 6.77 C4T60 1.43 ± 0.31 +36% C1RT60 −38% C2RT75 −39% C3T75 6.28 ± 1.85 50.85 ± 15.80 +12% C1RT60 −12% C2RT75 −45% C3T75 8.07 ± 0.69 29.18 ± 3.99 Table 1
Description of the bath scenarios.
Name n Description Scenario code
Scenario 1 49 Withflow reducter valve C1RT60 Bath temperature of 60 °C
Scenario 2 51 Withflow reducter valve C2RT75 Bath temperature of 75 °C
Scenario 3 50 Withoutflow reducter valve C3T75 Bath temperature of 75 °C
Scenario 4 47 Withoutflow reducter valve C4T60 Bath temperature of 60 °C
Scenario C3T75 is characterized by the higher values of water and electric energy consumption, with an average of 73.66 l and 2.34 kWh respectively. This scenario represents an increase of 55% and 39% in electric energy and water consumption respectively, compared to C1RT60. Comparing with C2RT75, the C3T75 represents an increase of 2% in electric energy consumption and 18% in water consumption. The bath duration in scenario C3T75, has registered one of the highest values (7.08 min), there is noflow reducer valve and the bath temperature was 75 °C, and so all the conditions together may explain the higher values of consumptions. When compared with the C2RT75 there is an identical electric energy consumption. In the case of water consumption, there is an increase on water consumption when compared with C1RT60 (which is the lowest) and with C2RT75, both havingflow reducer valve. Finally, scenario C4T60 presents the second lowest average values for water, electric energy consumption (50.85 l and 1.43 kWh) and av-erage duration of the bath (6.28 min). This scenario that differs from the C1RT60 from the absence of theflow reducer valve, presents an increase of 36% and 12% in electric energy and water consumption respectively, compared to C1RT60. Comparing C4T60 with C3T75, C4T60 presented a decrease of 39% in electric energy consumption and 45% in water con-sumption what represent a large decrease. Comparing C4T60 with C2RT75, there is a slight decrease in water consumption (12%) and a high decrease in electric energy consumption (38%).
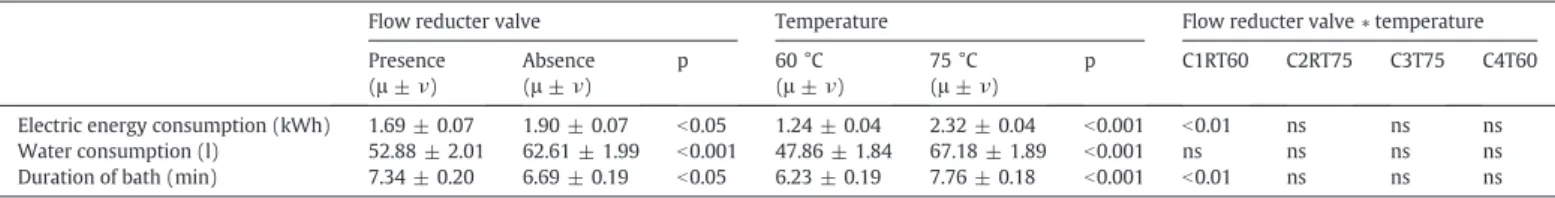
InTable 3, is presented a statistical analysis of the consumption values (water and energy) and the duration of the baths, clustered by variables, i.e., all the baths were grouped in with or withoutflow reduc-er valves, ignoring tempreduc-erature, and then wreduc-ere grouped considreduc-ering the two temperatures, ignoring the presence/absence offlow reducer valves.
The influence of the flow reducers and water temperature on the en-ergy consumption (kWh), water consumption (l) and bath duration (min) were assessed by one-way analysis of variance (ANOVA) set pb 0.05 for statistical significance. It was concluded that scenarios with bath temperature of 75 °C (μ = 2.32 kWh; p b 0.001) as well as the scenarios withoutflow reducer valve (μ = 1.90 kWh; p b 0.05) are those which showed a higher electric energy consumption. The same may be observed in water consumption, where was found an average of 67.18 l (pb 0.001) in the scenarios with bath temperature of 75 °C and an average of 62.61 l (pb 0.001) in the scenarios without flow re-ducer valve. Regarding the duration of the bath, it was found that the scenarios with bath temperature of 75 °C were those with longer dura-tion (μ = 7.76 min; p b 0.001) as well as in the scenarios with flow re-ducer valve (μ = 7.34 min; p b 0.05). The local conditions inside the bathroom did not affect the bath, once the measurements were made in controlled environments in terms of temperature.
Results showed that increased temperature and the absence offlow reducer are associated with a significant increase in domestic consump-tion. The fact that the duration of the bath is lower in scenarios with lower temperature may be due to the user dissatisfaction when the bath is characterized by lower temperatures. It was also found that the presence offlow reducers increases the duration of the baths, which may also be justified by the fact that the user feels that comfort during the bath is reduced.
The scenario withflow reducer valve combined with a temperature of 60 °C (C1RT60), is the one that presents a shorter duration of the baths (pb 0.01) what results in a reduction of electric energy consump-tion (pb 0.01). However, there is no evidence of influence on water con-sumption (pN 0.05). In other scenarios, there was no significant difference between the different combinations.
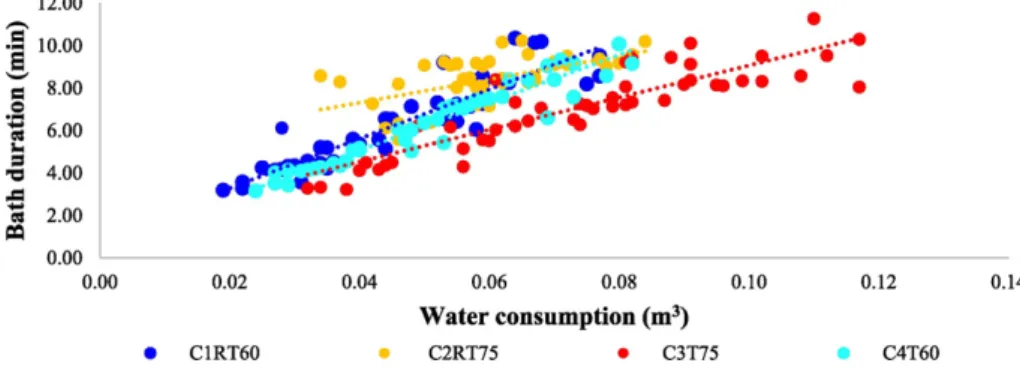
3.2. Influence of bath duration on water and energy consumptions The duration of the bath and the water consumption are strongly correlated in scenarios C4T60 (R2 = 0.9235) and C1RT60 (R2 = 0.8426) (Table 4), although were found a moderate correlation between the variables in C3T75 (R2= 0.7684). The same did not happened in
C2RT75 (R2= 0.3392) where there is no correlation between the variables.
The variables duration of bath and electric energy consumption are strongly correlated in C4T60 (R2= 0.8264) (Table 5). Although with lower values was also found a moderate correlation between the vari-ables in C3T75 (R2= 0.7838) and in C1RT60 (R2= 0.6172). The same
did not occurred in C2RT75 (R2= 0.3773) where there is no correlation
between the variables.
Fig. 1andFig. 2present the linear correlation found between the duration of the bath (in minutes) and water consumption (m3) and
energy consumption (kWh) for the four scenarios studied. The posi-tive correlation values presented (weak to strong) indicate that with increased bath duration there is an increase in water and energy consumptions.
C1RT60 and the C4T60 have an average duration of bath very similar, 6.18 min and 6.28 min, respectively, verifying the proximity in water consumption. Notably, it is observed that C3T75 have the higher water consumption, and in this scenario, the average duration of the bath is 7.08 min. Although there are little differences in water consumptions C2RT75 presented the highest average values of bath duration (8.44 min).
C1RT60 has the lowest energy consumption of all scenarios (1.05 kWh), followed by C4T60 (1.43 kWh) with an average duration of bath very similar to C1RT60. According toFig. 2it may be observed
Table 3
Consumption values (mean ± standard deviation (μ ± ν)) of electric energy (kWh), water (l) and duration of the baths (min).
Flow reducter valve Temperature Flow reducter valve∗ temperature
Presence (μ ± ν) Absence (μ ± ν) p 60 °C (μ ± ν) 75 °C (μ ± ν) p C1RT60 C2RT75 C3T75 C4T60
Electric energy consumption (kWh) 1.69 ± 0.07 1.90 ± 0.07 b0.05 1.24 ± 0.04 2.32 ± 0.04 b0.001 b0.01 ns ns ns Water consumption (l) 52.88 ± 2.01 62.61 ± 1.99 b0.001 47.86 ± 1.84 67.18 ± 1.89 b0.001 ns ns ns ns Duration of bath (min) 7.34 ± 0.20 6.69 ± 0.19 b0.05 6.23 ± 0.19 7.76 ± 0.18 b0.001 b0.01 ns ns ns ns: not significant; p: significance value.
Table 4
Relationship between bath duration (min) and water consumption (m3
). Scenario Equation R2 C1RT60 Y = 116.4400X + 0.9602 0.8426 C2RT75 Y = 54.9230X + 5.1219 0.3392 C3T75 Y = 75.6050X + 1.5083 0.7684 C4T60 Y = 112.6000X + 0.5625 0.9235 Table 5
Relationship between bath duration (min) and electric energy consumption (m3
). Scenario Equation R2 C1RT60 Y = 5.6576X + 0.3806 0.6172 C2RT75 Y = 2.0373X + 3.8579 0.3773 C3T75 Y = 3.3580X− 0.7877 0.7838 C4T60 Y = 5.7830X− 1.9020 0.8264
a similar electric energy consumption in scenarios C2RT75 and C3T75. However, it is in C2RT75 that the higher average values of the bath du-ration (8.44 min) are registered. C3T75 have presented only 7.08 min. 3.3. Relationship between water and electric energy consumption
Table 6shows a positive linear correlation values for the variables water consumption (m3) and the electric energy consumption (kWh)
while bathing, in the four studied scenarios. The two variables are strongly correlated in C4T60 (R2= 0.8705). With lower values, there
is also a correlation between the variables in C3T75 (R2= 0.6412)
and C1RT60 (R2= 0.6585). In C2RT75 there is no correlation between
the variables (R2= 0.0195).
In all the scenarios, increased water consumption leads to increased energy consumption (Fig. 3).
Analysing the two scenarios with the bath temperature at 60 °C, one withflow reducer valve (C1RT60) and another without (C4T60) it may be observed that C4T60 has a higher water and electric energy con-sumption than C1RT60, but they have a similar average duration of baths. This fact can be explained by the absence offlow reducer valve in C4T60, which lead to lower consumptions.
In the two scenarios with temperature of bath at 75 °C, one withflow reducer valve (C2RT75) and the other without (C3T75) it was obtained similar electric energy consumption, having, however, a slight increase in water consumption on scenario C3T75 which can be explained by the absence offlow reducer valve in this scenario. Though, with the maxi-mum temperature of bath (75 °C), the slight increase in water con-sumption on C3T75 does not influence the values of electric energy
consumption, possibly because the average of the bath duration is lower. In conclusion, the electric energy consumption is higher in C2RT75 and C3T75 where the temperature of bath wasfixed at 75 °C.
After the correlation analysis in the four scenarios, it was found that there exists a correlation between the household water consumption and energy, noting that the variations are assumed mainly to the tem-perature of bath and in the presence or absence offlow reducer valves. In this sense, the scenario where there isflow reducer valve and a tem-perature of bath at 60 °C appears to be the most environmental friendly. On the other hand, the scenario in which there is noflow reducer valve and the temperature of bath is 75 °C, where the consumptions are clear-ly higher with an increase of 55% in electric energy consumption and 39% in water consumption.
4. Conclusions
The present paper was based on the development of a case study that aimed to evaluate the interdependence between domestic con-sumption of water and electric energy. The methodological component of this study included the measurement and analysis of water and elec-tric energy consumption in four different bathing scenarios. The appli-cation of ANOVA suggested the presence of statistically significant differences of mean values in water and electric energy consumptions depending on the temperature of bath and the presence or absence of flow reducer valves. An analysis of the combination of the variables in the different scenarios was conducted in order to allow a further optimi-zation of the consumption values. It was concluded that the scenario C1RT60 (that combines theflow reducer valve with the lower temper-ature) showed to be more efficient.
The collected data provides evidences that there are management strategies of these resources that consumers can/should take into con-sideration. In order to take full advantage of combined effect between water and energy water management methodologies, it is necessary to collect more data to ensure that the efforts are directed through the most effective paths.
This was a case study, restricted only to a single family dwelling, not allowing to evaluate a greater diversity of consumption habits. Although
Table 6
Relationship between water consumption (m3
) and electric energy consumption (kWh).
Scenario Equation R2
C1RT60 Y = 0.0419X + 0,0007 0,6585
C2RT75 Y = 0.0041X + 0,0512 0,0195
C3T75 Y = 0.0352X− 0,0088 0,6412
C4T60 Y = 0.0467X− 0,0161 0,8705
Fig. 1. Relationship between bath duration (min) and water consumption (m3
).
Fig. 2. Relationship between bath duration (min) and electric energy consumption (m3
the results allow to establish an intercorrelation between water and en-ergy consumptions, it is important to extend this type of analysis to a higher number and variability of samples.
In conclusion, from the point of view of water and energy manage-ment, the obtained results show that there are strategies to manage these resources that consumers can and should take into account to re-duce consumptions.
The results obtained will allow to identify procedures that reduce the consumption of water and energy associated with this consumption without, however, jeopardizing the comfort of the user.
The authors pretend to continue the research, expanding the sample and changing the sampling method in an automatic/continuous one, not dependent on the user good will. Additionally, it is intended to col-lect by survey, background information about the users (socio-econom-ic and demograph(socio-econom-ic characterist(socio-econom-ics) in order to evaluate its influence on energy and water consumptions.
Acknowledgement
This work was partially funded by POCI-0-0145-FEDER-016730 Project (PTDC/AAG-REC/4700/2014) with the designation ENERWAT: Water to energy: characterization, modelling and measures for the re-duction of urban and rural household consumption,financed by the Foundation for Science and Technology and co-financed by the European Regional Development Fund (FEDER) through the COMPETE 2020 -Programme Operational Competitiveness and Internationalization (POCI).
This work was partially supported by the FCT (Portuguese Founda-tion for Science and Technology) through the project PEst-OE/ECI/ UI4082/2013 (C-MADE).
References
ADENE, 2011.Guia da Eficiência Energética. ADENE-AGÊNCIA PARA A ENERGIA, Algés.
Beal, C.D., Bertone, E., Stewart, R.A., 2012.Evaluating the energy and carbon reductions resulting from resource-efficient household stock. Energ. Buildings 55, 422e432.
Binks, A.N., Kenway, S.J., Lant, P.A., Head, B.W., 2016.Understanding Australian household water-related energy use and identifying physical and human characteristics of major end uses. J. Clean. Prod. 135, 892–906 (1 November 2016, ISSN 0959-6526).
Boait, P.J., Dixon, D., Fan, D., 2012.Production efficiency of hot water for domestic use. Energ. Buildings 54 (6), 160–168.
Chen, S., Chen, B., 2016. Urban energy–water nexus: a network perspective. Appl. Energy
http://dx.doi.org/10.1016/j.apenergy.2016.03.042.
Duarte, A., Coelho, D., Tomas, N., 2010.Photovoltaic integration in buildings: a case study in Portugal. Proceedings of the 4th WSEAS International Conference on Energy Plan-ning, Energy Saving, Environmental Education (EPESE '10) and the 4th WSEAS Inter-national Conference on Renewable Energy Sources (RES '10), Kantaoui, Sousse, Tunisia, May 3–6, 2010, pp. 119–123.
Gleick, P.H., 1996.Basic water requirements for human activities: meeting basic needs. Water Int. 21, 83–92.
Hoover, J.H., Scott, C.A., 2009.Electricity for water and wastewater services in Arizona. Udall Center for Studies in Public Policy meeting, June16 2009, University of Arizona (2009).
Instituto Nacional de Estatistica (INE), 2010.Inquérito ao consumo de energia no Setor doméstico. Instituto Nacional de Estatistica (INE), I.P, Lisboa.
Kenway, S.J., Priestley, A., Cook, S., Seo, S., Inman, M., Gregory, A., Hall, M., 2008.Energy Use in the Provision and Consumption of Urban Water in Australia and New Zealand. CSIRO and Water Services Association of Australia.
Kenway, S.J., Lant, P., Priestley, A., Daniels, P., 2011.The connection between water and energy in cities - a review. Water Sci. Technol. 63 (9), 1983–1990.
Larkin, N., 2011. Money Matter Story: Tips on How to Cut Your Power Bills.http://www. news.au.comFinance.
Munro, B.H., 2001.Statistical Methods for Health Care Research. fourth ed. Philadelphia, New York, Baltimore, Lippincott.
Plappally, A.K., Lienhard, V.J.H., 2012.Energy requirements for water production, treat-ment, end use, reclamation and disposal. Renew. Sust. Energ. Rev. 16, 4818–4848.
PNEUA, 2001.Ministério do Ambiente e do Ordenamento do Território– Estudo elaborado pelo Laboratório Nacional de Engenharia Civil (LNEC) com apoio do Instituto Superior da Agronomia (ISA) (Lisboa).
Ramos, H., Vieira, F., Covas, D., 2010.Energy efficiency in water supply system: energy consumption and CO2emission. Water Sci. Eng. 3 (3), 331–340.
Silva-Afonso, A., Rodrigues, C., 2008.Water efficiency of products and buildings: the im-plementation of certification and labelling measures in Portugal. Proceedings – CIB W062 2008– 34th International Symposium of Water Supply and Drainage for Build-ings. HKPU, Hong-Kong, China.
Silva-Afonso, A., Rodrigues, F., Pimentel-Rodrigues, C., 2011.Assessing the impact of water efficiency in energy efficiency and reducing GHG emissions: a case study. Int. J. Energy Environ. 5 (4), 541–548.
Walker, G., Higgins, V., 2007.Preliminary Analysis: Household Water Efficiency in England, Wales and Scotland: Results from December 07 IpsosMORIpoll, Waterwise/MORI Survey Report: Water Efficiency in England, Scotland and Wales.
Willis, R.M., Stewart, R.A., Panuwatwanich, K., Jones, S., Kyriakides, A., 2010.Alarming vi-sual display monitor saffecting shower end use water and energy conservation in Australian residential households. Resour. Conserv. Recycl. 54, 1117–1127.
Yu, B., Zhang, J., Fujiwara, A., 2011.Representing in-home and out-of-home energy con-sumption behaviour in Beijing. Energ Policy 39, 4168–4177.
Zhang, X., Vesselinov, V.V., 2016.Energy-water nexus: balancing the tradeoffs between two-level decision makers. Appl. Energy 183, 77–87.
Fig. 3. Relationship between water consumption (m3