1
ACCEPTED version by the Nutrition in Clinical Practice after peer review 2
3
Finding the best waist circumference measurement protocol in patients with Non-4
alcoholic Fatty Liver Disease 5
6
Short title: Waist circumference in Liver Disease 7
Nuno M. Pimenta, PhD 1,2, §, Helena Santa-Clara, PhD1, Xavier Melo, MS1,2, Helena Cortez-Pinto, PhD3,
8 José Silva-Nunes, PhD4, Luís B. Sardinha, PhD1 9 10 1 Exercise and Health Laboratory, Interdisciplinary Centre for the Study of Human Performance, Faculty 11 of Human Kinetics, University of Lisbon, Cruz-Quebrada, Portugal; 12 2 Sport Sciences School of Rio Maior, Polytechnic Institute of Santarém, Portugal; 13 3 Unidade de Nutrição e Metabolismo, IMM, Faculty of Medicine, University of Lisbon; Santa Maria 14 Hospital, Lisbon, Portugal; 15 4 Curry Cabral Hospital, Lisbon, Portugal. 16 17 Keywords: Waist Circumference; Fatty Liver; Body Composition; Body Fat; Anthropometry; body 18 circumferences; DXA; Hepatic Steatosis 19 20 Email addresses: 21 Nuno M. Pimenta: [email protected] 22 Helena Santa-Clara: [email protected] 23 Xavier Melo: [email protected] 24 Helena Cortez-Pinto: [email protected] 25 José Silva-Nunes: [email protected] 26
Luís B. Sardinha: [email protected] 27
Abstract
28 Background 29 Central fat accumulation is important in Non-alcoholic Fatty Liver Disease (NAFLD) etiology. It is 30 unknown weather any commonly used waist circumference (WC) measurement protocol (mp), as whole 31 and central fat accumulation marker, is preferable for patients with NAFLD. The present study sought to 32 find a preferable WC mp to be used in patients with NAFLD, based on three-fold criterion. 33 Material and methods 34 Body fat (BF) was assessed through Dual Energy X-ray Absorptiometry (DXA) in 28 patients with NAFLD 35 (19 males, 51 + 13 yrs, and 9 females, 47 + 13 yrs). WC was measured using four different WC mp (WC1- 36 narrowest torso, WC2- just above iliac crest, WC3- mid-distance between iliac crest and last rib and 37 WC4- at the umbilicus). 38 Results 39 All WC measurements were highly correlated particularly with central BF depots, including trunk BF 40 (r=0.78; r=0.82; r=0.82; r=0.84; respectively for WC1, WC2, WC3 and WC4) abdominal BF (r=0.78; 41 r=0.78; r=0.80; r=0.72; respectively for WC1, WC2, WC3 and WC4) and central abdominal BF (r=0.76; 42 r=0.77; r=0.78; r=0.68; respectively for WC1, WC2, WC3 and WC4), controlling for age, sex and body 43 mass index. There were no differences between the correlation coefficients obtained between all 44 studied WC measurements and each whole and central analyzed BF variable. 45 Conclusion 46 All studied WC mp seem suitable for use in patients with NAFLD, particularly as central BF clinical 47 assessment tool, though not interchangeably. Hence biological and precision criteria alone did not 48 sanction the superiority of any WC mp. Practical criteria may endorse WC measured at the iliac crest. 49 50 51Introduction
52
Non-Alcoholic Fatty Liver Disease (NAFLD) is a rising recognized condition that has 53
caught growing attention. In an advanced stage NAFLD can ultimately lead to advanced fibrosis, 54
cirrhosis, liver failure and death 1,2. NAFLD is also associated with increased risk of
55 cardiovascular events 3. Both central body fat (BF) and insulin resistance have been found to 56 increase the risk of NAFLD 4, furthermore whole and particularly central BF may also increase 57 the risk for NAFLD by its strong association with insulin resistance 5,6. Excess both whole and 58 central BF accumulation is also a known cardiovascular risk factor 7,8. These evidences arise the 59 importance, particularly in this higher risk sub-population, of finding risk related clinical body 60 composition surrogates, and potential therapy targets. 61
Waist circumference (WC) measurement is widely used in different settings and 62
populations 9–11, including the sub-population of patients with NAFLD 12. WC has been
63
considered a proper surrogate of body composition, particularly when focusing on body fat 64
distribution 9,13,14, and a risk factor for NAFLD 15. In patients with NAFLD WC has been found to
65
be associated with several metabolic impairments including insulin resistance 5,16 as well as liver
66
fat 12 and NAFLD severity 17. Even though widely used, there is currently no optimal and 67
uniquely proposed WC measurement protocol (WCmp) to be used in clinical practice, either in 68
the general population as in specific higher risk sub-populations. Several WCmp have been 69
suggested but scientific rational is lacking to recommend one single protocol 10,18. Suggested
70 protocols differ mainly on the anatomical landmarks and correspondent measuring sites. The 71 most commonly used WC measurement sites are the midpoint between the lowest rib and iliac 72 crest, the umbilicus and the minimal waist, still a fourth measurement site has also been used 73
and endorsed, which is at the superior border of the iliac crest 9,10. Nevertheless several other 74 measuring sites have been sparsely used 10. 75 To our knowledge this is the first study to look into the usefulness of commonly used 76
waist circumference measurements as surrogates of whole and central body fat content in 77
patients with NAFLD. Therefore the aim of the present study was to find which of the most 78
used WCmp is the best for use in clinical practice in patients with NAFLD, considering a 79
threefold criteria: the WC most closely associated with whole and central BF content in patients 80
with NAFLD; the most precise WCmp; the most practical WCmp to use in clinical practice. 81
Materials and methods
82
Subjects:
83
This study was conducted at Exercise and Health Laboratory, from the Interdisciplinary 84
Centre for the Study of Human Performance (Faculty of Human Kinetics, Technical University of 85
Lisbon, Portugal). To be selected for the present study subjects had to be over 18 years of age, 86
diagnosed with NAFLD, without history of hepatotoxic substances intake (eg. steroids) and 87
tobacco consumption. Exclusion criteria included alcohol consumption over 20 gr/day; the 88
presence of other possible causes for fatty liver disease, including hepatitis, self-immune 89
disease and others; any physical and/or mental disabilities or any condition that constituted an 90
absolute restriction from exercise, or diseases, other than metabolic (insulin resistance, 91
hypertension or dyslipidemia), with mandatory specific pharmacologic therapy (eg. Asthma or 92
other). We studied 28 patients with NAFLD (19 males, 51 + 13 yrs, and 9 females, 47 + 13 yrs) 93
who were diagnosed through liver biopsy or ultrasound. Subjects were recruited from the 94
outpatient periodical medical consultations in Santa Maria Hospital and Curry Cabral Hospital; 95
59 consecutive patients were selected based on selection criteria; 37 of the selected subjects 96
accepted to participate and 28 were found eligible to enter the study after exclusion criteria 97
was considered. Subjects were taking one or more of the following medication: platelet 98
inhibitors, angiotensin-converting enzyme inhibitors, nitrates, statins, ezetimibe, nicotinic acid 99
and biguanides with similar use among both genders. All participants signed an informed 100
consent before being included in the present study and undergoing any study procedure. All 101
methods used in the present study complied with good ethics and Portuguese laws and were 102
approved by both the Portuguese Foundation for Science and Technology and Faculty of 103 Human Kinetics institutional review boards. 104 Body composition: 105 Body composition was assessed using Dual Energy X-ray Absorptiometry (DXA) (Explorer 106
W, Hologic; Waltham, MA, USA; Fan bean mode) whole body scans and anthropometric 107 measurements. Repeated measurements in 18 young adults showed a coefficient of variation 108 (CV) of 1.7% for total BF mass and 1.5% for total %BF. All scans were made in the morning after 109 an overnight 12-hour fast. Quality control with spine phantom was made every morning, and 110
with step phantom every week. By default DXA software (QDR for windows, version 12.4) 111
estimates the head, trunk, arms and legs, both left and right, regions fat content, according to a 112
three-compartment model (fat mass, lean tissue and bone mass). Whole BF, sometimes just 113
referred to as BF, includes the fat mass of the whole body, as opposed to central BF, which 114 refers to the trunk BF, abdominal BF and central abdominal BF variables, as analyzed by DXA 115 regions of interest. The trunk region of interest (ROI) (CV = 0.5%) includes chest, abdomen and 116 pelvis, to provide estimates of trunk BF and trunk %BF. All scans were submitted to additional 117 analysis by ROI to assess absolute a relative fat content of the abdominal (Abd BF and Abd %BF) 118 and central abdominal regions (CAbd BF and CAbd %BF) (Fig. 1) (CV = 1.0 %). The upper and 119 lower limits of the abdominal and central abdominal ROI were determined as the upper edge of 120
the second lumbar vertebra to the lower edge of the fourth lumbar vertebra, respectively 19–21. 121
The sides’ limits of the abdominal ROI were determined as to include all trunk length, but 122 exclude any upper limb scan area 20,21, whereas the vertical sides of central abdominal ROI were 123 the continuation of the lateral sides of the ribs cage, as to exclude the lateral subcutaneous fat 124 of the trunk, including the anterior and posterior subcutaneous abdominal fat, as well as the 125
intra-abdominal fat 19, as seen in figure 1. Absolute and relative BF content results were
126
registered to the nearest 0.01kg and 0.1%, respectively. 127
Anthropometric measurements consisted of weight, height and body mass index (BMI) 128
as well as WC. Some standardization procedures were taken into account, as proposed by 129
Agarwal and colleagues 22 to avoid any bias in the measurements, therefore all WC
130
measurements were made with subjects in a standing comfortable position, in their underwear, 131
in a 12-hour fasting state. All WC measurements were made by the same technician, who was a 132
trained level 2 technician, certified by the International Society for the Advancement of 133
Kinanthropometry, using an inelastic flexible metallic tape (Lufkin - W606PM, Vancouver, 134
Canada) parallel to the floor after a tidal expiration, to the nearest 0.1cm. The WC 135
measurement sites in the present study were the narrowest torso (WC1) 23,24, also called
136
minimal waist10, superior border of the iliac crest (WC2) 18,25, midpoint (WC3) 26 and umbilicus
137
(WC4) 27,28, as detailed in table 1, and represented in figure 2. These are the most commonly
138
used protocols endorsed by sound authorities in this field 9,10. Time length of each WC
139
measurement, including all procedures, from brief initial instruction results registering, was 140
recorded in seconds, to the nearest 1 second, with a standard watch chronometer (model 141 RS800, Polar, Oulu, Finland). Body weight was measured to the nearest 0.1kg, and height was 142 measured to the nearest 0.1 cm, on a scale with an attached stadiometer (model 770, Seca; 143 Hamburg, Deutschland), according to standard protocol 23. Both weight and height were used 144
to calculate the subjects’ BMI, by dividing the weight, in kg, by the squared height, in meters 145 (BMI = weight [kg] / height [m]2). All anthropometric measurements were repeated two times, 146 and if the second differed more than 1cm (for waist and height measurements) or 0,5kg (for 147 weight measurement) from the first measurement, a third measurement was carried out. We 148 always considered the result obtained in the second measurement unless a third measurement 149 was carried out. When a third measurement was taken we considered the mode or, if mode 150 was absent, the median value of all three measurements. By using this procedure we sought to 151
always use the most suitable value that was actually measured on the subjects (instead of 152 mean values). 153 Statistical methods: 154 Descriptive statistics are presented as mean ± sd and range for all analyzed variables. 155 The Gaussian distribution of the data was assessed with the Shapiro-Wilk goodness-of-fit test. 156 Levenne test was used for assessing sample variance homogeneity. Paired-samples T test was 157
used to compare WC results obtained with different WCmp. When homogeneity of variance 158 was not present, the corrected significance values of T test were used. The association between 159 whole and central BF and the results obtained with each WCmp was assessed using partial as 160 well as part, also called semipartial 29, correlations, controlling for age and sex and BMI. Both 161
partial and semipartial correlation techniques allow controlling for confounders but, while 162
partial correlation remove from the analysis the confounders-related variation of both 163
dependent and independent variables, the semipartial technique only removes from the 164
correlation analysis the confounder-related variation of the independent variable 29. In order to
165
accomplish a statistical power of 80% (β = 0.20) at a statistical significance level of 5% (α = 166
0.05), only coefficients of correlation equal or superior to 0.5, corresponding to a large effect 167
size, were considered significant. This is in accordance with Cohen and Cohen 29 to assure that
results are unexposed to type I and II errors, despite an rather modest sample size. Pairs of 169
correlation coefficients obtained between each WC with each dependent variable were 170
compared, using Z statistic, to find if any WC was more closely associated with whole and 171
central BF. To evaluate the precision of the studied WCmp we calculated coefficients of 172
variation for the repeated measurements, and compared them between WCmp using paired-173
samples T test. To respond to the third criteria, comprised in the aim of the present study, 174
paired-samples T test was used to compare the time consumption of WC measurement 175
between different measurement protocols. Statistical calculations were performed using the 176 IBM SPSS Statistics version 19 (SPSS, inc, Chicago, IL), except for z statistic which was performed 177 using Medcalc version 11.1.1.0 (MedCalc Software, Mariakerke, Belgium). 178
Results
179Mean values for all studied variables are presented in table 2. From among the 28 180
studied patients with NAFLD obesity was present in 9 subjects (3 were female), according to 181
BMI classification, yet mean BMI showed no differences between sexes (p=0.075 on 182
independent samples t test) and was considered to be in the overweight category for the whole 183
studied sample. BMI was also not related with subjects’ age (r= -0.222; p=0.266 on Pearson 184
correlation). Results for WC measurements were considered to be different between all studied 185
WCmp, for instance WC4 showed the highest values whereas WC1 showed the lowest, and 186 WC3 was smaller than WC2, as shown in table 3. 187 Table 4 shows the results for partial and semipartial correlations between each WC and 188 each whole or central studied BF depot controlled for sex, age and BMI. All WC results were 189 somewhat correlated with the overall studied DXA assessed BF depots, controlling for age, sex 190
and BMI, often showing correlation coefficients above 0.5. WC4 was correlated with both 191
absolute and relative whole BF, while WC1, WC2 and WC3 were correlated only with the 192
absolute values of whole BF, but only in partial correlations. All studied WC were correlated 193
with absolute and relative trunk BF, in partial correlations, however, in semipartial correlations, 194
this was true only for the absolute values of trunk BF. WC 1, WC2 and WC3 were associated 195
with absolute a relative values of abdominal fat depots, except for WC4 which was only 196
correlated with Abd BF and Cabd BF, in partial correlations. Semipartial correlations only 197 confirmed the correlation with Abd BF and CAbd BF, for all WC. 198 Table 5 show the results for the comparison between the correlation coefficients listed 199 in table 4. Comparisons were made between pairs of competing WC correlations results with 200 each dependent variable. No differences were found between all performed correlations with 201 each studied BF depot. 202 Table 6 shows both the coefficients of variation for the WC measurements according to 203 the studied protocols, as well as the mean±sd time spent for WC measurements using each of 204 the studied WCmp. Coefficient of variation was not different irrespectively of the WCmp used. 205 Time spent in each measurement was longer for WC3 as compared to all others. WC2 was more 206 time consuming than both WC1 and WC4. Both of the latest showed no differences between 207
their mean time lengths of measurements. In summary time length of measurement of the 208 studied protocols was as follows: WC1 and WC4 < WC 2 < WC3. 209
Discussion
210 Even though WC has been a widely used measure in the sub-population of patients with 211NAFLD 12,30, to our knowledge this is the first study to focus on the comparison of different
212
WCmp based on a scientific and practical rational. The prevalence of high levels of BMI, 213
including obese and morbidly obese patients, in the present sample was expected since 214
obesity, along with insulin resistance, have been identified among the strongest risk factors for 215 NAFLD, and therefore highly prevalent in this sub-population 31–34. WC results were also quite 216 high which was consistent with BMI levels. The magnitudes of WC mean values were different 217 according to the protocol in use, as has been previously reported in different populations 35–37, 218 meaning they are not interchangeable. This has imperative implications advising the consistent 219 use of one single protocol to avoid misinterpretations either when monitoring longitudinal data 220 as when using cut-off for classification of WC values and subjects subject’s risk level appraisal 221
35,38,39. Based on the small or absent differences reported, particularly in men, between
222
measurements of WC2 (at the superior border of the iliac crest) and WC3 (at the midpoint 223
between lowest rib and iliac crest) 35–37, it was proposed that current WC thresholds,
224
generalized using WHO WCmp (WC3), could be applied to measurements using WC2 10. Our
225
data do not support the mentioned generalization for patients with NAFLD, yet this analysis 226
was not in the aim of the present study, and additional research is needed to look into sex 227
differences and other possible influencing variables. These results reinforce the necessity of 228 searching for the most useful, consensual and standardized WCmp for use in clinical practice 229 with patients with NAFLD. 230 In the present sample of patients with NAFLD WC was highly associated with whole and 231
central BF, adjusted for age, sex and BMI. The association of WC with BC, particularly with 232
central BF has long been reported in diverse populations 40–42. Wang and colleagues (2003) had
233
already found stronger associations between WC and absolute central BF, as opposed to either 234
whole BF or any relatively expressed BF depot, assessed by DXA. In the present report, the 235
results obtained in partial correlation may suggest that WC1, WC2 and WC3 are more 236
consistently associated with central BF, and therefore seem better markers of a more 237
hazardous fat accumulation in the studied sample of patients with NAFLD, as opposed to WC4 238
which seems more consistently associated with Whole BF. When the results obtained in 239
semipartial correlations were taken into consideration, all studied WC were similarly only 240 correlated with central BF accumulation, namely trunk BF, Abd BF and CAbd BF, controlled for 241 age, sex and BMI, revealing a cognate association pattern among different WCmp. Central BF 242 accumulation has been found highly important in NAFLD etiology (Park et al. 2007) and is also a 243 risk factor for cardiovascular diseases incidence and outcomes 7,8, which is increased in NAFLD 244 (Targher et al. 2005). The present results support the use of WC measurement in patients with 245
NAFLD, as a cost-effective screening procedure, to assess hazardous body composition 246 phenotypes, namely central BF accumulation, in routine clinical appraisals, irrespective of the 247 WCmp in use. 248 Comparisons between pairs of competing WC correlations results with each dependent 249
variable showed no differences meaning all WC results are similarly associated with the 250
analyzed BF depots, irrespectively of the WCmp used, in the studied sample of patients with 251
NAFLD. Never the less, conflicting results can be found in general population 36,37. A report 252
focusing on different WC measuring sites, including at the superior border of the iliac crest 253
(WC2) and also at the midpoint between lowest rib and iliac crest (WC3), found differences 254
between correlation coefficients, in partial correlations, with abdominal adipose tissue 255
assessed with magnetic resonance imaging, in women but not in men 37. In agreement with the
256
present report, Wang and colleagues 36 found WC correlations to be stronger with trunk BF,
257
regardless of sex and WCmp. The present results showing a preferable association between WC 258
and preferably central BF, regardless of WCmp, together with the well-established recently 259
reported 10 relationships between WC and morbidity of cardiovascular disease and diabetes
260
and with cardiovascular and all-cause mortality, also rather unaffected the use of different 261
WCmp, settle both the importance of WC measurement in the screening of patients with 262
NAFLD as well as the usefulness of WC measurement regardless the WCmp in use. 263
In the absence of biological support for the use of one preferable WCmp, additional 264
criteria have been suggested in the attempt to substantiate the choice of one particular WCmp, 265
including the use of bony landmarks and ease of measurement 9,10,18. It was argued that the use
266
of bony landmarks could be preferable due to increased precision 9 or reliability 10,18. The
267
present data do not confirm better precision of any particular WCmp, as assessed by the 268
comparison of coefficients of variation obtained for each WCmp. Similar results have been 269
reported elsewhere in the general population 35,36. Additional research is warranted to support
270
or reject the preferable use of bony landmarks, particularly for longitudinal assessments. Ease 271
of measurement, meaning that WCmp should require less specific training and be less time 272 consuming, has been proposed as an important criteria for the adoption of any measurement 273 by general public and practitioners in routine clinical practice 9. 274 It has been suggested that WC measured at the superior border of the iliac crest would 275 be more likely adopted by general public and practitioners as it requires only the palpation of 276
one bony landmark 18 however this was not confirmed by practice nor research 9,10. Bony
277
landmarks have been subjectively reported to require more training and experience of 278
observers, yet, in the present study only the lowest rib landmark proved demanding. Limited 279
time availability has been proposed as one of the reasons for not using WC measurement in 280
routine clinical practice 9. Present data also objectively confirm a previous report 35 that
281
subjectively pointed WC measurement at the midpoint between lowest rib and iliac crest as 282
more time consuming than when using other studied WCmp. 283
There are several strengths and limitations to this study. The studied WCmp do not cover all 284
protocols existent in the literature, yet the focus was set on the most commonly used and 285
endorsed by prominent institutions for use in clinical setting 9,10,18. Also the used BC assessment 286
method (DXA), a gold standard instrument to assess BC in a three-compartment model, is 287 unable to determine visceral adiposity independently from subcutaneous fat. However strong 288 correlation between abdominal fat estimated from selected DXA ROI and visceral fat measured 289 directly by magnetic resonance imaging (Park et al. 2002) and computed tomography 43,44 have 290 been reported. Due to the cross-sectional approach used, the usefulness of the studied WCmp 291 to assess longitudinal changes in the studied BF depots could not be established, based on the 292 present results. Finally, the size of the sample was rather constrained due to difficulties in the 293 recruitment of such a specific sub-population. 90 individuals were coveted to be included in the 294 present sample in the initial research project. This would allow coefficients of correlation as low 295
as 0.3, traditionally corresponding a moderate effect size, to be considered significant and 296
unexposed to type I and II errors 29. Unfortunately, despite all efforts on behalf of everyone
297 involved in this research project, only 28 patients with NAFLD could be recruited, meeting all 298 inclusion and exclusion criteria. Consequently, only associations equal or higher to r=0.50 could 299 be considered to attain minimal statistical power of 80% and statistical significance of 5%, and 300 could be considered fairly unexposed to type I and type II errors 29. Nevertheess the aim of the 301 present study was to find the preferable WCmp to use with patients with NAFLD, which should 302
be found at the higher end of correlational range, therefore, the inability to find significant 303
associations lower than r=0.5, though interesting are not the aim of the present study. 304
The present study confirms the strong association between WC and central BF, even 305
after removing the effect of age, sex and BMI, regardless of the WCmp in use. Moreover, all 306
tested WCmp could be considered useful and important low-cost assessment tools for clinical 307
practice, though not interchangeable. This irrespective usefulness is bolstered by the similar 308
precision found for all studied WCmp. On the other hand there could not be established one 309
single preferable WCmp for the present sample of patients with NAFLD based on biological 310 criteria. The use of bony landmarks showed no superiority, though research is needed to assess 311 its’ relevance in longitudinal assessments. WC measured at the superior border of the iliac crest 312 may be a good choice if a bony landmark is valued together with time consuming. 313
Acknowledgements
314 The first author of this paper is supported by a research grant from the Foundation for 315 Science and Technology (FCT), Ministry of Education and Science of Portugal (grant: SFRH/ BD/ 316 70515/ 2010). 317 The present study was funded by: the Centre for the Study of Human Performance, 318 Portuguese Foundation for Science and Technology, Lisbon, Portugal; 319References
320 1. Angulo P. Nonalcoholic fatty liver disease. N. Engl. J. Med. 2002;346(16):1221–1231. 321 2. Hall P, Kirsch R. Pathology of hepatic steatosis, NASH and related conditions. In: Farrell G, 322 George J, Hall P, McCullough A, eds. Fatty Liver Disease. NASH and Related Disorders. 323 Oxford: Blackwell Publishing; 2005:13-22. 324 3. Targher G, Bertolini L, Poli F, et al. Nonalcoholic fatty liver disease and risk of future 325 cardiovascular events among type 2 diabetic patients. Diabetes 2005;54(12):3541-6. 326 4. Park SH, Kim BI, Kim SH, et al. Body fat distribution and insulin resistance: beyond obesity 327 in nonalcoholic fatty liver disease among overweight men. J Am Coll Nutr 2007;26(4):321-328 6. 329 5. Cheung O, Kapoor A, Puri P, et al. The impact of fat distribution on the severity of 330 nonalcoholic fatty liver disease and metabolic syndrome. Hepatology 2007;46(4):1091-331 100. doi:10.1002/hep.21803. 332 6. McCullough A. The epidemiology and risk factors of NASH. In: Farrell G, George J, Hall P, 333 McCullough A, eds. Fatty Liver Disease. NASH and Related Disorders. Oxford: Blackwell 334 Publishing; 2005:23-37. 3357. Fan J, Song Y, Chen Y, Hui R, Zhang W. Combined effect of obesity and cardio-metabolic 336 abnormality on the risk of cardiovascular disease: A meta-analysis of prospective cohort 337 studies. Int. J. Cardiol. 2013;168(5):4761-4768. doi:10.1016/j.ijcard.2013.07.230. 338 8. Ritchie SA, Connell JMC. The link between abdominal obesity, metabolic syndrome and 339 cardiovascular disease. Nutr. Metab. Cardiovasc. Dis. 2007;17(4):319-326. 340 doi:10.1016/j.numecd.2006.07.005. 341 9. Klein S, Allison DB, Heymsfield SB, et al. Waist Circumference and Cardiometabolic Risk: a 342 Consensus Statement from Shaping America’s Health: Association for Weight 343 Management and Obesity Prevention; NAASO, the Obesity Society; the American Society 344 for Nutrition; and the American Diabetes Association. Obes. Silver Spring 2007;15(5):1061-345 7. doi:10.1038/oby.2007.632. 346 10. Ross R, Berentzen T, Bradshaw AJ, et al. Does the relationship between waist 347 circumference, morbidity and mortality depend on measurement protocol for waist 348 circumference? Obes. Rev. 2008;9(4):312-325. doi:10.1111/j.1467-789X.2007.00411.x. 349 11. Nishida C, Ko GT, Kumanyika S. Body fat distribution and noncommunicable diseases in 350 populations: overview of the 2008 WHO Expert Consultation on Waist Circumference and 351 Waist-Hip Ratio. Eur J Clin Nutr 2010;64(1):2-5. doi:10.1038/ejcn.2009.139. 352 12. Jakobsen M, Berentzen T, Sorensen T, Overvad K. Abdominal Obesity and Fatty Liver. 353 Epidemiol. Rev. 2007;29(1):77-87. doi:10.1093/epirev/mxm002. 354 13. Janssen I, Katzmarzyk PT, Ross R. Body mass index, waist circumference, and health risk: 355 evidence in support of current National Institutes of Health guidelines. Arch Intern Med 356 2002;162(18):2074-9. 357 14. Chan DC, Watts GF, Barrett PH, Burke V. Waist circumference, waist-to-hip ratio and body 358 mass index as predictors of adipose tissue compartments in men. QJM 2003;96(6):441-7. 359 15. Kim HJ, Lee KE, Kim DJ, et al. Metabolic significance of nonalcoholic fatty liver disease in 360 nonobese, nondiabetic adults. Arch Intern Med 2004;164(19):2169-75. 361 doi:10.1001/archinte.164.19.2169. 362 16. Papatheodoridis GV, Goulis J, Christodoulou D, et al. High prevalence of elevated liver 363 enzymes in blood donors: associations with male gender and central adiposity. Eur J 364 Gastroenterol Hepatol 2007;19(4):281-7. doi:10.1097/MEG.0b013e328011438b. 365 17. Eguchi Y, Eguchi T, Mizuta T, et al. Visceral fat accumulation and insulin resistance are 366 important factors in nonalcoholic fatty liver disease. J Gastroenterol 2006;41(5):462-9. 367 doi:10.1007/s00535-006-1790-5. 368 18. McGuire KA, Ross R. Revised Protocol for Measurement of Waist Circumference. In: CSEP, 369 ed. Canadian Physical Activity, Fitness and Lifestyle Approach. 3rd ed. Ottawa, Ont.: 370 Canadian Society for Exercise Physiology; 2010:13-14. 371
19. Kamel EG, McNeill G, Van Wijk MC. Usefulness of anthropometry and DXA in predicting 372 intra-abdominal fat in obese men and women. Obes Res 2000;8(1):36-42. 373 20. Park YW, Heymsfield SB, Gallagher D. Are dual-energy X-ray absorptiometry regional 374 estimates associated with visceral adipose tissue mass? Int J Obes Relat Metab Disord 375 2002;26(7):978-83. 376 21. Pimenta NM, Santa-Clara H, Sardinha LB, Fernhall B. Body Fat Responses to a 1-Year 377 Combined Exercise Training Program in Male Coronary Artery Disease Patients. Obesity 378 2013;21(4):723-30. doi:10.1038/oby.2012.150. 379 22. Agarwal SK, Misra A, Aggarwal P, et al. Waist circumference measurement by site, posture, 380 respiratory phase, and meal time: implications for methodology. Obes. Silver Spring 381 2009;17(5):1056-61. doi:10.1038/oby.2008.635. 382 23. Lohman TG, Roche AF, Martorell R. Anthropometric Standardization Reference Manual. 383 Champaign: Human Kinetics; 1988. 384 24. Marfell-Jones M, Olds T, Stewart A, Carter J. International Standards for Antropometric 385 Assessment. Potchefstroom: South Africa: International Society for the Advancement of 386 Kinanthropometry; 2006. 387 25. NIH. Plan and operation of the Third National Health and Nutrition Examination Survey, 388 1988-94. Series 1: programs and collection procedures. Vital Health Stat 1994;1(32):1-407. 389 26. WHO. Waist Circumference and Waist–hip Ratio. Report of a WHO Expert Consultation, 390 Geneva, 8–11 December 2008. Geneva: World Health Organization; 2011. 391 27. Rector RS, Thyfault JP. Does physical inactivity cause nonalcoholic fatty liver disease? J. 392 Appl. Physiol. 2011;111(6):1828-1835. doi:10.1152/japplphysiol.00384.2011. 393 28. Targher G, Bertolini L, Rodella S, et al. NASH Predicts Plasma Inflammatory Biomarkers 394 Independently of Visceral Fat in Men. Obesity 2008;16(6):1394-1399. 395 doi:10.1038/oby.2008.64. 396 29. Cohen J, Cohen P. Applied Multiple Regression/Correlation Analysis for the Behavioral 397 Sciences. 2nd ed. Hillsdale, NJ: Lawrence Erkbaum Associates, Inc.; 1983. 398 30. Machado MV, Cortez-Pinto H. No need for a large belly to have NASH. J Hepatol 399 2011;54(6):1090-3. doi:10.1016/j.jhep.2011.01.010. 400 31. Nomura H, Kashiwagi S, Hayashi J, Kajiyama W, Tani S, Goto M. Prevalence of fatty liver in 401 a general population of Okinawa, Japan. Jpn J Med 1988;27(2):142-9. 402 32. Clark JM. The epidemiology of nonalcoholic fatty liver disease in adults. J Clin 403 Gastroenterol 2006;40 Suppl 1:S5-10. doi:10.1097/01.mcg.0000168638.84840.ff. 404 33. Bellentani S, Saccoccio G, Masutti F, et al. Prevalence of and risk factors for hepatic 405 steatosis in Northern Italy. Ann Intern Med 2000;132(2):112-7. 406
34. Browning JD, Szczepaniak LS, Dobbins R, et al. Prevalence of hepatic steatosis in an urban 407 population in the United States: impact of ethnicity. Hepatology 2004;40(6):1387-95. 408 35. Mason C, Katzmarzyk PT. Variability in waist circumference measurements according to 409 anatomic measurement site. Obes. Silver Spring 2009;17(9):1789-95. 410 doi:10.1038/oby.2009.87. 411 36. Wang J, Thornton JC, Bari S, et al. Comparisons of waist circumferences measured at 4 412 sites. Am. J. Clin. Nutr. 2003;77(2):379–384. 413 37. Bosy-Westphal A, Booke CA, Blocker T, et al. Measurement site for waist circumference 414 affects its accuracy as an index of visceral and abdominal subcutaneous fat in a Caucasian 415 population. J Nutr 2010;140(5):954-61. doi:10.3945/jn.109.118737. 416 38. Willis LH, Slentz CA, Houmard JA, et al. Minimal versus umbilical waist circumference 417 measures as indicators of cardiovascular disease risk. Obesity 2007;15(3):753–759. 418 39. Mason C, Katzmarzyk PT. Effect of the site of measurement of waist circumference on the 419 prevalence of the metabolic syndrome. Am J Cardiol 2009;103(12):1716-20. 420 doi:10.1016/j.amjcard.2009.02.018. 421 40. Janssen I, Heymsfield SB, Allison DB, Kotler DP, Ross R. Body mass index and waist 422 circumference independently contribute to the prediction of nonabdominal, abdominal 423 subcutaneous, and visceral fat. Am J Clin Nutr 2002;75(4):683-8. 424 41. Lean ME, Han TS, Deurenberg P. Predicting body composition by densitometry from 425 simple anthropometric measurements. Am J Clin Nutr 1996;63(1):4-14. 426 42. Han TS, McNeill G, Seidell JC, Lean ME. Predicting intra-abdominal fatness from 427 anthropometric measures: the influence of stature. Int J Obes Relat Metab Disord 428 1997;21(7):587-93. 429 43. Bertin E, Marcus C, Ruiz JC, Eschard JP, Leutenegger M. Measurement of visceral adipose 430 tissue by DXA combined with anthropometry in obese humans. Int J Obes Relat Metab 431 Disord 2000;24(3):263-70. 432 44. Snijder MB, Visser M, Dekker JM, et al. The prediction of visceral fat by dual-energy X-ray 433 absorptiometry in the elderly: a comparison with computed tomography and 434 anthropometry. Int J Obes Relat Metab Disord 2002;26(7):984-93. 435 doi:10.1038/sj.ijo.0801968. 436 437 438
TABLES:
439
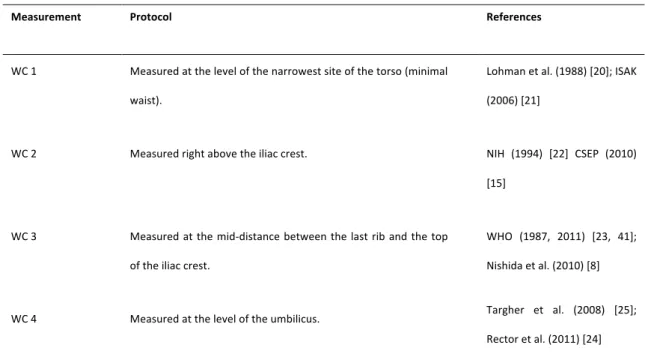
Table 1. Circumferences measurement protocols and references.
440
Measurement Protocol References
WC 1 Measured at the level of the narrowest site of the torso (minimal waist).
Lohman et al. (1988) [20]; ISAK (2006) [21]
WC 2 Measured right above the iliac crest. NIH (1994) [22] CSEP (2010) [15]
WC 3 Measured at the mid-distance between the last rib and the top of the iliac crest.
WHO (1987, 2011) [23, 41]; Nishida et al. (2010) [8]
WC 4 Measured at the level of the umbilicus. Targher et al. (2008) [25]; Rector et al. (2011) [24] WC – waist circumference; ISAK – The International Society for the Advancement of Kinanthropometry; NIH – National Institute of Health; CSEP – 441 Canadian Society of Exercise Physiology; WHO – World Health Organization. 442 443
Table 2. Descriptive data of the studied sample of patients with Non-Alcoholic Fatty Liver Disease.
444
Patients with NAFLD (n=28)
Variables Mean + sd * Min. – Max.
Age, yr (median, yr) 49.5 ± 12.8 (49) 25 – 68 Sex, n female (% female) 9 (32,1) Anthropometry Weight, kg 87.6 ± 12.7 66.2 – 115.8 Stature, cm 167.2 ± 9.2 149.5 – 183.7 BMI, kg/m2 (% obese) 29.1 ± 4.0 (32.1) 22.6 – 42.2 WC 1, cm 100.7 ± 8.2 86.0 – 119.8 WC 2, cm 104.8 ± 10.6 85.3 – 128.7 WC 3, cm 103.7 ± 10.4 85.7 – 129.3 WC 4, cm 106.3 ± 11.5 86.7 – 129.1 Whole and Regional Body Composition as assessed by DXA BF, kg (%) 27.2 ± 9.3 (31.31 ± 8.20) 13.7 – 51.2 (18.84 – 46.28) FFM, kg (%) 58.7 ± 9.1 (68.69 ± 8.20) 39.6 – 77.7 (53.72 – 81.16) Trunk BF, kg (%) 15.2 ± 5.2 (33.15 ± 7.65) 7.4 – 25.0 (20.87 – 48.01) Trunk FFM kg (%) 29.9 ± 3.9 (66.85 ± 7.65) 21.1 – 38.6 (51.99 –79.13) Appendicular BF, kg (%) 10.8 ± 4.8 (30.42 ± 10.39) 5.2 – 25.7 (13.63 – 50.40) Appendicular FFM, kg (%) 24.5 ± 5.1 (69.58 ± 10.39) 14.9 – 34.8 (49.60 – 86.37) Abdominal BF, kg (%) 3.5 ± 1.2 (37.57 ± 6.59) 1.7 – 6.3 (26.09 – 49.40) Central Abdominal BF, kg (%) 2.9 ± 0.8 (35.82 ± 5.70) 1.6 – 5.0 (24.28 – 44.64) BMI – body mass index; WC1 – Waist circumference as measured by Lohman et al. [20] and The International Society for the Advancement of Kinanthropometry (ISAK) 445 [21]; WC2 - Waist circumference as measured by the National Institute of Health (NIH) from the United States of America [22]; WC3 - Waist circumference as measured 446 by the World Health Organization (WHO) [41]; WC4 - Waist circumference as measured by Ross et al., Masson et al., Targher et al. and others [7, 25, 36]; DXA – Dual-447
energy X-ray Absorptiometry; BF – body fat; FFM – fat free mass; * Results are presented as mean ± standard deviation, unless otherwise noted; Min. – lowest observed 448 value; Máx. – highest observed value 449 450 451
Table 3. Mean differences and P values from paired samples T test used in the
452
comparison between waist circumference results obtained with different
453
measurement protocols, in 28 patients with NAFLD
454
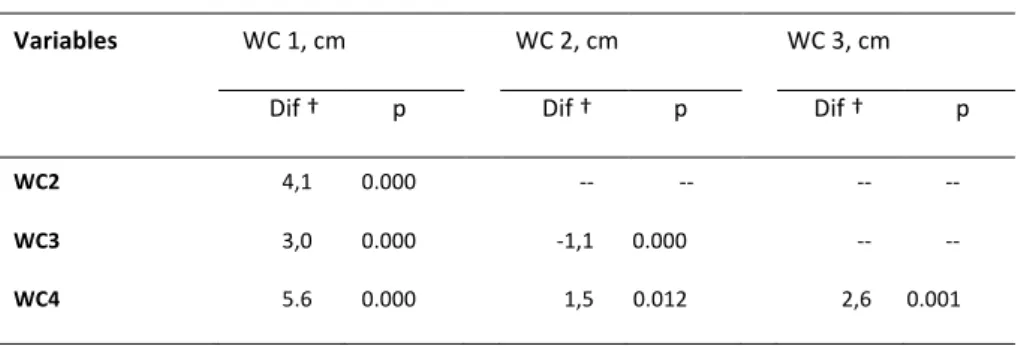
Variables WC 1, cm WC 2, cm WC 3, cm
Dif † p Dif † p Dif † p
WC2 4,1 0.000 -- -- -- --
WC3 3,0 0.000 -1,1 0.000 -- -- WC4 5.6 0.000 1,5 0.012 2,6 0.001
NAFLD – Non-Alcoholic Fatty Liver Disease; WC1 – Waist circumference measured minimal waist; WC2 - Waist
455
circumference measured just above iliac crest; WC3 - Waist circumference measured at mid-distance; WC4 - Waist
456
circumference measured at the umbilicus; † - difference between results obtained using WC protocols in the Left
457
column and the results from the WC protocols in the top line.
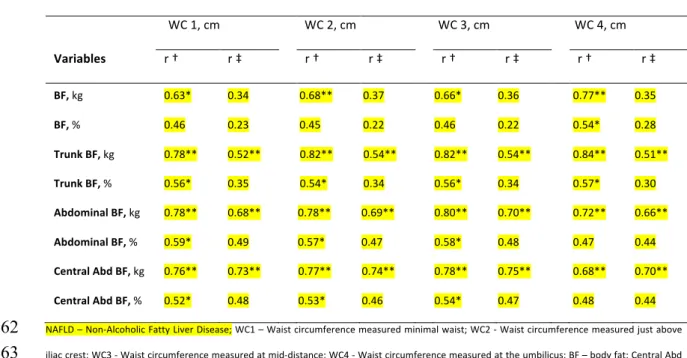
459 Table 4. Partial and semipartial correlations between waist circumferences, obtained using different 460 measurement protocols, and the studied body fat depots, in 28 patients with NAFLD. 461 WC 1, cm WC 2, cm WC 3, cm WC 4, cm Variables r † r ‡ r † r ‡ r † r ‡ r † r ‡ BF, kg 0.63* 0.34 0.68** 0.37 0.66* 0.36 0.77** 0.35 BF, % 0.46 0.23 0.45 0.22 0.46 0.22 0.54* 0.28 Trunk BF, kg 0.78** 0.52** 0.82** 0.54** 0.82** 0.54** 0.84** 0.51** Trunk BF, % 0.56* 0.35 0.54* 0.34 0.56* 0.34 0.57* 0.30 Abdominal BF, kg 0.78** 0.68** 0.78** 0.69** 0.80** 0.70** 0.72** 0.66** Abdominal BF, % 0.59* 0.49 0.57* 0.47 0.58* 0.48 0.47 0.44 Central Abd BF, kg 0.76** 0.73** 0.77** 0.74** 0.78** 0.75** 0.68** 0.70** Central Abd BF, % 0.52* 0.48 0.53* 0.46 0.54* 0.47 0.48 0.44 NAFLD – Non-Alcoholic Fatty Liver Disease; WC1 – Waist circumference measured minimal waist; WC2 - Waist circumference measured just above 462 iliac crest; WC3 - Waist circumference measured at mid-distance; WC4 - Waist circumference measured at the umbilicus; BF – body fat; Central Abd 463 BF – Central abdominal body fat; † - partial correlations between studied circumferences and dependent variables, controlled for age, sex and body 464 mass index; ‡ - semipartial correlations between studied circumferences and dependent variables, removing the effect of age, sex and body mass 465 index; * - significant for p<0,01; ** - significant for p<0,001. 466 467
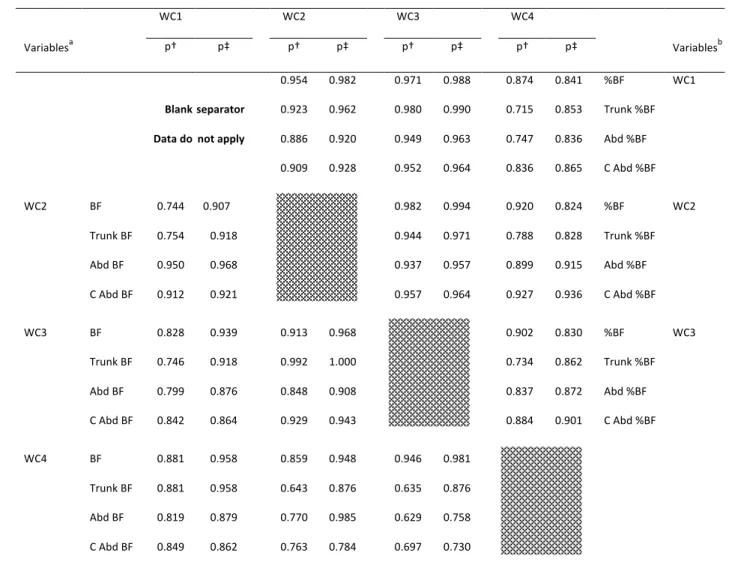
Table 5. Z statistic P values for the comparison between the coefficients of correlation found in partial and
468
semipartial correlations between waist circumferences, obtained using different measurement protocols, and
469 the absolute (lower-left half of table) and relative (upper-right half of the table) results for DXA assessed body fat 470 depots in 28 patients with NAFLD. 471 WC1 WC2 WC3 WC4 Variablesa p† p‡ p† p‡ p† p‡ p† p‡ Variablesb 0.954 0.982 0.971 0.988 0.874 0.841 %BF WC1 Blank separator 0.923 0.962 0.980 0.990 0.715 0.853 Trunk %BF Data do not apply 0.886 0.920 0.949 0.963 0.747 0.836 Abd %BF 0.909 0.928 0.952 0.964 0.836 0.865 C Abd %BF WC2 BF 0.744 0.907 0.982 0.994 0.920 0.824 %BF WC2 Trunk BF 0.754 0.918 0.944 0.971 0.788 0.828 Trunk %BF Abd BF 0.950 0.968 0.937 0.957 0.899 0.915 Abd %BF C Abd BF 0.912 0.921 0.957 0.964 0.927 0.936 C Abd %BF WC3 BF 0.828 0.939 0.913 0.968 0.902 0.830 %BF WC3 Trunk BF 0.746 0.918 0.992 1.000 0.734 0.862 Trunk %BF Abd BF 0.799 0.876 0.848 0.908 0.837 0.872 Abd %BF C Abd BF 0.842 0.864 0.929 0.943 0.884 0.901 C Abd %BF WC4 BF 0.881 0.958 0.859 0.948 0.946 0.981 Trunk BF 0.881 0.958 0.643 0.876 0.635 0.876 Abd BF 0.819 0.879 0.770 0.985 0.629 0.758 C Abd BF 0.849 0.862 0.763 0.784 0.697 0.730 DXA – Dual-energy X-ray Absorptiometry; NAFLD – Non-Alcoholic Fatty Liver Disease; a – Variables in the left column apply to the lower-left half of the table: b 472 – Variables in the right column apply to the upper-right half of the tale; WC1 – Waist circumference measured minimal waist; WC2 - Waist circumference 473 measured just above iliac crest; WC3 - Waist circumference measured at mid-distance; WC4 - Waist circumference measured at the umbilicus; † - comparison 474 between correlation coefficients obtained in partial correlations between waist circumferences and all dependent variables, controlled for age, sex and BMI; ‡ - 475 comparison between correlation coefficients obtained in semipartial correlations between waist circumferences and all dependent variables, removing the 476 effect of age, sex and BMI. 477 478 479
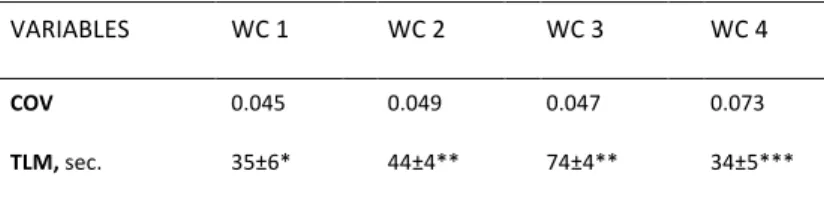
Table 6. Coefficient of variation and time length for 480 measurement of each waist circumference protocol. 481 VARIABLES WC 1 WC 2 WC 3 WC 4 COV 0.045 0.049 0.047 0.073 TLM, sec. 35±6* 44±4** 74±4** 34±5***
COV – mean coefficient of variation, TLM – mean±standard deviation of time length of
482
measurements, in seconds; WC1 – Waist circumference measured minimal waist; WC2 - Waist
483
circumference measured just above iliac crest; WC3 - Waist circumference measured at
mid-484 distance; WC4 - Waist circumference measured at the umbilicus; * - different from WC2 and 485 WC3 (p<0-001) but not WC4 (P=0.522); ** - different from all other WC TLM (p<0.001); *** - - 486 different from WC2 and WC3 (p<0-001) but not WC1 (P=0.522). 487 488
FIGURE LEGENDS: 489 490 Figure 1 - Image of a DXA scan showing the abdominal region of interest defined as the area 491 within the upper edge of the second lumbar vertebra and de lower edge of the fourth 492 lumbar vertebra. 493 494 Figure 2 - Representation of waist circumference measuring sites over a DXA scan image. 495 WC1 – waist circumference measured at minimal waist; WC2 - waist circumference 496 measured just above iliac crest; WC3 – waist circumference measured at mid-distance 497 between lowest rib and iliac crest; WC4 – waist circumference measured at the umbilicus. 498 499