UN
C
O
R
R
E
C
T
E
D
P
R
O
OF
1 2 3 RESEARCH PAPER 4Q1
Genetic diversity and hybridization in the two species Inga
5
ingoides and Inga edulis: potential applications for agroforestry
6
in the Peruvian Amazon
7 Alexandr Rollo1,2&Bohdan Lojka1&David Honys3&Bohumil Mandák4,5& 8 Julio A. Chia Wong6&Carmen Santos7&Rita Costa7&
9 Celestino Quintela-Sabarís8&Maria M. Ribeiro9,10 10
11 Received: 30 June 2015 /Accepted: 17 December 2015 12 #INRA and Springer-Verlag France 2016
13 Abstract
14 &Key message Slash and burn practices affect tropical
for-15 ests. Our results showed strong introgression between 16 Inga ingoides and Inga edulis in the species contact area. 17 Interspecific hybridization could be sought to improve 18 yield or tolerance to flooding and further increase the
19
economic potential of the poorly drained Amazonian soils
20
and minimize deforestation.
21
&Context Inga species are important components of tropical
22
American forests, as well as a local food source. Little is
23
known about the genetic structure of these species; in
partic-24
ular the amount of introgression among species remains
25
unknown.
26
& Aims We assessed the degree of genetic divergence and
27
introgression among populations of I. ingoides (Rich.)
28
Willd. and I. edulis Mart. (Fabaceae) from three Peruvian
29
Amazon tributary rivers.
30
& Methods Using microsatellite markers we determined the
31
genetic structure of populations using an analysis of molecular
32
variance and a Bayesian analysis of population structure in
33
areas affected by seasonal river fluctuations and in ‘terra
34
firme’ forests.
35
& Results Overall genetic differentiation was weak. The
de-36
gree of genetic variation was similar in the two species. A
37
putatively strong introgression was detected between the two
38
species and an intense gene flow was identified among
Handling Editor: Ricardo Alia
Contribution of the co-authors A.R. was in charge of the study; B.L. supervised the writing of the article, supervised Alexandr Rollo, and coordinated the project; B.M. participated in the STUCTURE analysis, and in the interpretation of the results; J.A. Chia Wong participated in tree sampling, and helped in the species identification; C.S. supervised the genotyping, and participated partially in the genotyping; R.C. supervised and organized the genotyping; C. Q.-S. participated in the AMOVA analysis, and in the interpretation of the results; M. M.R. performed data analysis (genetic diversity estimates), the interpretation of the results, participated in the paper writing, and co-supervised A.R. All authors reviewed and commented on successive drafts of the paper.
Electronic supplementary material The online version of this article (doi:10.1007/s13595-015-0535-0) contains supplementary material, which is available to authorized users.
* Bohdan Lojka [email protected] Alexandr Rollo [email protected] David Honys [email protected] Bohumil Mandák [email protected] Julio A. Chia Wong [email protected] Carmen Santos [email protected] Rita Costa [email protected] Celestino Quintela-Sabarís [email protected] Maria M. Ribeiro [email protected]
1 Department of Crop Sciences and Agroforestry, Faculty of Tropical
Forest AgriSciences, Czech University of Life Sciences, Kamýcká 129, CZ-165 00 Prague, Czech Republic
2 Students for the Living Amazon o.p.s., Národní obrany 984/18,
Prague CZ-160 00, Czech Republic DOI 10.1007/s13595-015-0535-0
UN
C
O
R
R
E
C
T
E
D
P
R
O
OF
39 populations. This indicates that an intense gene flow hadhap-40 pened in the past, leading also to a small differentiation among 41 populations within species.
42 &Conclusion Selection of natural hybrids or artificial
hybrid-43 ization between I. edulis and I. ingoides could be applied to 44 improve legume size and yield in the later species, while 45 maintaining tolerance to flooding. Improved I. ingoides could 46 be used in multipurpose agroforestry on open areas along the 47 rivers, instead of using the usual slash and burn practice to 48 create inland open areas.
49 Keywords Agroforestry . Biodiversity conservation . 50 Introgression . Inga . Peruvian Amazon . Microsatellites
51
1 Introduction
52 The Amazon drainage basin containing mainly lowland 53 rainforest habitats is a major component of the Neotropical 54 region, with more than 8 million km2and about 25 million 55 people (Junk and Piedade 2011). The riparian forests in the 56 rain forest cover about 1 million km2, which corresponds to 57 around 50 % of the basin’s entire wetland area. The species-58 rich floodplain forests along the large Amazonian rivers are 59 able to survive floods up to 10 m deep for as long as up to 60 8 months per year (Junk and Piedade 2011, and references 61 therein). Increasing population density and human activity 62 are destroying the forest landscape and inflicting a loss of 63 biological diversity (Oliveira et al.2007). Today, due to the 64 continuing massive pressure exerted by farmers, cattle 65 ranchers, and logging companies on the forests, new manage-66 ment concepts are urgently required to avoid the destruction of 67 this unique forest type (Junk and Piedade2011). The Peruvian 68 Amazon tropical area (ca. 661,000 km2) suffered disturbance 69 and deforestation at the average rate of 647 km2per year from 70 1999 to 2005: 75 % within legally sanctioned areas, 64 % 71 concentrated around the Ucayali logging centre, and 1–2 % 72 occurred within natural protected areas (Oliveira et al.2007). 73 The genus Inga Mill. (Fabaceae) comprises ca. 300 species 74 of trees restricted to tropical America. Each region has pre-75 ferred edible Inga species sold in large quantities in markets 76 during the fruiting season (Pennington 1997). Inga edulis 77 Mart., which occurs naturally on non-flooded or temporarily
78
flooded sites, is a widely distributed and highly valued species
79
in the Amazon region: it has been improved by human
selec-80
tion focusing on edible fruit, and cultivated as a fruit tree in
81
Peru for millennia, and more recently in agroforestry systems
82
(Pennington1997). Inga ingoides (Rich.) Willd., a close
rela-83
tive of I. edulis, is used frequently in gardens and pastures for
84
its edible fruit, and has ecological adaptability with potential
85
use in a wide range of locations with limited conditions due to
86
flood or poor soil drainage (Pennington1997). Biodiversity
87
conservation in the Peruvian Amazon along the riverside
88
zones, while maintaining land user benefits, could be achieved
89
by using this underutilized crop for food and fodder, avoiding
90
slash and burn practices (Lander and Monro 2015). The
91
neglected I. ingoides species could be considered as a
multi-92
purpose fruit tree species in agroforestry and other crop
sys-93
tems practiced in areas affected by periodical flooding.
94
Production of fruit and timber from this species near rivers
95
would be less costly, more sustainable and more
forest-96
friendly due to: (1) easy accessibility for humans, (2) economy
97
of transport, (3) nutrient input provided by periodical
98
flooding, and (4) cultivation in forest buffer zones avoiding
99
new forest sites colonization. Thus, the use of I. ingoides in
100
open areas affected by periodical flooding could be achieved
101
by genetic improvement through selection of natural hybrids
102
or artificial hybridization with I. edulis and backcrossing,
103
selecting for tolerance to flooding, legume size and yield,
104
similar to the type of breeding achieved in the genus
105
Eucalyptus (Potts and Dungey2004). Interspecific hybrids
106
of Eucalyptus have been used in forestry for decades,
partic-107
ularly in tropical and sub-tropical forestry, with plantations
108
initially based on outstanding spontaneous hybrids.
109
Selection was based on phenotype, followed afterwards by
110
breeding programs based on manipulated hybrids (Potts and
111
Dungey2004). A similar approach, initiated with the selection
112
of performing hybrids, could be applied to the Inga species
113
under study.
114
Population genetic studies of tropical trees have shown that
115
most of the species investigated are outcrossed and exhibit
116
high levels of genetic diversity and gene flow, carrying much
117
of the variation within, rather than among, populations
118
(Finkeldey and Hattemer 2007, and references therein).
119
Also, the specific evolutionary history of each species has
120
played an important role in determining the level and
3 Institute of Experimental Botany, Academy of Sciences of the
Czech Republic, Rozvojová 263, CZ-165 02 Prague, Czech Republic
4 Department of Ecology, Faculty of Environmental Sciences, Czech
University of Life Sciences, Kamýcká 129, CZ-165 00 Prague, Czech Republic
5 Institute of Botany, Academy of Sciences of the Czech Republic,
Zámek 1, CZ-252 43 Průhonice, Czech Republic
6 Agronomic Faculty, National University of Agriculture of La Selva,
Av. Universitaria km 1.5, Tingo María, Peru
7 INIAV, Instituto Nacional de Investigação Agrária e Veterinária, I.P.,
Av. República, Quinta do Marquês, 2780-157 Oeiras, Portugal
8 Instituto de Investigaciones Agrobiológicas de Galicia (IIAG), CSIC,
Apdo. 122, Santiago de Compostela 15780, Spain
9 Department of Natural Resources and Sustainable Development,
School of Agriculture, Polytechnic Institute of Castelo Branco, 6001-909 Castelo Branco, Portugal
10 Forest Research Center, School of Agriculture, University of Lisbon,
UN
C
O
R
R
E
C
T
E
D
P
R
O
OF
121 distribution of genetic diversity (Hamrick et al.1992). Introp-122 ical forests, the levels of genetic diversity within populations 123 vary considerably among species (Finkeldey and Hattemer 124 2007), from He= 0.11 in Acer skutchii Rehd. (Mexico) 125 (Lara-Gomez et al. 2005) to He= 0.78 in Swietenia 126 macrophylla King (Brazil) (Lemes et al. 2003), with both 127 studies using microsatellites. Genetic differentiation among 128 populations is slightly higher for tropical forest tree species 129 than for temperate forests tree species, probably due to higher 130 fragmentation levels in tropical trees. Moreover, tropical tree 131 species with abiotic seed dispersal show, on average, much 132 higher differentiation among populations than biotic-seed dis-133 persed species. Seed dispersal by animals (zoochory) is usu-134 ally very efficient and results in low genetic differentiation 135 among populations (Loveless1992). In the genus Inga, few 136 genetic diversity studies have been reported to date. Studies in 137 I. edulis and I. vera, using microsatellite markers, compared 138 natural vs. planted populations to understand habitat fragmen-139 tation and to clarify the impact of species domestication and 140 possible diversity loss (Cruz-Neto et al.2014; Hollingsworth 141 et al. 2005; Dawson et al.2008). The authors of the latter 142 studies found that diversity was lower in planted compared 143 to natural populations, but the values were still relatively high 144 and the genetic diversity in planted stands can, to some extent, 145 be restored by receiving pollen from natural populations. To 146 the best of our knowledge, no studies about the genetic diver-147 sity in I. ingoides have been published.
148 The present study, using microsatellite markers, focused on 149 two main objectives: firstly, we wanted to study the genetic 150 structure of the populations of I. ingoides and I. edulis, and 151 secondly, based on the obtained genetic structure, we wanted 152 to infer the suitability of a hybridization program. The specific 153 aims of the present study were: (1) to test if populations from 154 three Peruvian Amazon tributary rivers, geographically sepa-155 rated, had diverged and accumulated substantial differentia-156 tion among populations within the I. edulis and I. ingoides 157 species; (2) to compare the genetic diversity and divergence 158 of three natural I. ingoides populations with those of nearby 159 I. edulis natural populations; (3) to check for putative intro-160 gression between both species; and (4) to discuss the possibil-161 ity of the targeted hybridization between the two studied spe-162 cies, the transfer of the tolerance to flooding from I. ingoides 163 to I. edulis, and the transfer of legume size and yield potential 164 from the latter to I. ingoides.
165
2 Material and methods
166 2.1 Plant material and study site
167 The two sympatric Inga species were identified according to 168 morphological aspects detailed in the online resource 169 ESM_1.pdf (Pennington1997). Inga ingoides is distributed
170
from the Lesser Antilles and tropical South America to
171
Bolivia, including coastal Brazil to southern Minas Gerais.
172
Inga edulis and I. ingoides are sympatric species with
over-173
lapping distribution, but the former is more likely to be found
174
in non-flooded sites since it can withstand only temporary
175
floods. According to Pennington (1997), I. ingoides flowering
176
season, from August to November, partially overlaps the
177
I. edulis June–October flowering season. The Inga species
178
has brush-type flowers with mainly nocturnal anthesis
special-179
ized for hawkmoth (Sphingidae) and bat (Phyllostomidae)
180
visits (Cruz-Neto et al.2011, and references therein), yet
di-181
urnal visits by hummingbirds (Trochilidae) and hawkmoths
182
were also observed by Koptur (1984).
183
Plant material from 77 I. ingoides and 62 I. edulis
individ-184
uals used in this study was collected in riparian situations
185
along three Amazon River tributaries and in upland forests
186
(Table1; Fig.1a, b) from 2009 to 2012. The RPI and RPE
187
populations (hereafter, the first two letters of the population
188
name are the initials derived from the site name, the third letter
189
means I = I. ingoides and E = I. edulis) were sampled from
190
original vegetation along the river Pacaya. The RSI and RSE
191
populations were observed in original vegetation on the river
192
Samiria springs. Both rivers belong to the protected area
193
called Pacaya Samiria National Reserve (Fig.1a). The RUI
194
and RUE populations were sampled on secondary vegetation
195
along the Utiquinia river from the San José village, situated on
196
non-inundating terraces, to the periodically flooded and
poor-197
ly drained sites heading downstream to the Ucayali river. The
198
MAE population was sampled in the Macuya Experimental
199
Forest, a ‘terra firme’ forest remnant, protected by the
200
National University of Ucayali, surrounded by deforested
201
logged areas close to the city of Von Humboldt. The SDE
202
population was observed behind the Contamana city’s
second-203
ary vegetation, which begins in undulated terrain and
con-204
tinues to the original vegetation in the protected mountain
205
range called Sierra del Divisor National Park.
206
The sampled trees were selected randomly and the
mini-207
mum average distance between two sampled individuals from
208
the same species was 200 m. Young leaves were collected
209
from sexually mature trees and preserved in silica gel for
fur-210
ther DNA extraction. Voucher specimens were archived in the
211
Regional Herbarium of Ucayali IVITA-Pucallpa, Peru, with
212
the code AR1-384.
213
2.2 DNA extraction and amplification
214
Total genomic DNA was extracted from dried young leaves
215
with the Invitek, Invisorb® Spin Plant Mini Kit (http://www.
216
stratec.com) according to the manufacture’s instructions. We
217
used four microsatellite primers, one (Pel5) primer was
218
developed for Pithecellobium elegans Ducke by Daynandan
219
et al. (1997), and the remaining three primer pairs (Inga03,
220
UN
C
O
R
R
E
C
T
E
D
P
R
O
OF
221 (2005) for I. edulis. A fluorescent dye (6-FAM, NED or VIC)222 was added to the 5′ end of each forward primer.
223 Loci were amplified individually in 10 μl reaction contain-224 ing: 20 ng template DNA, 5 μM forward and reverse primer, 225 50 μM dNTPs, 2 mM MgCl2, 2 μl 5x GoTaq Flexi Buffer 226 (Promega, Madison, WI) and 1.0 U GoTaq® Flexi DNA 227 Polymerase (Promega). Amplifications were undertaken in 228 Biometra® T1 Thermocycler (http://www.biometra.de/) 229 using the following profile: 95 °C for 2 min; 95 °C for 15 s, 230 55 °C (Inga03) and 59 °C (Inga08, Inga33 and Pel5) for 30 s, 231 72 °C for 30 s, 30 cycles; 72 °C for 15 min. Completed
232
reactions were loaded onto an ABI PRISM 310 Genetic
233
Analyzer (Applied Biosystems, Foster City, CA) and run
234
according to the manufacturer’s protocol. Allele sizes were
235
determined using the ROX500 internal size standard and
236
GeneMarker® v2.4 software (Applied Biosystems).
237
2.3 Data analysis
238
The diversity parameters comprised the number of alleles
239
(Na), the effective number of alleles (Ne), the observed
hetero-240
zygosity (Ho), the expected heterozygosity (He) (Nei1987),
t1
:1 Table 1 Geographic location, sample size and study site where the Inga ingoides and Inga edulis populations were sampled. N is sample size
t1
:2 Species Site Population N Latitude S Longitude W Altitude (m)
t1
:3 I.ingoides Pacaya river RPI 47 5° 24′ 38.7858″ 74° 34′ 20.3952″ 105–127
t1
:4 Samiria river RSI 16 5° 15′ 12.2502″ 75° 22′ 2.949″ 91–131
t1
:5 Utiquinia river RUI 14 8° 11′ 42.2124″ 74° 18′ 39.999″ 148–168
t1
:6 I. edulis Pacaya river RPE 12 5° 40′ 38.6646″ 74° 56′ 40.7508″ 110–131
t1
:7 Samiria river RSE 6 5° 14′ 15.7668″ 75° 28′ 8.8998″ 105–123
t1
:8 Utiquinia river RUE 12 8° 9′ 47.5848″ 74° 16′ 46.9158″ 150–160
t1
:9 Macuya MAE 27 8° 52′ 51.4842″ 75° 0′ 29.1492″ 216–233
t1
:10 Sierra del Divisor SDE 5 7° 12′ 38.16″ 74° 56′ 51.5394″ 196–231
Q2 Fig. 1 a Map of South America highlighting the study area. b Map with the rivers location, conservation areas and sampled populations located in the Samiria (RSI and RSE), Pacaya (RPI and RPE), and Utiquinia (RUI and RUE) rivers, and, also, the MAE and the SDE populations
UN
C
O
R
R
E
C
T
E
D
P
R
O
OF
241 and the fixation index (FIS) (Weir and Cockerham1984). A242 principal coordinate analysis (PCoA) was computed based on 243 the pairwise Nei’s genetic distance matrix. The analyses were 244 performed using GenAlEx 6.5 (Peakall and Smouse 2012), 245 except for the allelic richness (AR), which was computed using 246 FSTAT 2.9.3 (Goudet1995). Using the Genepop 4.3 software 247 (Rousset2008), the Hardy-Weinberg equilibrium (HWE) was 248 tested for each population and locus (Markov-Chain method), 249 the linkage disequilibria (LD) tests were done for all loci com-250 binations, and the average frequency of null alleles were com-251 puted per population.
252 The grouping structure was further explored using a 253 locus-by-locus analysis of molecular variance (AMOVA), 254 implemented with the Arlequin 3.5 software (Excoffier and 255 Lischer2010). We estimated the variance components and 256 genetic variation using a non-hierarchical and hierarchical 257 analysis considering all of the populations or the two 258 groups (species), respectively. The significance values 259 were computed by a permutation test from 1,000 permuted 260 matrices.
261 A Bayesian clustering method was carried out using the 262 STRUCTURE version 2.3.3 software (Pritchard et al. 263 2000) to estimate the number of genetic clusters (K) and 264 to fractionally assign individuals of both Inga species to the 265 inferred groups. We applied the model which allows popu-266 lation admixture and correlated allele frequency. The K was 267 set from one to eight, and the simulation was run ten times 268 at each K value to confirm the repeatability of the results. 269 Each run comprised a burn-in period of 25,000, followed 270 by 100,000 Markov chain Monte Carlo (MCMC) steps. 271 Afterwards, the STRUCTUREoutput data were parsed using
272 the program Structure-sum (running under the R platform) 273 (Ehrich et al. 2007), mainly to determine the optimal K 274 value following Nordborg et al. (2005) and Evanno et al. 275 (2005) methods. Therefore, we used the ΔK distribution 276 statistic of Evanno et al. (2005) to determine the most ap-277 propriate number of genetic clusters through the detection 278 of the second rate of change in LnP(D). In addition, the 279 similarity coefficient between ten structure runs was com-280 puted, and for values higher than 0.9 we assumed that each 281 run ended with a similar result. An alignment of cluster 282 assignments across replicate analyses was then conducted 283 in the CLUMPP 1.1.2 software (Jakobsson and Rosenberg
284 2007), and subsequently visualized using DISTRUCT 1.1
285 (Rosenberg2004).
286
3 Results
287 3.1 Genetic diversity and inbreeding
288 The four simple sequence repeat (SSR) loci used in this study 289 were very polymorphic, with a total of 66 alleles in I. ingoides
290
and 58 alleles in I. edulis. However, the higher number of
291
alleles (Na) could reflect the higher number of individuals
292
(N) in some of the populations in both species: RPI (N = 47;
293
Na= 13.3) and MAE populations (N = 27; Na= 11) (Table2).
294
The effective number of alleles (Ne) was higher in the
295
I. ingoides southern population, RUI (6.1), and lower in the
296
northern one, RSI (4.4). The I. edulis western population
297
(MAE) held the highest Nevalue (6), and the smallest value
298
was found in the eastern SDE population (2.8) (Table2).The
299
rarefaction method displayed similar average allelic richness
300
(AR) values in both species (5.1) (Table2), due to differences
301
in sample size per population.
302
The expected heterozygosity (He) was also similar in
303
both species (ca. 0.70), but the observed diversity (Ho)
304
was lower for I. ingoides (0.54) compared with I. edulis
305
(0.68), which leads to a positive inbreeding coefficient
306
(FIS) in the former (Table2). All the I. edulis populations
307
are in Hardy-Weinberg expectations (HWE), but not the
308
I. ingoides populations (Table2). High FISvalues—the loss
309
of heterozygosity due to non-random mating of parents—
310
reflected differences between observed and expected
het-311
erozygosity. I. ingoides populations (RPI, RSI and RUI)
312
departures from HWE showed significant (P < 0.001)
het-313
erozygote deficiency. On the contrary, the I. edulis
popula-314
tions FISvalues were not significant. The average
frequen-315
cy of null alleles was similar and low in both species. In
316
addition, no linkage disequilibrium was detected between
317
different genotypes with the Fisher exact test among the
318
different loci (P > 0.05), indicating that all four loci
segre-319
gate independently of each other in both studied species.
320
The loci with higher Na(18) were different in both
spe-321
cies: Pel5 in I. edulis, and Inga03 and Inga33 in I. ingoides
322
(Table3). The ARper loci ranged from 4.2 (Inga08) to 11.5
323
(Inga33) based on the minimum sample size of 14
individ-324
uals in I. ingoides, and from 3.3 (Inga08) to 7.14 (Pel5)
325
based on the minimum sample size of 5 individuals in
326
I. edulis (Table 3). The Inga08 locus had the lowest He
327
values in both species (0.24 and 0.47, in I. ingoides and
328
I. edulis, respectively), and the Pel5 locus had the highest
329
value (ca. 0.90).
330
Private alleles (Pa) were identified for each I. ingoides
pop-331
ulation, the highest Paper population was found in the RPI
332
population (3.5 across loci) and the lowest value in the RSI
333
(0.75). The locus Inga03 had the highest Pa(2.7 across all
334
populations) and Inga33 had the lowest (1.33) in this species
335
(ESM_2.pdf). Pawere identified in four I. edulis populations
336
and the RPE had the highest Pa(1.25 across loci). The SDE
337
population had no private allele, probably due to the low N.
338
Only two alleles are common to the RPI/E pair, in the other
339
pairs there are no common private alleles. The populations
340
RUI and RSE hold the highest N/NParatio, i.e., they have
341
the highest number of private alleles compared to the
popula-342
UN
C
O
R
R
E
C
T
E
D
P
R
O
OF
343 3.2 Population differentiation and Bayesian cluster344 analysis
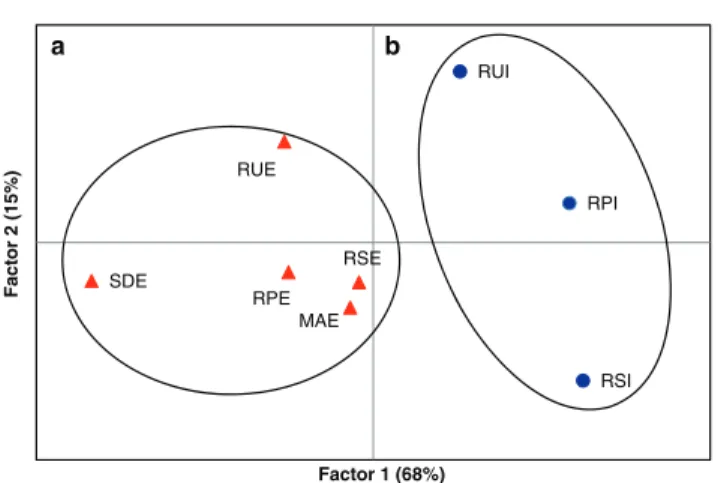
345 The PCoA analysis reveals populations’ weak grouping 346 (Fig.2), with the first and the second factor explaining 68 % 347 and 15 % of the total variation, respectively. The AMOVA 348 revealed an overall low among population variation 349 (ΦST= 0.05: P < 0.0001), and the highest variation of the data 350 set was found within populations (94 %) (Table 4). 351 Undoubtedly, group (A), including all the I. edulis popula-352 tions, clustered separately from group (B), the three 353 I. ingoides populations (Fig. 2). Furthermore, the AMOVA 354 confirmed a low, yet significant (P < 0.02) differentiation be-355 tween the two Inga species ΦCT= 0.036 (Table 4). The 356 I. ingoides populations at the three different rivers were clearly 357 separated, as observed in Fig.2, widely separated along the 358 second axis, although only explaining a small part of the var-359 iation. Indeed, the variation among populations within species 360 was weak, ΦSC= 0.027 (Table4).
361
STRUCTURE distinguished clusters and the mean
likeli-362
hood indicated two peaks at K = 2 and K = 4 (ESM_3A.docx).
363
Additionally, we found that the mean similarity coefficient,
364
the similarity between the ten runs, was consistently higher
365
for K = 2 (ESM_3C.docx). Considering K = 2, the clusters
366
corresponded to the two species groups, which had a
biolog-367
ically meaningful result: a clear introgression between species
368
(Fig3a).
369
Using the delta K criterion, the Bayesian clustering
370
suggests the most probable presence of four groups
371
(ESM_3B.docx), yet all individuals with mixed ancestry.
372
Thus, the genetic clusters uncover extensive gene flow
373
among populations. The mixed ancestry was particularly
374
evident in the close population pairs along the rivers,
375
with the more isolated I. edulis MAE and SDE
popula-376
tions clearly less mixed (Fig. 3a,b). The RUI/RUE
pop-377
ulations seem to be the most mixed pair. The genetic
378
clusters did not correspond closely to the morphological
379
species, which suggest that gene flow has occurred
t2
:1 Table 2 Diversity parameters per population obtained with the four simple sequence repeat (SSR) polymorphic loci after genotyping the I. ingoides and I. edulis individuals. N Sample size, Nanumber of
alleles per locus, Neeffective number of alleles, ARallelic richness, He
expected heterozygosity, Hoobserved heterozygosity, FISfixation index.
F-null refers to the average estimate of null frequency. Standard errors in brackets
t2
:2 Species Population N Na AR Ne Ho eH FIS Significance F-null
t2 :3 I.ingoides RPI 47 13.25 5.23 5.82 (1.61) 0.58 (0.14) 0.72 (0.15) 0.14 (0.15) *** 0.08 t2 :4 RSI 16 7.50 4.53 4.39 (1.34) 0.47 (0.19) 0.66 (0.16) 0.27 (0.18) *** 0.10 t2 :5 RUI 14 9.75 5.59 6.06 (1.94) 0.58 (0.13) 0.73 (0.16) 0.14 (0.11) *** 0.09 t2 :6 Mean 77 a 10.17 5.12 5.42 (1.63) 0.54 (0.16) 0.70 (0.16) 0.18 (0.15) 0.09 t2 :7 I. edulis RPE 12 8.25 5.23 5.06 (1.17) 0.63 (0.17) 0.72 (0.13) 0.09 (0.18) NS 0.06 t2 :8 RSE 6 6.50 5.82 5.32 (1.37) 0.75 (0.08) 0.79 (0.13) −0.08 (0.09) NS 0.00 t2 :9 RUE 12 7.25 5.15 4.58 (1.15) 0.67 (0.14) 0.76 (0.07) 0.11 (0.17) NS 0.06 t2 :10 MAE 27 11.00 5.41 5.98 (1.99) 0.66 (0.16) 0.75 (0.12) 0.12 (0.10) NS 0.06 t2 :11 SDE 5 4.00 4.00 2.77 (0.94) 0.70 (0.13) 0.60 (0.11) −0.30 (0.07) NS 0.00 t2 :12 Mean 62 a 7.40 5.12 4.74 (0.64) 0.68 (0.06) 0.72 (0.05) −0.01 (0.06) 0.06 aSum
***P < 0.001; NS not significant [from Hardy-Weinberg expectations (HWE) test after Bonferroni correction]
t3
:1 Table 3 Diversity parameters per locus obtained with the 4 SSR polymorphic loci after genotyping the I. ingoides and I. edulis individuals. See Table2for definitions t3 :2 Species Locus Na AR Ne Ho He FIS t3 :3 I.ingoides Inga03 18 8.61 5.31 (1.20) 0.63 (0.09) 0.81 (0.06) 0.21 (0.10) t3 :4 Inga08 13 4.21 1.31 (0.05) 0.24 (0.06) 0.24 (0.03) 0.03 (0.13) t3 :5 Inga33 18 11.49 6.60 (0.93) 0.39 (0.08) 0.87 (0.02) 0.54 (0.11) t3 :6 Pel5 17 11.26 8.47 (1.13) 0.92 (0.05) 0.90 (0.02) −0.05 (0.07) t3 :7 Mean 17 8.89 4.77 (0.79) 0.48 (0.08) 0.67 (0.07) 0.26 (0.08) t3 :8 I. edulis Inga03 16 6.30 5.56 (0.91) 0.86 (0.03) 0.83 (0.06) −0.13 (0.09) t3 :9 Inga08 11 3.30 1.86 (0.21) 0.51 (0.08) 0.47 (0.05) −0.15 (0.10) t3 :10 Inga33 13 4.90 3.58 (0.88) 0.46 (0.11) 0.68 (0.09) 0.28 (0.16) t3 :11 Pel5 18 7.14 7.97 (0.98) 0.90 (0.03) 0.92 (0.01) −0.04 (0.05) t3 :12 Mean 16 5.41 4.74 (0.64) 0.68 (0.56) 0.72 (0.05) −0.01 (0.06)
UN
C
O
R
R
E
C
T
E
D
P
R
O
OF
380 between the species. The three I. ingoides populations381 seem to have the highest proportion of genotype affin-382 ities (or proportion of genotype membership) to both 383 cluster 1 and 3, whereas I. edulis predominant propor-384 tion of genotype membership arises from cluster 2, in 385 particular for the MAE and SDE populations (Fig. 3b). 386 For K = 2, the mean introgression was higher for 387 I. ingoides (25 %) than for I. edulis (18 %), considering 388 the number of individuals with more than 50 % proba-389 bility as belonging to the other species (q > 50 %); how-390 ever the species introgression appears to be bidirectional 391 (Fig. 3a). Nevertheless, if we consider only the popula-392 tions along the rivers (RPE, RSE and RUE) the average 393 introgression sums up to 28 % in I. edulis, and the 394 MAE and SDE populations have negligible values. 395 The RUI population has the highest introgression degree 396 (36 %), almost twice the other I. ingoides populations 397 (Fig. 3a). 398
4 Discussion
399 4.1 Genetic diversity 400All populations displayed high values of expected
heterozy-401
gosity (mean He~ 0.70, AR= 5.1). These estimates were
slight-402
ly lower than estimates in natural populations of tropical trees
403
I. vera (He= 0.87; AR= 7.7) (Cruz-Neto et al. 2014),
404
Symphonia globulifera L. (He= 0.89) (Dick and Heuertz
405
2008) and Swietenia macrophylla King (He= 0.78) (Lemes
406
et al.2003), but were very similar to the expected
heterozy-407
gosity estimated for I. edulis by Hollingsworth et al. (2005) in
408
the same region (Peruvian Amazon) (He= 66 %). Normally,
409
high levels of genetic diversity are maintained by high levels
410
of gene flow facilitated by efficient pollen movement and the
411
widespread occurrence of efficient self-incompatibility
mech-412
anisms (Dick et al.2008). Some studies have demonstrated
413
that some Inga species are obligate outcrossers, dependent on
414
cross pollination to set fruits and seeds (Koptur1984;
Cruz-415
Neto et al.2014) (see following section).
416
Inbreeding values differed in both species. Whereas
417
I. edulis fits the low inbreeding values found in the I. vera
418
natural populations’ study using the same set of molecular
419
markers (Cruz-Neto et al.2014), our analyses revealed that
420
the heterozygote frequencies in I. ingoides depart from the
421
HWE, indicating either the existence of population
substruc-422
ture (due to the presence of genetically isolated groups,
in-423
breeding, and/or spatial genetic structure) or null alleles.
424
Since the estimated average frequency of null alleles is similar
425
in both I. edulis and I. ingoides, we hypothesize that these
426
differences could be explained by demography characteristics
427
due to habitat preferences. The observed results may reflect
428
I. ingoides’s pioneer ability. This species rapidly colonizes the
429
forest gaps opened by the seasonal river fluctuation, which
430
results in populations being formed by patches of related
in-431
dividuals with a highly significant deficiency in heterozygotes
RPI RSI RUI RPE RSE RUE MAE SDE F a c to r 2 ( 1 5 % ) Factor 1 (68%) b a
Fig. 2 Principal coordinates analysis (PCoA) based on the Nei’s pairwise genetic distances of Inga edulis (filled triangles) and of Inga ingoides populations (filled circles). Group A and group B, included populations from both species along the Pacaya, Samiria and Utiquinia rivers, respectively. The population SDE is an outlier
t4
:1 Table 4 Analysis of molecular variance (AMOVA) of the Inga populations, considering the whole data set and clustered in the two species (I. edulis and I. ingoides) according to the principal coordinates analysis (PCoA) analysis (see Fig.2) t4
:2 Source of variation df SS Variance
components % of total variance Φstatistics P t4 :3 All populations t4 :4 Among populations 7 25.996 0.07204 4.87 ΦST=0.05 <0.0001 t4 :5 Within populations 270 379.763 1.40653 95.13 t4 :6 Total 277 405.759 1.47856 t4 :7 I. edulis vs. I. ingoides t4 :8 Between species 1 10.84 0.05 3.64 ΦCT= 0.036 <0.02 t4 :9 Among populations within species 6 15.15 0.04 2.57 ΦSC= 0.027 <0.0001 t4 :10 Within populations 270 379.76 1.41 93.79 ΦST= 0.062 <0.0001 t4 :11 Total 277 405.76 1.50
SS = sum of squared deviation, df = degrees of freedom, P = level of probability of obtaining a more extreme component estimate by chance alone
UN
C
O
R
R
E
C
T
E
D
P
R
O
OF
432 due to recurrent biparental inbreeding. Thus, theheterozy-433 gotes deficiency could lead to lower competition ability, pos-434 sibly explaining why this species is rarely found outside the 435 riparian zone. In Acacia senegal (L.) Willd., Omondi et al. 436 (2010) found that the only population with positive FISwas 437 even-sized, suggesting the existence of one or few cohorts, 438 possibly established together as a result of some disturbance 439 event, and they argued that the area was prone to flooding, 440 which could provide a mechanism for non-random seed dis-441 persal. Indeed, seeds dispersed downstream could help to ex-442 plain the departure from HWE in I. ingoides, though this hy-443 pothesis ought to be tested using a similar approach found in 444 the study made with Calycophyllum spruceanum in the 445 Peruvian Amazon (Russell et al.1999).
446 The differences found in I. ingoides Ne, a slightly higher 447 value in the southern (RUI) population compared to the lower 448 value in the northern population (RSI), may reflect altitudinal 449 and flood pulse intensity differences, but may also reflect the 450 high inbreeding value in RSI (whether the latter reason is the 451 cause or the consequence will be difficult to disentangle). 452 Indeed, I. ingoides tend to have a higher effective population 453 size in less flooded southern areas than in those with higher 454 river seasonal fluctuation, despite the species’ tolerance to 455 flooding, possibly due to lower biparental inbreeding. In the 456 case of I. edulis, the highest Nevalue was found in the western 457 MAE population, and the lowest in the eastern SDE popula-458 tion. The former population, situated closer to the Andean 459 slopes, has a more favorable location than lesser elevated east-460 ern sites prone to flooding, but a lower value in the latter 461 population is probably due to differences in the number of 462 sampled individuals.
463 The number of private alleles in I. ingoides across loci was 464 almost twice as high as in I. edulis for a similar number of 465 sampled individuals (N), which may indicate the presence of
466
more intense gene flow in the latter species, in agreement with
467
negligible inbreeding values. Within species, the number of
468
private alleles seems to reflect N to a certain extent. Yet again,
469
RUI has more than twice the Pathan RSI, for comparable N;
470
this might be the result of a higher inbreeding value due to
471
putative higher parental inbreeding and consanguinity in the
472
RSI population.
473
4.2 Genetic structure and putative species introgression
474
The partition of genetic variance in our studied species (94 %
475
of the variance is observed within populations and a low
ge-476
netic structure is detected among populations, 2.6 %), is very
477
common in tropical forest tree species with high outcrossing
478
rates, and among populations with high levels of gene flow
479
(Finkeldey and Hattemer2007). In a previous study, similar
480
results were found with individuals showing mixed ancestry
481
and low differentiation among populations, reflecting strong
482
gene flow of Kenyan populations of Acacia senegal (Omondi
483
et al.2010). Within the genus Inga, Cruz-Neto et al. (2014)
484
uncovered a similar pattern in the I. vera species.
485
Weak population genetic structure may be a consequence
486
of the pollination system and also outcrossing in the
popula-487
tions under study. The majority of Inga species can be
consid-488
ered hawkmoth-pollinated, despite occasional visitation by
489
bats and hummingbirds during the day (Cruz-Neto et al.
490
2014, and references therein). Hawkmoths, bats and
hum-491
mingbirds can fly across large areas, ca. 15 km, during their
492
foraging routes, carrying pollen grains to distant individuals
493
(Koptur 1984). Pollen flow between distant individuals in
494
different populations, due to pollinator behavior, contributed
495
to high outcrossing rate and weak population substructure
496
found in, e.g., I. vera natural populations (Cruz-Neto et al.
497
2014). Additionally, natural seed dispersal is performed by
Fig. 3 a,b Proportion of genotype membership q (y-axis) based on Bayesian cluster analysis. Each individual is represented by a single vertical line that is partitioned in different colors based on its genotype affinities to each cluster (K). Grey lines indicate the division between populations.
Populations: 1 RPI, 2 RSI, 3 RUI, 4 RPE, 5 RSE, 6 RUE, 7 MAE, 8 SDE. a Plots of proportional group membership for the 139 trees for K = 2. Green Cluster 2, red cluster 1. b Plots of proportional group membership for the 139 trees for K = 4. Yellow Cluster 1, blue cluster 2, green cluster 3, red cluster 4
UN
C
O
R
R
E
C
T
E
D
P
R
O
OF
498 mammals and possibly birds that eat the sarcotesta and drop499 seeds elsewhere (Koptur1984). Indeed, in a broad study with 500 tropical tree species with abiotic seed dispersal (gravity dis-501 persed and wind dispersed) showed, on average, much higher 502 differentiation among population (GST= 0.138) than animal 503 dispersed species (GST= 0.050) (Loveless1992).
504 The weak population genetic structure together with the 505 lack of isolation-by-distance (data not shown) suggests that 506 species ecology, such as pollen and seed dispersal, and demo-507 graphic history (impacted by flood) is a strong driver of pop-508 ulation structure in the studied I. edulis and I. ingoides popu-509 lations, as in the case of Acacia senegal (Omondi et al.2010). 510 The Bayesian approach identified two to four clusters of 511 genetically mixed individuals in both species, with higher ad-512 mixture in those places where the two species were sympatric. 513 Thus, we could assume that the populations were not repro-514 ductively isolated, and, probably, not well separated taxonom-515 ically. Nevertheless, some authors claim that some species of 516 the Inga genus are cross-incompatible (e.g., Koptur1984), but 517 the data they presented does not support that conclusion, since 518 the fruit set from hand cross-pollinated trees is clearly superior 519 to the control.
520 Petit et al. (2004) reviewed the hybridization between two 521 widespread and largely sympatric European oak species 522 [Quercus petraea (Matt.) Liebl. and Q. robur L.]. They indi-523 cate that the parental taxa remain distinct, despite regular 524 levels of gene flow between them, and emphasize the low 525 differentiation found between both species. Yet, nuclear 526 markers show more or less important differences in allelic 527 frequencies between species. In another study, Moran et al. 528 (2012) indicate that hybridization is pervasive in many plant 529 taxa, with consequences for species taxonomy and local ad-530 aptation. They also indicate that oaks (Quercus spp.) are a 531 paradigmatic case, since they are thought to hybridize readily 532 yet retain distinct traits, drawing into question the biological 533 species concept for such taxa, but the true extent of gene flow 534 is controversial. Such reasoning could be extended to the Inga 535 genus.
536 We should clarify that the morphological identification of 537 all the individuals of the current study were rechecked with the 538 key species identification clues according to morphology and 539 no ambiguities were found. Selection against hybrids could 540 hamper speciation in the Inga genus, but at least the past gene 541 flow should be present in the individuals/populations in con-542 tact areas, which is the case of populations’ species pairs: RUI/ 543 RUE, RPI/RPE and RSI/RSE, except in the more isolated 544 I. edulis MAE and SDE populations. Introgression may be 545 facilitated when species co-occur in areas where no interme-546 diate habitats exist between the species ranges (Moran et al. 547 2012, and references therein). In our studied species, it seems 548 that the opportunity for introgression should be close to the 549 riverside, since I. edulis is relatively flood tolerant, and 550 I. ingoides is probably more shade intolerant, or at least less
551
competitive in this very harsh and competitive environment.
552
Clearly the populations of I. edulis close to the rivers, where
553
the two species overlap, suffer higher introgression, which is
554
predictable due to the fact that the I. ingoides habitat is mainly
555
found there. Endara and Jaramillo (2011) developed a study
556
on the influence of microtopography on the distribution of
557
Inga species. These authors indicate that one of the main
fac-558
tors explaining the distribution of the Inga species is the soil
559
water content. Out the 16 more frequent Inga sympatric
spe-560
cies they analyzed, 9 had a significant preference for one type
561
of microtopography: "slope" and "ridge" (well drained) or
562
"valley" (poorly drained soils). This fact indicates the
impor-563
tance of microhabitat to the sympatric species coexistence in
564
the Inga species, and that edaphic specialization among
spe-565
cies may create more available niches. Similarly, also in oaks,
566
Q. robur appears to be more tolerant to soil anoxia than
567
Q. petraea, and in mixed stands, succession towards the latter
568
would be the rule, except under permanently humid
condi-569
tions (Petit et al.2004). Indeed, dynamic speciation through
570
disruptive selection is also a hypothesis to be considered for
571
the Inga species we studied.
572
In summary, we hypothesize that the opportunity for
hy-573
bridization exists in the two Inga species studied here. Firstly,
574
the natural distribution of the two species overlaps, although
575
in our study the differences in habitat reflected the location of
576
the sampled individuals of both species, with I. edulis found
577
mainly in non-flooded terraces or temporarily flooded sites,
578
and with I. ingoides found predominantly in periodically
579
flooded areas (Pennington1997). Secondly, in some studies
580
based on I. ingoides and I. edulis, flowering phenology
obser-581
vations indicate synchronous flowering, which is also
com-582
mon in other Inga species (Pennington1997; Cruz-Neto et al.
583
2011; Koptur 1984). Thirdly, the putative introgression
be-584
tween both species is also supported by low differentiation
585
in microsatellite allele frequencies between the two
co-586
occurring species (3.6 %), suggesting at least past gene flow
587
(Moran et al.2012). Lastly, both species are closely related
588
from the genotypic point of view, which is also supported by
589
the phylogenetic study done by Dexter et al. (2010), where
590
they are found in the same node with 99 % support. In
addi-591
tion, speciation in the Inga genus is recent, and it is considered
592
a classic example of a recent radiation with evidence for many
593
species arising within the last 10 million years, some of them
594
as recently as 2 million years ago (Richardson et al.2001).
595
Actually, due to a rapid and recent burst of diversification
596
from the most recent common ancestor of the extant species,
597
they found a poorly resolved phylogeny.
598
4.3 Suitability of a hybridization program
599
The use of wild hybrids and the establishment of a breeding
600
program making use of the two species could bring important
601
UN
C
O
R
R
E
C
T
E
D
P
R
O
OF
602 the Amazon basin with limited commercial use, with their603 potential incorporation into agroforestry systems. The ability 604 of “pioneer” light-demanding species to grow in open spaces 605 and inhospitable lands, could bring those species into the fore-606 front of our concerns, by making flooded sites usable by 607 flood-resistant and performing hybrids. Natural hybrids occur 608 and are common in the species contact areas, according to our 609 results, which are also indicative that artificial hybrids are 610 possible in practice. Thus, natural hybrids’ selection and/or 611 artificial hybridization between I. edulis and I. ingoides could 612 be applied to improve legume size and yield in the latter spe-613 cies, while maintaining tolerance to flooding. The success of 614 the hybrids, and the development of these hybrids for com-615 mercial deployment, is dependent on two very important as-616 pects. Firstly, hybrid variation and therefore selection within 617 hybrids is dependent on the diversity of the parent species 618 involved. Secondly, successful hybrid utilization is dependent 619 largely on the vegetative propagation ability of the species 620 (Potts and Dungey2004). Our study revealed a high genetic 621 diversity in both species, but care should be taken in avoiding 622 related trees, particularly in the case of I. ingoides. We advise 623 that future studies on hybridization and introgression in both 624 species should be done together with flooding tolerance abil-625 ity and legume and yield in hybrids testing, and wild hybrids 626 could be procured by making use of today’s available ap-627 proaches, e.g., with tools developed specially for this genus 628 by Dexter et al. (2010), which include both morphological and 629 molecular approaches, and by Subashini et al. (2014) and 630 Larcombe et al. (2014) in Eucalyptus. Also, vegetative prop-631 agation could be used to propagate hybrids, since Inga species 632 can be propagated easily from semi-ripe branch cuttings, and, 633 for example, I. edulis is considered an easy-to-root species 634 (Pennington1998).
635 Acknowledgments We thank the Servicio Nacional de Áreas Naturales
636 Protegidas and José Navarro Pacaya-Samiria National Reservation Direc-637 tor for investigation authorization (N°004-2012-SERNANP-RNPS-J); 638 National University of San Marcos, Veterinary Institute of Tropical and 639 Highland Investigations, Regional Herbarium of Ucayali-Pucallpa, Peru 640 and the Director Zoyla Mirella Clavo Peralta for processing and archiving 641 the plant material. Thanks are also extended to N. Roque for help with 642 Fig.1and to I. Salavessa for editing the English of the manuscript. 643
644 Compliance with ethical standard
645 Funding This study was funded by several research grants provided by 646 the Bilateral Project ‘Morphological and genetic diversity of indigenous 647 tropical trees in the Amazon—model study of Inga edulis Mart. in 648 Peruvian Amazon’, Czech Academy of Sciences and CONCYTEC, 649 Peru 2011–2012; The Internal Grant Agency of CULS Prague (No. 650 20145023, No. 20145005); The Scholarship National University of 651 Ucayali, Peru. European Union Lifelong Learning Programme Erasmus 652 Consortium—Practical Placement Scholarship (Certificate No. CZ-01-653 2009); The Foundation Nadace Nadání Josefa, Marie a Zdeňky 654 Hlávkových, Czech Republic (Foundation Grant); and the Fundação para 655 a Ciência e a Tecnologia grant UID/AGR/00239/2013 supported MMR. 656
657
References
658659
Cruz-Neto O, Aguiar AV, Twyford AD, Neaves LE, Pennington RT,
660
Lopes AV (2014) Genetic and ecological outcomes of Inga vera
661
subsp affinis (Leguminosae) tree plantations in a fragmented tropical
662
landscape. PLoS One 9. doi:10.1371/journal.pone.0099903
663
Cruz-Neto O, Machado I, Duarte J Jr, Lopes A (2011) Synchronous
664
phenology of hawkmoths (Sphingidae) and Inga species
665
(Fabaceae–Mimosoideae): implications for the restoration of the
666
Atlantic forest of northeastern Brazil. Biodivers Conserv 20:751–
667
765. doi:10.1007/s10531-010-9975-x
668
Dawson I, Hollingsworth P, Doyle J, Kresovich S, Weber J, Sotelo
669
Montes C, Pennington T, Pennington R (2008) Origins and genetic
670
conservation of tropical trees in agroforestry systems: a case study
671
from the Peruvian Amazon. Conserv Genet 9:361–372. doi:10. 672 1007/s10592-007-9348-5
673
Dayanandan S, Bawa K, Kesseli R (1997) Conservation of microsatellites
674
among tropical trees (Leguminosae). Am J Botany 84:1658–1663
675
Dexter KG, Pennington TD, Cunningham CW (2010) Using DNA to
676
assess errors in tropical tree identifications: How often are ecologists
677
wrong and when does it matter? Ecol Monogr 80:267–286. doi:10. 678 1890/09-0267.1
679
Dick C, Hardy O, Jones FA, Petit R (2008) Spatial scales of pollen and
680
seed-mediated gene flow in tropical rain forest trees. Trop Plant Biol
681
1:20–33. doi:10.1007/s12042-007-9006-6
682
Dick CW, Heuertz M (2008) The complex biogeographic history of a
683
widespread tropical tree species. Evolution 62:2760–2774. doi:10. 684 1111/j.1558-5646.2008.00506.x
685
Ehrich D, Gaudeul M, Assefa A, Koch MA, Mummenhoff K,
686
Nemomissa S, Consortium I, Brochmann C (2007) Genetic
conse-687
quences of Pleistocene range shifts: contrast between the Arctic, the
688
Alps and the East African mountains. Mol Ecol 16:2542–2559. doi:
689 10.1111/j.1365-294X.2007.03299.x
690
Endara MJ, Jaramillo JL (2011) The influence of microtopography and
691
soil properties on the distribution of the speciose genus of trees, Inga
692
(Fabaceae:Mimosoidea), in Ecuadorian Amazonia. Biotropica 43:
693
157–164. doi:10.1111/j.1744-7429.2010.00668.x
694
Evanno G, Regnaut S, Goudet J (2005) Detecting the number of clusters
695
of individuals using the software structure: a simulation study. Mol
696
Ecol 14:2611–2620
697
Excoffier L, Lischer HEL (2010) Arlequin suite ver 3.5: a new series of
698
programs to perform population genetics analyses under Linux and
699
Windows. Mol Eco Resour 10:564–567. doi:10.1111/j.1755-0998. 700 2010.02847.x
701
Finkeldey R, Hattemer HH (2007) Tropical forest genetics.
Springer-702
Verlag, Berlin, Heidelberg. doi:10.1007/978-3-540-37398-8
703
Goudet J (1995) FSTAT (Version 1.2): A computer program to calculate
704
F-statistics. J Hered 86:485–486
705
Hamrick J, Godt M, Sherman-Broyles S (1992) Factors influencing levels
706
of genetic diversity in woody plant species. New Forest 6:95–124
707
Hollingsworth PM, Dawson IK, Goodall-Copestake WP, Richardson JE,
708
Weber JC, Sotelo Montes C, Pennington RT (2005) Do farmers
709
reduce genetic diversity when they domesticate tropical trees? A
710
case study from Amazonia. Mol Ecol 14:497–501
711
Jakobsson M, Rosenberg NA (2007) CLUMPP: a cluster matching and
712
permutation program for dealing with label switching and
713
multimodality in analysis of population structure. Bioinformatics
714
23:1801–1806. doi:10.1093/bioinformatics/btm233
715
Junk W, Piedade MF (2011) An introduction to South American wetland
716
forests: distribution, definitions and general characterization. In:
717
Junk WJ, Piedade MTF, Wittmann F, Schöngart J, Parolin P (eds)
718
Amazonian floodplain forests, vol 210, Ecophysiology, biodiversity
719
and sustainable management. Ecological Studies. Springer,
720
UN
C
O
R
R
E
C
T
E
D
P
R
O
OF
721 Koptur S (1984) Outcrossing and pollinator limitation of fruit-set:722 Breeding systems of Neotropical Inga trees (Fabaceae: 723 Mimosoideae). Evolution 38:1130–1143
724 Lander TA, Monro A (2015) Conservation of Brosimum alicastrum, an 725 underutilized crop and keystone forest tree species; a potential win– 726 win for conservation and development in Latin America. Biodivers 727 Conserv:1–14. doi:10.1007/s10531-015-0913-9
728 Lara-Gomez G, Gailing O, Finkeldey R (2005) Genetic variation in iso-729 lated Mexican populations of the endemic maple Acer skutchii 730 Rehd. Allg Forst Jagdztg 176:97–103
731 Larcombe MJ, Vaillancourt RE, Jones RC, Potts BM (2014) Assessing a 732 Bayesian approach for detecting exotic hybrids between plantation 733 and native Eucalypts. Int J Forest Res:13. doi:10.1155/2014/650202 734 Lemes MR, Gribel R, Proctor J, Grattapaglia D (2003) Population genetic 735 structure of mahogany (Swietenia macrophylla King, Meliaceae) 736 across the Brazilian Amazon, based on variation at microsatellite 737 loci: implications for conservation. Mol Ecol 12:2875–2883 738 Loveless MD (1992) Isozyme variation in tropical trees: patterns of ge-739 netic organization. New Forest 6:67–94. doi:10.1007/bf00120640 740 Moran EV, Willis J, Clark JS (2012) Genetic evidence for hybridization in 741 red oaks (Quercus sect. Lobatae, Fagaceae). Am J Botany 99:92– 742 100. doi:10.3732/ajb.1100023
743 Nei M (1987) Molecular evolutionary genetics. Columbia University 744 Press, New York
745 Nordborg M, Hu TT, Ishino Y, Jhaveri J, Toomajian C, Zheng H, Bakker 746 E, Calabrese P, Gladstone J, Goyal R, Jakobsson M, Kim S, 747 Morozov Y, Padhukasahasram B, Plagnol V, Rosenberg NA, Shah 748 C, Wall JD, Wang J, Zhao K, Kalbfleisch T, Schulz V, Kreitman M, 749 Bergelson J (2005) The pattern of polymorphism in Arabidopsis 750 thaliana. PLoS Biol 3:e196. doi:10.1371/journal.pbio.0030196 751 Oliveira PJC, Asner GP, Knapp DE, Almeyda A, Galván-Gildemeister R, 752 Keene S, Raybin RF, Smith RC (2007) Land-use allocation protects 753 the Peruvian Amazon. Science 317:1233–1236. doi:10.1126/ 754 science.1146324
755 Omondi S, Kireger E, Dangasuk O, Chikamai B, Odee D, Cavers S, 756 Khasa D (2010) Genetic diversity and population structure of 757 Acacia senegal (L) Willd. in Kenya. Trop Plant Biol 3:59–70. doi: 758 10.1007/s12042-009-9037-2
759
Peakall R, Smouse PE (2012) GenAlEx 6.5: genetic analysis in Excel.
760
Population genetic software for teaching and research—an update.
761
Bioinformatics 28:2537–2539. doi:10.1093/bioinformatics/bts460 762
Pennington TD (1997) The Genus Inga: Botany. Royal Botanic Gardens,
763
London
764
Pennington TD (1998) Inga management. In: Pennington T, Fernandes E
765
(eds) The genus Inga: utilization. Kew: Royal Botanic Gardens,
766
London, pp 159–167
767
Petit RJ, Bodénès C, Ducousso A, Roussel G, Kremer A (2004)
768
Hybridization as a mechanism of invasion in oaks. New Phytol
769
161:151–164. doi:10.1046/j.1469-8137.2003.00944.x
770
Potts BM, Dungey HS (2004) Interspecific hybridization of Eucalyptus:
771
key issues for breeders and geneticists. New Forest 27:115–138. doi:
772 10.1023/a:1025021324564
773
Pritchard JK, Stephens M, Donnelly P (2000) Inference of population
774
structure using multilocus genotype data. Genetics 155:945–959
775
Richardson JE, Pennington RT, Pennington TD, Hollingsworth PM
776
(2001) Rapid diversification of a species-rich genus of neotropical
777
rain forest trees. Science 293:2242–2245. doi:10.1126/science. 778 1061421
779
Rosenberg NA (2004) DISTRUCT: a program for the graphical display
780
of population structure. Mol Ecol Notes 4:137–138. doi:10.1046/j. 781 1471-8286.2003.00566.x
782
Rousset F (2008) Genepop’007: a complete re-implementation of the
783
genepop software for Windows and Linux. Mol Eco Resour 8:
784
103–106. doi:10.1111/j.1471-8286.2007.01931.x
785
Russell JR, Weber JC, Booth A, Powell W, Sotelo-Montes C, Dawson IK
786
(1999) Genetic variation of Calycophyllum spruceanum in the
787
Peruvian Amazon Basin, revealed by amplified fragment length
788
polymorphism (AFLP) analysis. Mol Ecol 8:199–204. doi:10. 789 1046/j.1365-294X.1999.00551.x
790
Subashini V, Shanmugapriya A, Yasodha R (2014) Hybrid purity
assess-791
ment in Eucalyptus F1 hybrids using microsatellite markers. 3
792
Biotech 4:367–373. doi:10.1007/s13205-013-0161-1
793
Weir BS, Cockerham CC (1984) Estimating F-statistics for the analysis of
794
population structure. Evolution 38:1358–1370