THE MULTI-COMPARTMENT VEHICLE ROUTING
PROBLEM IN THE COLLECTION OF RECYCLABLE
MUNICIPAL SOLID WASTE
Rodrigo Ferreira da Rocha e Silva
Dissertation submitted as partial requirement for the conferral of
Master in Management of Services and Technology
Supervisor
Prof.ª Doutora Tânia Rodrigues Pereira Ramos, Prof.ª Auxiliar, Departamento de Engenharia e Gestão, Instituto Superior Técnico, Universidade de Lisboa
Abstract
Waste production is an inevitable by-product of today’s society activities, and its collection is an essential public service. With an increase in population density and consequently in the production of waste, a growing concern on environmental sustainability came along. European and national legislation imposes material recycling, and in order to ensure the sector’s economic viability and offset the strong market regulation, companies seek to find more efficient alternatives.
In a waste collection system, transportation costs represent approximately 70% of the total cost, meaning that routing decisions have a great impact on the financial sustainability of the companies in this sector. This mind-set led to the study of the operation of Valorsul, the company responsible for the collection of recyclable municipal solid waste in the western region of Portugal.
This work intends to assess the impact on the distance travelled by using multi-compartment vehicles, collecting Paper and/Cardboard and Plastic and/Metal simultaneously, in comparison to the use of single compartmented vehicles, where only one material is collected at a time. To do so, a hybrid model was developed that firstly selects which collection points from the existing network are worth visit with multi-compartment vehicles, and then implements a heuristic to cluster and route those collection points.
The proposed model was applied to a specific region of Valorsul system, and the results obtained suggest that the use of vehicles with multi-comparts is more beneficial than the use of vehicles with only one, reducing the total distance travelled.
Keywords: waste management; transportation management; vehicle routing; multi-compartment vehicles
JEL Classification System:
C61 – Optimization Techniques; Programming Models; Dynamic Analysis
R410 – Transportation: Demand, Supply and Congestion; Travel Time; Safety and Accidents; Transportation Noise
Resumo
A produção de resíduos é um subproduto inevitável da atividade da sociedade atual, sendo a sua recolha um serviço público essencial. A acompanhar o aumento da densidade populacional, e consequentemente a produção de resíduos, existe uma crescente preocupação com a sustentabilidade ambiental. A legislação europeia e nacional impõe a reciclagem de materiais e, para garantir a viabilidade económica do setor e compensar a forte regulação do mercado, as empresas procuram alternativas mais eficientes.
Num sistema de recolha de resíduos, o seu transporte representa cerca de 70% do custo total, o que significa que a definição de rotas tem um grande impacto na sustentabilidade financeira das empresas deste setor. O caso de estudo desta dissertação baseia-se na operação da Valorsul, empresa responsável por um sistema de recolha de resíduos recicláveis.
Este trabalho pretende avaliar o impacto na distância percorrida comparando a utilização de veículos com múltiplos compartimentos, recolhendo os contentores de Papel e Plástico em simultâneo, e a utilização de veículos com um único compartimento, recolhendo um material de cada vez. Desta forma, foi desenvolvido um modelo híbrido que, numa primeira fase, seleciona os ecopontos que devem ser visitados por veículos com múltiplos compartimentos. Através do desenvolvimento de uma heurística, são definidas as rotas para recolher esses ecopontos.
O modelo proposto foi aplicado a uma região específica do sistema da Valorsul, e os resultados obtidos sugerem que o uso de veículos com múltiplos compartimentos é mais benéfico (em termos de distância percorrida) do que o uso de veículos com apenas um.
Palavras-chave: gestão de resíduos; gestão de transportes; rotas de veículos; veículos com múltiplos compartimentos
JEL Classification System:
C61 – Optimization Techniques; Programming Models; Dynamic Analysis
R410 – Transportation: Demand, Supply and Congestion; Travel Time; Safety and Accidents; Transportation Noise
Acknowledgement
Firstly, I would like to thank my thesis advisor Professor Tânia Ramos for proposing me the subject in study, and dedicating her time and effort towards this project. Her knowledge, experience and vital inputs were essential for the development of this thesis. I truly appreciate her dedication and advice.
I would also like to thank my friends and study buddies Daniel, Daniela, Gonçalo, Joana and Luís. This accomplishment would not have been possible without their support, and they were a great part of this period of my life. Thank you.
To all my classmates and colleagues, thank you for the good times spent together in ISCTE-IUL in the past 5 years.
I would also like to show my appreciation for the understanding of all my loved ones during the period of the development of my Master thesis, in which I was more absent.
Finally, I must express my very profound gratitude to my parents and to my brother for providing me with unfailing support and continuous encouragement through my graduate studies. They have played an integral role in the past years, as they did throughout all my life. They are my true role models and I cannot thank them enough for all the support, guidance, friendship, and for all they have taught me so far.
Index
1. Introduction ... 1
1.1. Theme ... 1
1.2. Objectives & Research Questions ... 4
1.3. Structure ... 5
2. Case study ... 6
2.1. The Waste Sector ... 6
2.1.1. The Life Cycle of Municipal Solid Waste ... 8
2.2. Valorsul ... 10
2.2.1. Selective Collection ... 13
3. Literature Review ... 17
3.1. Logistics Management ... 17
3.1.1. Transportation Management ... 20
3.2. Vehicle Routing Problem ... 22
3.2.1. General Definitions and Notation ... 22
3.2.2. Solution Methods ... 24
3.2.3. VRP Variants ... 29
4. Methodology ... 34
5. Proposed Model to Solve the MCVRP ... 37
5.1. Problem Description ... 37
5.1.1. Data Required ... 37
5.1.2. To Determine ... 38
5.2. Model Description ... 38
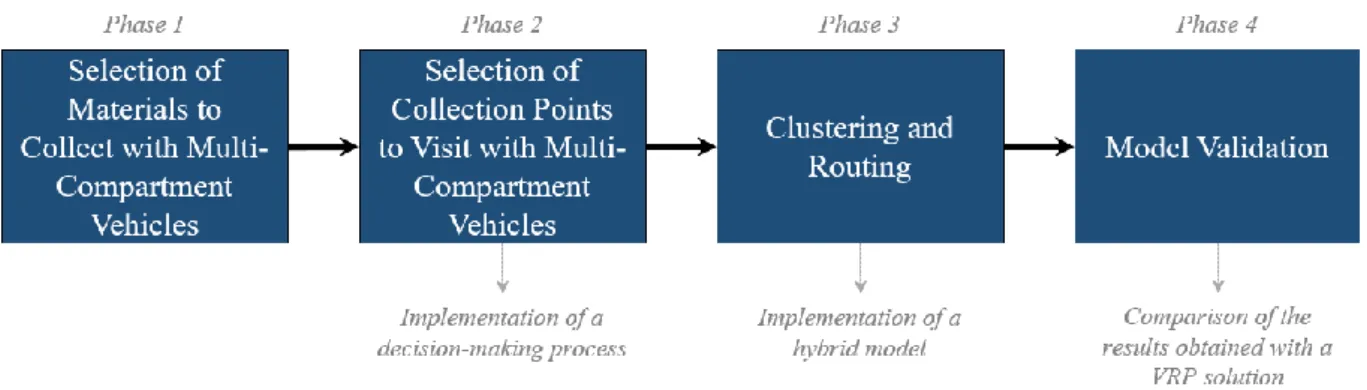
5.2.1. Phase 1: Selection of Materials to Collect with Multi-Compartment Vehicles ... 39
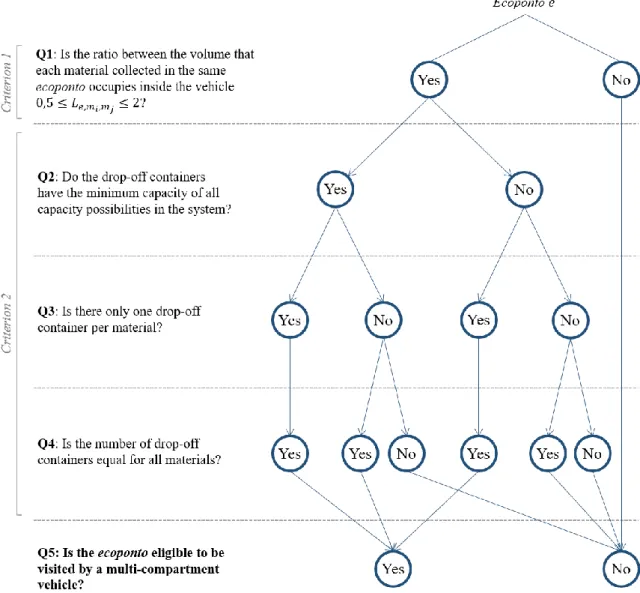
5.2.2. Phase 2: Selection of Collection Points to Visit with Multi-Compartment Vehicles ... 40
5.2.3. Phase 3: Clustering and Routing ... 45
5.2.4. Phase 4: Model Validation ... 48
6. Model Application to the Case Study ... 49
ii 6.1.1. Type of MSW in study ... 49 6.1.2. Collection Points ... 50 6.1.3. Fleet of Vehicles ... 57 6.1.4. Route Duration ... 58 6.1.5. Distances ... 59 6.1.6. Region in Study ... 61 6.2. Results ... 62
6.2.1. Phase 1: Selection of Materials to Collect with Multi-Compartment Vehicles ... 62
6.2.2. Phase 2: Selection of Collection Points to Visit with Multi-Compartment Vehicles ... 62
6.2.3. Phase 3: Clustering and Routing ... 65
6.2.4. Phase 4: Model Validation ... 71
7. Conclusions and Future Research ... 72
7.1. Conclusions ... 72
7.2. Suggestions for Future Research ... 75
References ... 76
Appendix A ... 82
Appendix B... 83
Appendix C ... 84
List of Figures
Figure 1.1 - Evolution of the amount collected of recyclable MSW in Portugal, between 1998 and 2015 (SPV, 2016) ... 2 Figure 1.2 - Price change of fuels sold at gas stations in Portugal, between 2000 and 2014 (Pordata, 2015) ... 3 Figure 2.1 - Waste Value Chain illustration (adapted from Rosa et al., 2015) ... 8 Figure 2.2 - Ecoponto placed in the municipality and parish of Alcobaça (photo taken by the author) ... 9 Figure 2.3 - Network of facilities for treatment, recovery and disposal of Valorsul for the different types of MSW collected (Valorsul, 2016) ... 12 Figure 2.4 - Collection Process of Valorsul for recyclable MSW (adapted from Lopes, 2014) ... 15 Figure 3.1 - Framework of reverse logistics for household waste recycling (adapted from Bing et al., 2016) ... 19 Figure 3.2 – Illustration of a simple directed graph made up by 8 nodes and 1 depot, with 3 defined clusters ... 23 Figure 3.3 - Illustration of the Savings Algorithm ... 25 Figure 3.4 - Illustration of the Sweep Algorithm ... 26 Figure 3.5 - Illustration of single-material routes versus multi-material routes (adapted from Oliveira et al., 2015) ... 32 Figure 4.1 - Scheme of the methodology implemented ... 34 Figure 5.1 - Illustration of the proposed model ... 38 Figure 5.2 – Illustration of the Decision Tree that selects which collection points are eligible to be visited by a multi-compartment vehicle ... 43 Figure 5.3 - Flowchart of the MCVRP Heuristic developed ... 45 Figure 6.1 - Illustration of the tendency of the weekly filling rate throughout time ... 56 Figure 6.2 - Illustration of the three possible configurations for the vehicle compartments ... 58 Figure 6.3 - Illustration of the Remote Area of Valorsul (marked in green) ... 61 Figure 6.4 - Results obtained in the decision making process for the all system of Valorsul, and for the region in study ... 64 Figure 6.5 - Explanation of the calculation of the real interval of days between collections .. 69
iv
Figure B.1 - Graphical matches between the distance calculated in Google Maps (filled section in blue) and the same distance calculated with the Euclidean Distance formula, using as circuity factors 1,3; 1,4; 1,5; 1,58 (the chosen one, with 99,61% of match); and 1,6 ... 83 Figure C.1 - Illustration of the route of cluster 1 of the MCVRP ... 84
List of Tables
Table 2.1 - Records on the amount of MSW received in Valorsul facilities in 2013, 2014 and 2015 (Valorsul, 2016) ... 10 Table 2.2 - Amount of recyclable MSW received in CTRO and CTE (Valorsul, 2016) ... 13 Table 2.3 - Fleet of vehicles of Valorsul (Lopes, 2014) ... 13 Table 2.4 - Statistics on the collection of recyclable MSW by Valorsul, between January and June of 2013 ... 16 Table 6.1 - Density of the materials collected by Valorsul inside the respective containers, and inside collection vehicles (Lopes, 2014) ... 49 Table 6.2 – Different compositions of ecopontos, per types of container each one has – Paper and/Cardboard (PC), Plastic and/Metal (PM), Glass (G) ... 50 Table 6.3 - Number of containers per capacity, and number of ecopontos with such type of containers (per material and totals) ... 51 Table 6.4 - Capacity in weight (kg) of PC and PM containers with volumes of 2,5 m³, 3m³ and 5 m³ ... 51 Table 6.5 - Configurations of ecopontos of Valorsul with at least one container for Paper and/Cardboard and one Plastic and/Metal ... 52 Table 6.6 - Summary of the operation of shift 18120 ... 52 Table 6.7 - Part of the visit sequence of shift 18120 ... 53 Table 6.8 - Information about the filling level and amount of MSW deposited in container P2306 of ecoponto 2293 per visit ... 54 Table 6.9 - Types of vehicles available for the collection of the materials in study ... 57 Table 6.10 - Comparison between the actual road distances of 100 randomly chosen routes with different circuit factors ... 59 Table 6.11 - Comparison between the real distance travelled to perform 969 shifts, and the Euclidean Distance calculated with a circuit factor of 1,58 for the same shifts ... 60 Table 6.12 - Compositions of ecopontos eligible to be implemented in the proposed model per types of container ... 62 Table 6.13 - Number of ecopontos divided per week ... 65 Table 6.14 - Illustration of the list developed for the MCVRP to define clusters ... 66 Table 6.15 - Results obtained for the MCVRP for the collection of Paper and/Cardboard and Plastic and/Metal ... 68
vi
Table 6.16 - Results of the sensitivity analysis regarding the size of the compartments of Paper and/Cardboard, and Plastic and/Metal (number of ecopontos, per cluster, per configuration) 70 Table 6.17 - Results obtained for the VRP for the collection of Paper and/Cardboard and Plastic
and/Metal ... 71
Table A.1 - Distribution of Valorsul own containers for the deposit of Paper and/Cardboard, Plastic and/Metal, and Glass, per district, municipality and capacity ... 82
Table C.1 - Visit sequence of cluster 1 of the MCVRP ... 84
Table D.1 - Visit sequence of the cluster of week 1 of the VRP for PC ... 85
1. Introduction
1.1. Theme
In order to ensure their economic and financial sustainability, companies today are looking for and developing new business models. Legislation, governance, the environment itself, infrastructure or consumer behaviour are some of the aspects that have direct influence on companies. Academic research can be very useful and a great support for companies since it promotes the study and development of innovative alternatives to current enterprise practices. The study carried out in this dissertation is based on Valorsul, a Portuguese private company that operates a recyclable waste collection system in the western region of Portugal. This work aims to assess the impact on the distance travelled to visit the collection points under the responsibility of Valorsul, by using vehicles with multiple compartments, instead of using single compartmented ones. To fully comprehend the importance of studying the collection routes of such company, it is important to understand its context.
Utilities and sanitation services are under public jurisdiction and their maintenance are essential to guarantee good quality of life of citizens, as United Nations has once declared (Rosa et al., 2015). To ensure the sector’s economic viability and offset the strong market regulation and industry variables, the entities responsible for their management are forced to find new solutions.
Waste production is an inevitable by-product of any economic activity and growth, and its disposal and treatment is a global environmental issue. Especially since the late 90s, there has been a growing concern with the collection and treatment of municipal solid waste (MSW). The European Union (EU) imposes material recycling and very ambitious targets concerning waste management – as established, for example, in the Waste Framework Directive –, which leads to extra logistics challenges for companies in all member states.
In order to implement this directive, Portugal has its own National Waste Management Plan (PNGR) that promotes waste prevention and management and aims to ensure greater efficiency in the use of natural resources. PERSU 2020, the current Strategic Plan for MSW, is under its scope. One of its priorities is to promote the optimization of MSW collection systems and evaluate possible solutions (APA, 2016).
2
Rosa et al. (2015) stated that the Portuguese Waste sector shows a clear tendency to improve the efficiency of technical and technological solutions that are responsible to ensure that the service provision is sustainable and affordable to its users. However, there are a few challenges that companies have to face.
Although recycling aims for a better overall management of environmental resources (raw materials, land, soil quality and water, among others), its supply chain is quite complex and involves large investments in equipment and infrastructure (Cruz et al., 2014). Compared to a non-recyclable MSW collection system, the economic viability of collecting recyclable MSW is much more reduced (Lima et al., 2015) and, despite the enormous advantages of recycling, it is evident that this process has direct costs for companies (public or private).
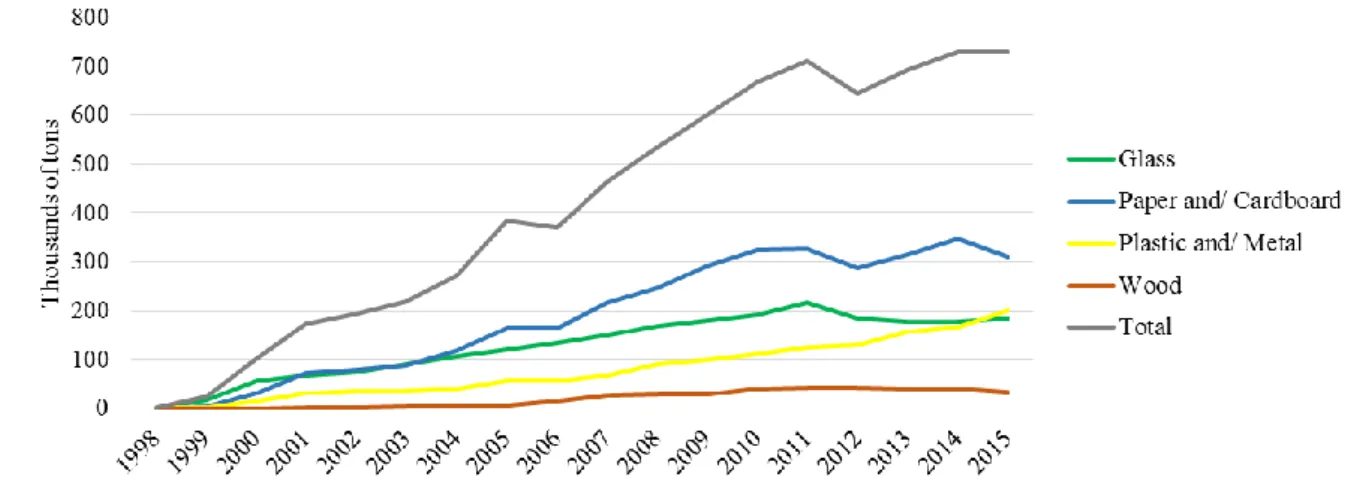
With an increase in population density, came along an increase in production of MSW and the need to create value for these materials. According to ERSAR – the national Regulatory Authority for Water and Waste Services – in Portugal, in 2014, were produced a total of 4,3 million tons of MSW, with 10% subject to recycling (Rosa et al., 2014). Figure 1.1 shows the evolution of the amount of recyclable MSW collected in Portugal between 1998 and 2015. For all types of waste, the trend is positive and the amount of MSW collected for recycling purposes has been increasing.
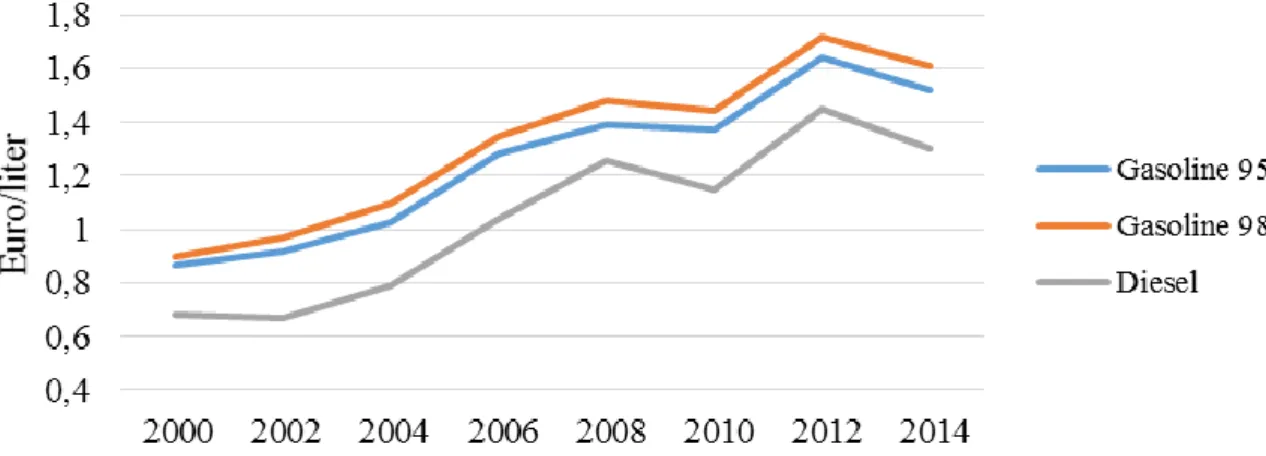
The number of collection points scattered throughout urban areas is very high and route management has a great impact on companies’ performance and efficiency. Due to the long distances that collection vehicles have to travel in their routes, companies have to be aware of the cost of fuel. Although oil prices have declined sharply since June 2014 (Baffes et al., 2015),
since the early 2000s the trend aims for an increase in fuel prices – see Figure 1.2 for the evolution of the cost of fuels sold in Portugal.
Collection costs alone represent about 70% of the total cost for a recyclable waste collection system (Ramos et al., 2014). It is essential that companies responsible for collecting recyclable MSW react and adapt their operations in order to maintain efficiency, simultaneously attending the market needs and demands. In order to make recyclable MSW collection economically viable, companies should aim to travel the minimum distance possible, with the fewest possible vehicles, maximizing productivity. Since most of these costs are not recoverable (Cruz et al., 2014), i.e., sunk costs, this research topic can lead to new models and have great impact on companies’ operations efficiency and reduce cost.
4
1.2. Objectives & Research Questions
Most studies found about route management applied to waste collection systems are based on the traditional methods, where single-material routes are performed to visit collection points, i.e., a single compartment vehicle is used to collect each material individually. However, two or more materials can be collected simultaneously, without being commingled, if vehicles with multiple compartments are used. Real-life applications of Multi-Compartment Vehicle Routing Problems (MCVRP) are seldom studied, although this problem has been getting more attention from the academia in recent years.
This dissertation aims to take this opportunity by analysing the impact of using vehicles with multiple compartments on the real recyclable MSW collection system of Valorsul. To understand the impacts on the distance travelled, a model is developed, which aims to meet the following objectives:
Identify which materials are worth collecting with vehicles with multiple compartments; Identify which collection points are eligible and worth visiting with vehicles with multiple compartment, according to their characteristics – demand and capacity installed –, and which ones are not;
Develop a heuristic approach to cluster and route collection points, based on the reviewed literature and on the operation of the company in study;
Compare the obtained solution (MCVRP) with the current method used by company (single-material routes) in order to assess the benefits of the model.
In order to achieve the objectives herein proposed, the following research questions will be answered in this dissertation:
1. Which collection points are eligible to be visited by a multi-compartmented vehicle? 2. What is the impact of the use of vehicles with multiple compartments on the distance
travelled of a recyclable MSW collection system, when compared to the traditional method?
1.3. Structure
This dissertation is composed by seven chapters, among which is included this first chapter where the research problem is introduced.
The second chapter presents the case study in which this dissertation is based on. It introduces the waste sector and deepens the life cycle of municipal solid waste, exploring the phases of its value chain – from production to disposal. The second part of the second chapter introduces the company in analysis, Valorsul, focusing on its current processes to collect recyclable MSW, and on its own infrastructure to do so (vehicles and collection points).
As for chapter three, a literature review is conducted, giving a comprehensive exploration of the subject in question. It starts by introducing the importance of Transportation Management, exploring which drivers, factors and constrains influence logistic systems responsible for the collection of MSW and to be considered when solving routing problems. It also explores Vehicle Routing Problems, presenting the relevant solution methods already developed and published, focusing on its variants (where MCVRP is included).
Subsequently, the methodology is approached in chapter four, summarizing the thinking process on how to solve the research problem of this dissertation.
Deriving, chapter five explains the model developed to answer the research questions, fulfilling the objectives proposed. It presents a detailed explanation on how collection points are screened and on the cluster and route heuristic developed to solve the MCVRP.
Chapter six is divided in two parts. Firstly, it goes through the analyses performed on the data provided by Valorsul, that support all necessary calculations further on. Lastly, it presents the results obtained by the implementation of the proposed model, and compare them to the current solution of the company – where single-material routes are performed –, in order to assess the impact on the distance travelled.
6
2. Case study
2.1. The Waste Sector
Waste management is acknowledged as a public service and, being of general economic interest, is under Portuguese legislation (Law No. 23/96 of July 26). MSW is defined by the Portuguese law as any household waste, or alike, that comes from the service sector, commercial establishments or healthcare sector, as long as, in any case, the daily production does not exceed 1100 litters per producer (APA, 2016).
Pursuing the first Waste Framework Directive1 of the EU in 1994, Portugal made a great investment in waste management infrastructure and started to abolish dumps. Several MSW management systems were created and developments in the national legislative framework has led to the licensing of service providers, instigating an increase in recovery and recycling. Pursuing EU demands, as all member states had to do, Portugal established its own National Waste Management Plan (PNGR) – see Ferrão (2014) –, a macro planning policy that sets strategic guidelines, nationwide, and promotes waste prevention and management. It tends to ensure greater efficiency in the use of natural resources, and is based on two strategic objectives: i) promote the efficient use of natural resources in the economy; ii) prevent or reduce the adverse impacts of production and waste management.
Under the scope of the PNGR there are three specific waste management plans, depending on the material concerned: i) Strategic Plan for Hospital Waste (PERH); ii) Strategic Plan for Industrial Waste Management (PESGRI); iii) Strategic Plan for Municipal Solid Waste (PERSU). For the purpose of this thesis, only the last one is relevant since it is the one specific to MSW.
The first PERSU was established in 1997 and currently is in force PERSU 2020, a goal-setting tool to promote environmental sustainability. It allows each system to develop specific and appropriate solutions to their characteristics, which can and should include the optimization and sharing of infrastructure, the prevention of the generation of municipal waste, the commitment to selective collection, and the adoption of new solutions or the improvement of existing techniques and technologies (Rosa et al., 2015).
1Framework designed to emphasise the importance of proper waste management, such as recovery and recycling,
Considering the waste sector itself, it works as a legal monopoly (Rosa et al., 2015): for each region, there is only one service provider; thus, consumers do not have the possibility to choose between operators and regulation has a major impact on service quality and cost. Unlike most EU countries, Portugal has a regulator for the waste sector (Cruz et al., 2014): Entidade Reguladora dos Serviços de Águas e Resíduos (ERSAR) – it stands for The Regulatory Authority for Water and Waste Services. It main responsibilities are to regulate the public water supply services, urban wastewater management and MSW services, and to ensure the structural adjustment of the sector. APA, the Portuguese Environment Agency (Agência Portuguesa do Ambiente), develops and monitors the implementation of public policies for the environment and waste management strategies (APA, 2016). This entity is also responsible for licensing waste management operations and entities that manage specific waste streams, such as Sociedade Ponto Verde (SPV). SPV is responsible for the collection and recycling of household, commercial and industrial packaging MSW, regulating over 500 operators nationwide; it coordinates the Green Dot System (see PRO EUROPE, 2016) in Portugal, which has as mission to promote the selective collection, recovery and recycling of packaging waste (SPV, 2016).
Nowadays, there are thirty-two recyclable MSW collection systems operating in Portugal, that ensure that 100% of households are served with public collection and treatment of MSW (SPV, 2016), one of them being Valorsul. These entities, so called SMAUTs, can be of state, municipal or inter-municipal owned systems, and operate in one of the following management models (Rosa et al., 2015): i) concession; ii) delegation; iii) direct management.
As for waste management services, there are two different categories to classify them, depending on the activities performed (Decree-Law No. 379/93 of November 5): “low” or “high” activities. The first one covers collection and transportation (until one depot) of MSW. The “high” system, in turn, includes storage, sorting, transport, recovery and disposal (in a landfill, for example) of MSW. Municipal systems are mainly responsible for the “low” activities, which corresponds to the retail activities of the sector (focusing on the interaction with the end-user), and inter-municipal systems are normally responsible for the high activities (like wholesalers). This industry structure has led to advantages in terms of economies of scale (Rosa et al., 2015). The integration of several municipalities into a single MSW management system, operated by single entities, allows monetizing investments in the sector and contributes to greater structural efficiency in service delivery.
8
2.1.1. The Life Cycle of Municipal Solid Waste
In short, a MSW collection system refers to a set of units (containers) distributed geographically that have to be visited in a regular basis (Oliveira, 2008). However, the complexity of this sector requires large investments, with a long-term capital recovery (Lima et al., 2015), and is based on a complex technological system comprising the following steps (Rosa et al., 2015): i) collection; ii) transport; iii) sorting; iv) recovery; v) disposal. This study will focus on the first two steps.
The life cycle of MSW – illustrated in Figure 2.1 – starts with its production from domestic, industrial or commercial activities. This waste can be disposed selectively, or undifferentiated. Undifferentiated waste, commonly referred to as “trash”, is treated like this from the moment consumers place their MSW in the same disposal container (typically of grey colour), regardless its type. On the other hand, consumers can selectively separate their waste, such as organic matter, home appliances, batteries and packaging materials (the only type of MSW to be considered in this study).
In Portugal, after separated and deposited by the population, MSW can be collected in one of both ways (Bing et al., 2016): in drop-off containers or by curbside (door-to-door). The first system is the most common and consumers have to take their waste to drop-off containers – there are approximately 40000 nationwide (SPV, 2016); as for the second one, the recyclable containers are inside citizens’ home buildings, and waste is collected at a known specific day. Some types of MSW cannot be collected in such places due to their dimensions, type of material or weight; therefore, they have to be delivered by consumers in specific places (stores or ecocentros).
As for packaging materials, there are three types of drop-off containers and normally they coexist together in every site: green ones are for Glass (G), yellow ones for Plastic and/Metal (PM), and blue ones for Paper and/Cardboard (PC). These type of containers can be placed on the surface (establishing a recycling centre, from now on referred to as “ecoponto” or collection point, and illustrated in Figure 2.2), or underground (a set of underground drop-off containers known as ilhas ecológicas).
Collection of MSW also includes the transportation of the materials collected to a location where vehicles are unloaded, such as a sorting facility, a transfer station or a landfill site. In these locations, MSW is treated and valued according to its composition.
Bing et al. (2016) stated that the main issues at the collection planning level are (i) the types of waste to be collected, (ii) the organization of collection and (iii) the type of vehicle used. In Portugal, the vehicles used to collect undifferentiated waste are typically rear-loaded trucks, while top loaded single compartmented trucks are mainly used to collect selective MSW. Since there are three different containers for packaging materials, each site has to be visited three different times to collect each one (single-material routes). One alternative with great impact on route planning is the use of vehicles with more than one compartment, collecting at least two types of material simultaneously, which is in fact the topic of this thesis.
Nonetheless, even the single compartmented trucks have some upgrades that make collection more efficient, such as pressing function. According to Bing et al. (2016), the vehicle capacity increases from 150% to 200%, when compared to a vehicle without this function. Such trucks are used in the Netherlands, UK, Germany, and Portugal (Valorsul included).
Figure 2.2 - Ecoponto placed in the municipality and parish of Alcobaça (photo taken by the author)
10
2.2. Valorsul
This study was motivated by the recyclable MSW collection system of Valorsul – Valorização e Tratamento de Resíduos Sólidos das Regiões de Lisboa e do Oeste, S.A., a Portuguese company that has as mission to take the highest value from waste and packages not used, converting waste in valuable goods for society (Valorsul, 2016).
Valorsul is an inter-municipal SMAUT, responsible for the treatment and recovery of MSW. The company was founded in 1994, and today is a company of the holding EGF (Empresa Geral do Fomento, S.A.), recently privatized and handed over to SUMA and Mota Engil. Besides EGF – that owns 52,93% of the company –, Valorsul has more 6 shareholders that represent all 19 municipalities where Valorsul operates; five of them have an individually share – Lisbon (20%), Loures (11,51%), Amadora (5,16%), Vila Franca de Xira (4,61%) and Odivelas (0,54%) –, and the other 142 are represented by Associação de Fins Específicos AMO MAIS with a share of 5,25%.
Although the service area of Valorsul is around only 4% of the Portuguese territory, the company is responsible for collecting over one fifth of all MSW produced in Portugal. The company provides this service to 1,6 million inhabitants, that produce 1,3 kg/capita/day of MSW, which totals 472 kg/capita/year.
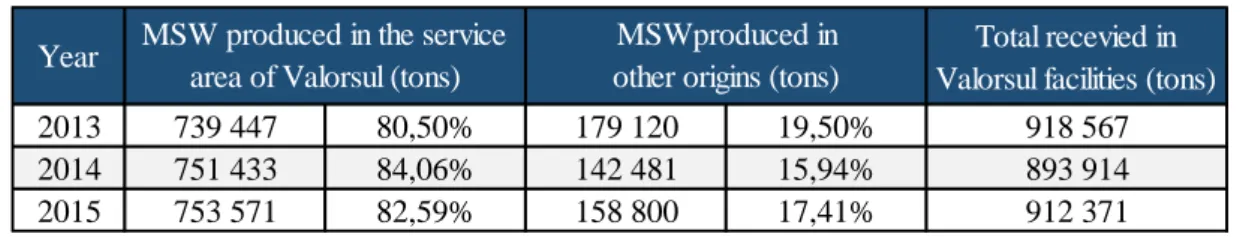
Valorsul also provides its services to private companies – collecting MSW that cannot be disposed on the typical street containers –, and receives MSW collected from other companies (Tratolixo, for example). In 2015, Valorsul directly collected approximately 83% of the 912371 tons of waste received in its facilities – see Table 2.1. To comply with PERSU 2020, there is a limit of MSW produced in the service area of Valorsul of 687614 tons for 2020.
2 Alcobaça, Alenquer, Arruda dos Vinhos, Bombarral, Cadaval, Caldas da Rainha, Lourinhã, Nazaré, Óbidos,
Peniche, Sobral de Monte Agraço, Torres Vedras, Azambuja and Rio Maior.
Table 2.1 - Records on the amount of MSW received in Valorsul facilities in 2013, 2014 and 2015 (Valorsul, 2016)
Year Total recevied in
Valorsul facilities (tons)
2013 739 447 80,50% 179 120 19,50% 918 567
2014 751 433 84,06% 142 481 15,94% 893 914
2015 753 571 82,59% 158 800 17,41% 912 371
MSW produced in the service area of Valorsul (tons)
MSWproduced in other origins (tons)
Valorsul also has the responsibility to recover all MSW received: 67% has as destiny incineration and/or energy recovery, 19% goes to a landfill, 8% is sorted, and 7% is recovered into organic matter (Valorsul, 2016).
In 2015, the company had 349 employees and finished the year with a turnover of 59 million euros. This result came from three main revenue sources: i) sales of recyclable MSW to SPV; ii) fees charged to Valorsul system users; iii) electricity sale to EDP (a Portuguese Energy Company), produced from the waste recovery in its facilities.
Valorsul manages the life cycle of MSW and covers different types of collection for the MSW produced in its service area: undifferentiated, of selective recyclable materials (the ones in study) and of organic matter (waste food and alike). The area where Valorsul operates is asymmetric and has two different geographical realities: the region of Lisbon (marked in grey in Figure 2.3) is an urban area, densely populated and with a wide variety and high prevalence of services; on the other hand, the western region (marked in green) is more rural and the populated areas are more dispersed. Valorsul is only responsible for selective collection in the 14 municipalities of the western region. The municipalities of Amadora, Lisbon, Loures, Odivelas and Vila Franca de Xira are responsible for their own collection of recyclable MSW; therefore, they are not to be considered.
Throughout the municipalities where the company operates, there is a vast network of facilities for treatment, recovery and disposal of the different types of MSW collected, based on their nature – see Figure 2.3.
12
Figure 2.3 - Network of facilities for treatment, recovery and disposal of Valorsul for the different types of MSW collected (Valorsul, 2016)
Icon Number Type of Infrastructure Short description
2 Sorting facility Sorting center where recyclabe MSW are received, separated, treated and then sent to recycling companies 1 Recovery and Treatment
of Organic Matter facility
Site where organic matter is processed and valued (to yield organic fertilizer, biogas and produce electricity) 1 Central Energy Recovery Undifferentiated MSW is burnt in this type of facilities to produce electricity 1 Recovery and Treatment
of Slag facility
This facility receives slags (materials generated from waste incineration), and separates ferrous metal, non-ferrous and inert
2 Landfill Site mainly used for the disposal of waste by burial
6 Transfer station Site used for temporary deposition of waste, aiming to optimize the cost/distance travelled; its function is similar to a cross-docking operation or a temporary warehouse 8 Ecocentro Public facility to dispose recyclable MSW, free of charge, that cannot be placed
2.2.1. Selective Collection
Valorsul is responsible for the selective collection of packaging materials (Paper and/ Cardboard, Glass, and Plastic and/Metal) in 14 municipalities of the western region, which includes 138 parishes. Table 2.2 shows the amount of recyclable MSW received between 2013 and 2015 in the sorting facility of the western region (CTRO – see its location in Figure 2.3), in number and in percentage of the total (ⁱ) received – which is the sum of the amount that entered in the CTRO and CTE.
When comparing 2015 with 2014, the only type of material that faced an increased in the amount received was Paper and/Cardboard (2%); Glass and Plastic and/Metal had a decrease in the amount received (of 1% and 2%, respectively). From all MSW received in CTRO in 2015 (13040 tons), 85% was directly collected by Valorsul (Valorsul, 2016).
Vehicle Fleet
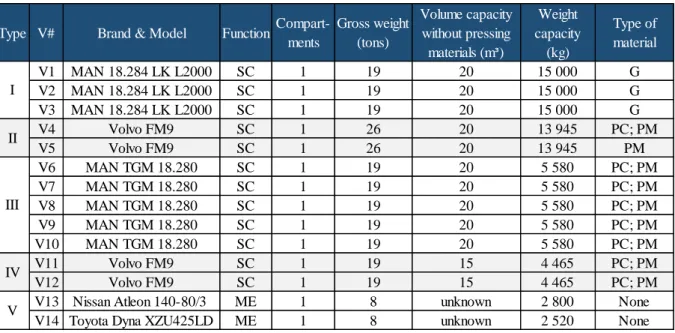
In 2013, Valorsul operated a heterogeneous fleet of 14 vehicles, described in Table 2.3, all based in CTRO – the only existing depot to serve the 14 municipalities.
Type V# Brand & Model Function Compart-ments Gross weight (tons) Volume capacity without pressing materials (mᶟ) Weight capacity (kg) Type of material V1 MAN 18.284 LK L2000 SC 1 19 20 15 000 G V2 MAN 18.284 LK L2000 SC 1 19 20 15 000 G V3 MAN 18.284 LK L2000 SC 1 19 20 15 000 G V4 Volvo FM9 SC 1 26 20 13 945 PC; PM V5 Volvo FM9 SC 1 26 20 13 945 PM V6 MAN TGM 18.280 SC 1 19 20 5 580 PC; PM V7 MAN TGM 18.280 SC 1 19 20 5 580 PC; PM V8 MAN TGM 18.280 SC 1 19 20 5 580 PC; PM V9 MAN TGM 18.280 SC 1 19 20 5 580 PC; PM V10 MAN TGM 18.280 SC 1 19 20 5 580 PC; PM V11 Volvo FM9 SC 1 19 15 4 465 PC; PM V12 Volvo FM9 SC 1 19 15 4 465 PC; PM
V13 Nissan Atleon 140-80/3 ME 1 8 unknown 2 800 None V14 Toyota Dyna XZU425LD ME 1 8 unknown 2 520 None I
II
III
IV
V
Table 2.3 - Fleet of vehicles of Valorsul (Lopes, 2014)
MSW received (tons) Totalⁱ Totalⁱ Totalⁱ
Paper and/Cardboard 4 601 16,3% 28 143 4 675 16,4% 28 524 4 770 16,7% 28 638 2% Glass 5 220 22,7% 22 957 5 007 21,8% 22 946 4 950 21,0% 23 535 -1% Plastic and/Metal 3 348 19,8% 16 894 3 383 19,3% 17 539 3 320 18,7% 17 765 -2% Total 13 169 19,4% 67 994 13 065 18,9% 69 009 13 040 18,6% 69 938 -0,2% 2013 2014 2015 ∆ CTRO (2015/2014)
CTRO CTRO CTRO
14
All vehicles have only one compartment (i.e., Valorsul only performs single-material routes), and their fuel consumption varies between 40L/100km and 60L/100km. The two Volvo FM9 have a system called Ampiroll, which allows the removal of their load container, and they are the only ones back loaded; all the other 10 vehicles used for collection are top loaded, using a lifting arm or a crane for that purpose.
The only vehicles that do not have pressing function are the ones used for maintenance (ME) and the ones of type I, which only collect glass.
Ecopontos
Typically, one ecoponto has at least one drop-off container for each material (blue for Paper and/ Cardboard, yellow for Plastic and/ Metal, and green for Glass) – see Figure 2.2 (page 9). However, different sites have different demands and one ecoponto do not necessarily has exactly one container for each type of material, or even the three types.
By 2013 – the year in study – Valorsul had 6959 drop-off containers for packaging materials, spread out across 2515 locations – see Appendix A. By the end of 2015, Valorsul had more 681 drop-off containers for packing materials (+10%), spread out across 2736 sites (+9%). Torres Vedras and Alcobaça are the municipalities with the highest percentage of ecopontos (20% and 14%, respectively). The one with the lowest is Óbidos, due to the existence of many ilhas ecológicas.
Collection Process
Any vehicle needs to have a route assigned before leaving the CTRO.
The collection process begins by setting circuits to a vehicle and consequently to the team that will operate it (a driver and an assistant). In order to design the route network, a computer software (GIS – Geographical Information System) analyses the filling level of every container (calculated based on historical and geographical data), estimating the required frequency to visit every collection site. The sum of the quantity to collect in one route cannot surpass the vehicle capacity. Therefore, it is important to consider the type and number of vehicles, as well as the number of workers available during the day (i.e., if they are already assigned to a route or not).
Every circuit begins and ends at the CTRO. They are all static, meaning that the visit sequence of the containers will not change during its course, whatever is the filling level of containers. The routes assigned should ensure that the vehicle returns fully loaded, optimizing costs and/ distance travelled, and that containers are completely collected (each container has to be collected in one single visit). Once a route is assigned, the vehicle leaves the CTRO (1) and goes to the first collection point of the circuit (2). On site, before collecting any material, one of the workers look for the level marks inside the container and then registers the approximate measure in a PDA, out of five possibilities: i) empty (0%); ii) less than half (25%); iii) half (50%); iv) more than half (75%); v) full
Figure 2.4 - Collection Process of Valorsul for recyclable MSW (adapted from Lopes, 2014)
16
(100%) – typically, the filling level is registered by excess. After this part, the container of the material being collected is raised with a crane and dumps its inside to the truck, emptying the container. The driver manoeuvres the crane and the assistant cleans the surrounding of the truck and container, if needed, and activate the compactor, in case the vehicle has pressing function. Then, the vehicle moves to the next collection point. This process is repeated until all containers under that route are collected, or the truck do not have enough capacity to move to any other site, forcing the vehicle to return to the CTRO (3).
After entering the CTRO, the vehicles go to a weighing-machine to register the weight of the amount of MSW collected (4). If the materials collected were Paper and/Cardboard or Plastic and/Metal, the vehicle unloads (5) its cargo at the sorting facility; if it was glass, the vehicle unloads at the glass deposit (this material is not sorted). After unloading, the vehicle moves to a fuel station that exists inside the CTRO (6). Depending on its condition, the vehicle may or may not need to be cleaned or washed (7). Finally, the vehicle is parked (8).
The last step of this process is the transmission of the data registered in the PDA, during the circuit (containers collected, filling levels, and distance and time travelled). This will update the system, influencing the routes over time. A software that estimates the evolution of filling levels uses this data, supporting route design.
Statistics about the collection of recyclable MSW
Table 2.4 presents some statistics on the collection of Paper and/Cardboard and Plastic and/Metal between January and June of 2013. All data was provided by Valorsul; Glass is not shown since data was not enough to make any conclusion.
Table 2.4 - Statistics on the collection of recyclable MSW by Valorsul, between January and June of 2013
Type of analysis Indicator Unit Paper and/ Cardboard Plastic and/ Metal
Number of routes performed routes 451 518
Amount collected kg 1 274 560 1 040 225 Travelled distance km 62 442 71 059 Duration hours 3 093 3 613 Amount collected kg 2 826 2 008 Travelled distance km 138 137 Duration hours 6,86 6,98
Amount collected per km travelled kg 23,2 16,2
Amount collected per hour travelled kg 414,6 290,4
Jan - Jun 2013 (totals) Per route (average) Performance (average)
3. Literature Review
3.1. Logistics Management
The Council of Supply Chain Management Professionals (CSCMP) – the largest professional association dedicated to this area – defines Logistics Management (LM) as the “part of supply chain management that plans, implements, and controls the efficient, effective forward and reverses flows, and storage of goods, services and related information between the point of origin and the point of consumption”. LM is an integrating function, which aims to coordinate and optimize all logistics activities, such as inbound and outbound transportation, fleet management, or logistics network design (CSCMP, 2016).
Historically, society has moved from reactive approaches, such as pollution control, to more proactive approaches (Govindan et al., 2015), such as product stewardship and sustainable development across the Supply Chain (SC), evolving the concept of LM. Although its first definition only considered the forward supply chain (from the producer to the end-user), it is today recognized that the product life cycle does not necessarily end with the final customer (Shibao et al., 2010). Stock (1992) was one the first authors to approach this issue, studying the reverse flow with emphasis on managing returns as a problem to be solved. This author related Reverse Logistics (RL) with all logistic activities performed in recycling, reuse and disposal of products and packaging waste.
The relationship between RL and Waste Management has been recurrently addressed in the literature. The latter mainly refers to the processes that manage waste efficiently and effectively through its life cycle, such as waste collection (WC), the topic in study. In turn, RL concentrates on those streams where there is some value to be recovered, with the outcomes entering into a new supply chain (de Brito et al., 2004), which may or may not contribute to environmental sustainability. WC is in charge of taking-back MSW from collection points to an appropriate disposal facility, and is a RL problem, where typically many points need to be collected with only one delivery point, vs. deliveries from one point to many destinations in the forward logistics problem (Han et al., 2015). Although RL started to be used to refer the efforts in reducing the environmental impacts of enterprises and supply chains (Carter and Ellram (1998), cited in Carvalho, 2010a), it is today stated that Green Logistics is a more correct designation: forward logistics activities also have a significant environmental impact, not only reverse (de Brito et al., 2004).
18
A RL system starts from end-users, where products are collected (return products) and has as primary goal to manage end-of-life (EOL) products through different flows and recovery practices: remanufacture, repair, reuse, refurbishing, resale, recycling, scrap or salvage (Govindan et al., 2015). As Fleischmann et al. (1997) stated, a RL network can be motivated by the possibility of reusing products and materials. Their reuse is responsible for creating new flows from the end-user back to producers and suppliers. The same authors identify three main logistics activities related to the stages of transport and transformation of the reuse process: i) planning of reverse distribution; ii) inventory management; iii) production planning. This thesis will focus on the first one, which aims for organizing the collection and transportation of used products from their disposal site (such as drop-off containers).
De Brito et al. (2004) proposed a framework based on the following four questions, which explains the various ways in which RL activities are performed: 1) which products are entering (product-in) the RL network, and which ones are leaving it (product-out)?; 2) how is the main recovery process managed?; 3) who are the actors and which role do they play in the RL network?; 4) why are the products being returned, i.e., which ones are the driving forces and the reasons for initiating a RL network?
In order to answer the first question (1), the authors identified seven categories: i) civil objects (like buildings or bridges); ii) consumer goods; iii) industrial goods; iv) ores, oils and chemicals; v) other materials (such as glass); vi) distribution items; vii) spare parts. As for the recovery process (2), it can be direct (re-sale, re-use or re-distribution), or indirect (repair, refurbishing, remanufacturing, recycling, incineration or disposal). Regarding the third question (3), the authors divided the actors intro four groups: i) forward supply network actors (manufacturers, wholesalers, retailers or service providers); ii) specialized RL actors (recyclers, municipalities or external service providers); iii) governmental entities (such as the EU or national governments); iv) opportunistic players (ONGs). Finally, the drivers that may boost a RL network (4) can be of economic or legislative origin, and of corporate citizenship nature; product returns can be reasoned by manufacturing, distribution or commercial reasons. Summing up, the complexity of waste recycling decisions are determined by external factors (such as EU regulation, change in oil prices, and varying interests of householders, collection companies and municipalities). In order to meet the future demand of sustainability, the output of the decision-making on MSW management has to be a sustainable performance (see Figure 3.1).
In the context of RL – and therefore in the context of MSW management –, de Brito et al. (2005) stated that companies have to make several strategic, tactical and operational decisions (pursuing the ideas developed by Fleischmann et al., 1997). Lambert et al. (2011) presented a framework based on these three hierarchical levels of planning and execution, dividing them into seven elements: coordination system; gatekeeping; collection; separation; treatment; information system and disposal system. The latter authors applied their framework to three case studies, analysing each of the referred elements in terms of process, cost and performance. A collection system to operate needs vehicles and must count on infrastructures such as transfer stations, which are significantly costly. Rogers et al. (2012) found that in any RL network is necessary to use mathematical models to make an effective planning and management of its system. There are mainly two subjects regarding the modelling of these type of problems: i) logistics network design (number of facilities, their location, size and area of influence); ii) route planning (places to visit and in which sequence and moment). According to Lambert et al. (2011) the number and the location of facilities can be set as strategic, while its dimension, size and area of influence are tactical decisions. Route planning is related to operational ones. The work hereby presented will focus on tactical and operational decisions: changing the type of vehicles from single-compartmented to multi-compartmented ones may force to adjust the area of influence of each facility and the route planning of the company in study. Strategic decisions do not arise since changes in the number, location and size of the depots will not be addressed.
20
3.1.1. Transportation Management
The performance of any SC depends on the efficiency of its logistics system, and transport management is a key activity: it is responsible for absorbing between one to two thirds of the total logistic costs of a company (Ballou et al., 2002). Particularly in those whose points of operation are geographically scattered, companies are highly dependent on transport systems, as well as particularly vulnerable to their weaknesses.
The collection (or distribution) of products is a practical and challenging problem of LM. For a company managing a recyclable MSW collection system, as Valorsul, collection (transport) costs represent about 70% of the total (Ramos et al., 2014). Waste must be collected continuously throughout the year, and transport cost does not spot increasing (Abdelli et al., 2016). By using the collected data and the appropriate analytical tools, a company may optimise its daily operations for collection and transportation in terms of quality of service and costs. Transport-planning decisions result in the definition of routes and the visit sequence of each one, i.e., definition of the routing and scheduling problems. The solution must meet the basic rule of routing problems, which is, “…a vehicle of collection starts its trip with an empty tank and ends it with a full tank along a minimum route and in a minimal possible time (Abdelli et al., 2016)”.
Nonetheless, besides the nature of the business, there are many factors and constrains to consider when solving a routing problem, such as (Carvalho, 2010b) – for the purpose of the study only road transport is considered:
i) Features of the road network: i) distance between nodes (variable costs, such as fuel, tires or maintenance, increase in proportion to the distance travelled; fixed costs – such as salaries, equipment and infrastructure maintenance and insurances – do not depend on the distance); ii) road conditions and service area (urban or suburban, symmetric or asymmetric), which have direct influence on travel time;
ii) Characteristics of the fleet (number, capacity, performance and filling speed);
iii) Return on empty (if the vehicle is not completely full, for example, transport costs increase);
iv) Characteristics of the points to visit, i.e., customers: i) location; ii) demand and/or supply; iii) capacity; iv) density of the cargo (the collection/transport cost per tonne decreases with an increase in cargo density); v) volume of the cargo (transport costs per
unit volume decreases with increasing volume as a result of dilution of fixed costs); vi) size of the cargo (very dependent on the delivery/pick-up frequency).
The more information a company has in advance, the better and more constant is the planning (static routing). If the set of customers to be visited by each vehicle and the visit sequence are established on a daily basis, then the company faces a more dynamic routing.
As for the vehicle itself, there are also some aspects that may be improved to support a more efficient management and positively affect routing (Carvalho, 2010b):
i) Efficient use of vehicles (handling systems, efficient use of space, cooperation in transport and cargo consolidation);
ii) Route optimization (reduction in the number and distances of routes, reduction of transport speed, usage of more IT planning);
iii) Consumption efficiency (driver behaviour - eco driving, fleet management, preventive maintenance);
iv) Technological innovation (usage of efficient fuels and engines, better tires, and more aerodynamics).
MSW collection, the topic in study, can be treated as a Vehicle Routing Problem (VRP). Its classical form, variations, and solution methods will be addressed in more detail in the next sections.
22
3.2. Vehicle Routing Problem
Routing problems are identified in the literature as one of the main problems companies face when managing their SC; for this reason, they have been widely studied due to the economic importance of developing efficient techniques for optimization in transportation (Cacchiani et al., 2014).
3.2.1. General Definitions and Notation
The Vehicle Routing Problem (VRP) plays a central role in physical logistics and is an important combinatorial optimization problem. It “…consists of designing least cost delivery routes through a set of geographically scattered customers, subject to a number of side constraints” (Laporte et al., 2013).
The components to consider when studying a routing problem are the road network, customers, depots, vehicles and drivers. Toth et al. (2002a) related all of them: the distribution or collection of goods “…concerns the service, in a given time period, of a set of customers by a set of vehicles, which are located in one or more depots, that are operated by a set of crews (drivers), and perform their movements by using an appropriate road network”.
VRPs are an extension of the travelling salesman problem (TSP) – the most common practical interpretation of the TSP is that of a salesman (i.e., one vehicle) seeking to travel the minimum distance possible, visiting all cities (customers) once and only once, during one day (Laporte, 1992).
In a VRP (i) more than one vehicle can be traveling around a network; the number of vehicles is either an input value or a decision variable (Cordeau et al., 2005). All (ii) routes begin and end at the same place (a depot node), (iii) after all customers were visited and their known demand satisfied; (iii) each one has to be visited by exactly one vehicle and (iv) cannot be visited more than one time per route, over a given planning horizon (the classical VRP considers only one day) (Reed et al., 2014).
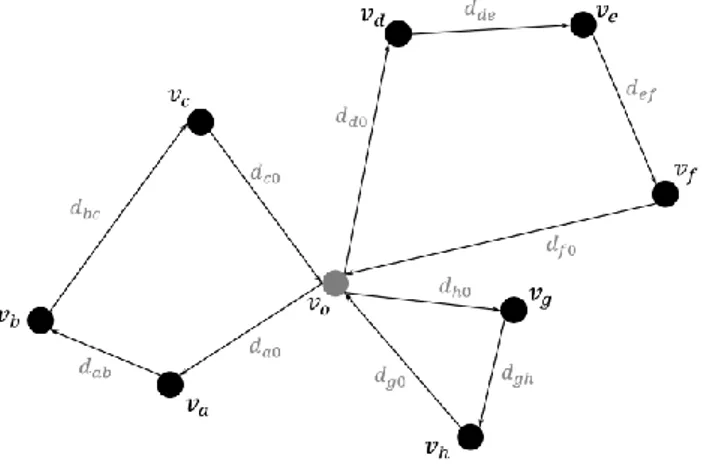
A road network, and therefore a VRP, is described through a complete undirected graph 𝐺 = (𝑉, 𝐸) (Cordeau et al., 2005) – see Figure 3.2 –, where 𝑉 = (𝑣0, 𝑣1, … , 𝑣𝑛) is the set of nodes (vertices) and 𝐸 = {(𝑣𝑖, 𝑣𝑗) ∶ 𝑣𝑖, 𝑣𝑗 ∈ 𝑉, 𝑖 < 𝑗} the set of edges. The node 𝑣0 typically represents a depot, where 𝐾 homogeneous vehicles of capacity 𝑄 are based. The remaining vertices are customer locations, and may be associated with a non-negative demand (𝐷𝑖), and/or
supply (𝑆𝑖). Each arc (𝑖, 𝑗) represent a road section, connecting the nodes, and is associated with a non-negative cost (𝑐𝑖𝑗), distance (𝑑𝑖𝑗) or travel time (𝑡𝑖𝑗); each customer may have a non-negative drop time 𝑑𝑡𝑖, i.e., the time to deliver or collect a product. A VRP aims to find a set of 𝑛 routes that fulfils one of the following objectives, or any weighted combination of them (Toth et al., 2002a):
Minimization of the global transportation cost, dependent on the global distance travelled (or on the global travel time) and on the fixed costs associated with the used vehicles (and with the corresponding drivers);
Minimization of the number of vehicles (or drivers) required to serve all the customers; Balancing of the routes, for travel time and vehicle load (decrease variation);
Minimization of the penalties associated with partial service of the customers;
The representation of a VRP in a graph can be classified as a Node Routing Problem, which considers distribution/collection of goods point to point, i.e., demand and/or supply is at the nodes. However, there are also Arc Routing Problems, which considers distribution/collection of goods along the edges of a road network, i.e., demand/supply exists along the arcs of the graph. This dissertation will only discuss Node Routing Problems.
Figure 3.2 – Illustration of a simple directed graph made up by 8 nodes and 1 depot, with 3 defined clusters
24
3.2.2. Solution Methods
When Dantzig and Ramser first introduced the TSP almost 60 years ago, they formulated a problem with only 12 delivery points and 1 bulk terminal to find the optimum routing of a fleet of gasoline delivery trucks (Dantzig and Ramser, 1959). Today, due to a steady evolution in the design of solution methodologies, vehicle routing is one of the most studied problems in operations research and applies to a wide variety of industries. This approach to reality hinders problem solving, mainly for two reasons: i) complexity and limitations of computation; ii) large number of problem constraints (a closer a problem is to reality, the more constraints have to be considered).
An increased number of clients generate an exponential increase in the number of possible solutions – Lenstra et al. (1981) have classified the VRP as a NP-hard combinatorial problem. For this reason, several solution methods have been proposed for the VRP, which can be broadly classified into three main classes: i) exact algorithms; ii) heuristic algorithms; iii) metaheuristics.
Exact methods guarantee that the optimal solution is achieved, but only if the method is given enough time and space. Their efficiency relies on two variables: problem size and computational time. The time taken by this kind of methods to find an optimum solution to a VRP sometimes is so long that in many cases it is inapplicable (Martí et al., 2011). Exact methods can rarely tackle problems that involve more than 100 nodes; they are mainly used to solve small instances (Laporte et al., 2013). Branch-and-bound or branch-and-cut are two examples of exact algorithms (see Cordeau et al., 2007).
Heuristic methods (or approximate) only attempt to yield a good solution – not optimum – but they are often used to solve real optimization problems when the process speed is as important as the quality of the solution obtained (effectiveness). In addition to the need to find a good solution in a reasonable time, Martí et al. (2011) also highlighted that heuristic methods are more flexible than the exact ones, allowing to add constrains difficult to model. Heuristic methods can be divided into classical – see 3.2.2.1 –, mostly developed between 1960 and 1990 (Toth et al., 2002b) and modern (metaheuristics) – see 3.2.2.2 –, whose development started in the 90s (Laporte et al., 2013).
Classical Heuristics
Laporte (2007) explains that the term “classical” refers to the fact that the improvement steps of these heuristics always proceed from one solution to a better one in its neighbourhood, until no further gain can be achieved. They are broadly classified into three categories (Toth et al., 2002b): constructive heuristics, two-phase heuristics or improvement heuristics.
Constructive Heuristics
Constructive heuristics do not contain an improvement phase per se, but they gradually build a feasible solution focused on solution cost (Toth et al., 2002b): they involve building a solution to the problem gradually, from scratch. One of the most popular construction heuristic is the one developed by Clarke and Wright, in 1964, the so-called savings algorithm: there is a cost reduction when two customers can be served in the same route, opposed to deliver or collect goods directly to them from the depot, i.e., when two routes can be merged into a single-one (Carvalho et al., 2010b). This algorithm, illustrated in Figure 3.3, naturally applies to problems for which the number of vehicles is a decision variable.
The savings achieved by travelling from customer 𝑖 to customer 𝑗 before returning to the depot (origin) 𝑣𝑜 is given by 𝑆𝑖𝑗 = 2 (𝑑𝑖0+ 𝑑𝑗0) − (𝑑𝑖0+ 𝑑𝑖𝑗 + 𝑑𝑗0) = 𝑑𝑖0+ 𝑑𝑗0− 𝑑𝑖𝑗, where 𝑑𝑖0 is the distance from the customer 𝑖 to the depot 𝑣0; 𝑑𝑗0 is the
distance from customer 𝑗 to the depot; and 𝑑𝑖𝑖 is the distance between both customers 𝑖 and 𝑗. The algorithm is as follows: i) calculate the savings for every pair (𝑖, 𝑗); ii) rank the savings and list them in descending order of magnitude; iii) for each saving, include link (𝑖, 𝑗) in a route, if no problem constrain is violated; iv) if the savings list has not been exhausted, repeat step (iii) until all customers are included in a route.
While this algorithm is not the best available in terms of accuracy, it is rather fast and simple to implement (Laporte, 2007). The biggest disadvantage of this method relates to the fact that the inclusion of the best saving in a given step can prevent a new connection to generate greater savings (Carvalho et al., 2010b). There are extensions to the savings heuristic in the literature,
Figure 3.3 - Illustration of the Savings Algorithm
26
as well as other classical route construction heuristic, such as the sequential insertion algorithms (see Toth et al., 2002b; Laporte, 2007; Martí et. al., 2011).
Two-phase Heuristics
The two-phase heuristics decomposed the VRP solution process into two separate issues: (i) clustering and (ii) routing. The first aims to determine a partition of the customers into subsets, each corresponding to a route, while the second aims to determine the sequence of customers to visit on each route (Cordeau et al., 2007).
In a cluster first – route second method customers are first grouped into clusters and only then it is determined a vehicle route for each cluster. In 1974, Gillet and Miller developed the sweep heuristic based on the mention method, which is illustrated in Figure 3.4. The algorithm starts by (Cordeau et al., 2007) (i) choosing a random customer, and then, (ii) sequentially assigning the remaining customers to the current vehicle (route), considering them in order of increasing polar angle with respect to the depot and the initial customer. When the (iii) vehicle capacity is at its maximum and no more customers can be assigned to the current route, a new one is initiated. After assigning all vehicles, (iv) each vehicle route has to be optimized separately by solving the corresponding TSP, i.e., by visiting each customer only once and making the vehicle travel the minimum distance possible.
Fisher and Jaikumar (1981) – see Sethanan et al. (2016) – proposed another type of heuristic based on a two-phase decomposition procedure; the algorithm developed by the authors solves the clustering step through the solution of a Generalized Assignment Problem (GAP), instead of using a geometric method like the sweep algorithm. Each vehicle is assigned a representative customer (a seed) and the assignment cost of a customer to a vehicle is equal to its distance to the seed. Routes are determined by solving a TSP for each cluster (Cordeau et al., 2007). The authors do not specify how to handle distance restrictions – see extensions to their heuristic and others based on a cluster first – route second approach in Toth et al, 2002b.
Moreover, there is also route first – cluster second methods, where a giant TSP tour over all customers is built, and then split into feasible routes (Cordeau et al., 2007). The savings
Figure 3.4 - Illustration of the Sweep Algorithm
algorithm (explained in the previous page) can be considered a route first – cluster second heuristic. More examples of such algorithms are given in Toth et al., 2002b.
Route improvement heuristics
Route improvement heuristics for the VRP are often used to improve initial solutions generated by other heuristics, using local search algorithms – starting from a given solution, this method applies simple modifications, such as arc exchanges or customer movements, in order to achieve a better solution and reduce cost (Cordeau et. al, 2007). Such heuristics can be performed on each vehicle route separately (intra-route movements) or on several routes at a time (inter-route movements) (Toth et al., 2002b).
Lin (1965) proposed the 𝜆-opt heuristic, where 𝜆 edges are removed and then replaced by other 𝜆, from the given solution – typically 𝜆 assumes the values of 2 or 3 in practice (Cordeau et al., 2007). Other local search algorithms are (Groër et al., 2010): i) the one-point move, where an existing node is relocated into a new position; ii) the two-point move, that consists in swapping the position of two nodes; iii) the three-point move, where the position of a pair of adjacent nodes swap with the position of a third node.
Metaheuristics
Metaheuristics perform a more thorough search of the solution space and are less likely to end with a local optimum (as opposed to classical heuristics). Although they embed procedures from classical construction and improvement heuristics, they outperform classical methods in terms of solution quality, and sometimes in terms of computing time. Cordeau et al. (2007) presented three classes for metaheuristics, all applied to the VRP (see Toth et al., 2002c): i) local search (LS); ii) population search (PS); iii) learning mechanisms (LM).
LS methods (i) start with some feasible solutions to a problem and progressively improves them (Martí et al., 2011). These kind of algorithms explore the solution space by iteratively moving an initial (current or random) solution 𝑠0, moving at each interaction 𝑡 from the solution of value 𝑓(𝑠𝑡) to another solution located in the neighbourhood 𝑁(𝑠𝑡) of 𝑠𝑡. This neighbourhood represents all the solutions that can be reached from 𝑠𝑡 by applying some transformation to the system, such as relocating a node from one route to another. The LS goes on until a stopping criterion is satisfied, such as a pre-set number of consecutive iterations without any