INTRODUCTION
The growing global interest in preserving the environment from solid waste resulting from various human activities and transformations has attracted the attention of industrialists to find the technical means to reduce or otherwise exploit it. Many agricultural and industrial wastes are already undergoing recycling experiments for the production of porous fired clay bricks lighter than traditional bricks which, in particular, have better insulation capacity. The use of waste in fired clay brick production may also save clay from avoidable depletion and reduce the environmental contamination by waste, contributing to sustainability. Recently, clay-based bricks with the beneficial utilization of industrial “scrap-soil” as admixture have been developed and characterized, in order to contribute to the circular economy, environmental protection and conservation of natural resources [1]. Many researchers have also presented reviews on the reuse of agricultural and industrial waste
in fired clay bricks. This includes, for example, the use of sawdust, coal, paper sludge and straw [2], spent grains [3], rice husk ash [4], sludge waste from natural rubber manufacturing process [5], rubber [6], industrial laundry mud [7], paper processing wastes [8], waste tea [9], sawdust, tobacco and grass [10], cherry seeds [11], cigarette butts [12, 13], bagasse waste [14], sugarcane bagasse ash [15], high Ca-fly ash [16], quarry waste and slag [17], granite powder [18], natural fibers [19], silica fume [20], waste from olive oil mills [21-24], and ground olive stones [25].
Dates are important as a food (easily stored and transported) and a source of building material, as the fronds provide fiber for thatching roofs and making baskets, while the tree trunks are used for construction [26]. They are a typical natural waste, readily available in large quantities in a number of countries. They are usually discarded, so it is essential to develop and diversify the use of such an abundant and accessible material. Date pits have significant potential in construction. Pulverized ground date pits are being used on a small scale on dirt roads as a type of road base gravel [27]. Almograbi [28] has reported that the large quantity
Influence of the diameter of ground date pits on the
technological properties of clay bricks
(Influência do diâmetro de caroços de tâmara moídos nas
propriedades tecnológicas de tijolos de argila)
G. Djafri1, N. Chelouah1*
1University of Bejaia, Faculty of Technology, Laboratory of Construction Engineering and Architecture, 0600 Bejaia,Algeria
_______________________ *[email protected]
Abstract
The main aim of this study was to evaluate the effect of diameter of ground date pits (GDP) on the technological properties of a clay brick. For this purpose, increasing amounts of GDP (0, 5, 10, 15 and 20 wt%) with different diameters were mixed with a clay to produce
clay bricks by pressing, drying and then firing at 900 °C. The GDP diameter and content changed the water requirement for plasticity. The shrinkage, water absorption and apparent porosity of fired clay brick increased with the content and diameter of GDP. The compressive
strength, apparent density and thermal conductivity of the samples decreased with the increase in diameter and content of GDP. With the help of SEM micrographs, it was observed that the combustion of added GDP in the mixture led to a reduction in the diameter of pores
formed in the fired clay brick samples.
Keywords: date pits, clay, pores, brick, physical properties, mechanical properties.
Resumo
O principal objetivo do presente estudo consistiu em analisar o efeito do diâmetro de caroços de tâmara moídos (CTM) nas propriedades tecnológicas de um tijolo de argila. Para esse propósito, foram misturadas quantidades crescentes de CTM (0, 5, 10, 15 e 20 wt%) com diferentes diâmetros a uma argila para produzir tijolos cerâmicos por prensagem, secagem e queima a 900 ºC. O diâmetro e a fração de CTM alteraram o teor de água necessário para plasticidade. A retração, a absorção de água e a porosidade dos tijolos após queima aumentaram com a fração e o diâmetro do CTM. A resistência à compressão, a densidade aparente e a condutividade térmica das amostras diminuíram com o aumento do diâmetro e da fração de CTM. A partir de micrografias de MEV, foi observado que a combustão do CTM adicionado causou a redução do diâmetro dos poros formados nas amostras de tijolo queimado.
of date palm seed waste has led to studies focusing on the possible use of this waste as aggregates in special structural lightweight concrete. Date palm seeds are lightweight, making the resulting concrete also lightweight. This may significantly reduce the total dead load of a structure, resulting in smaller structure members. The behavior of date palm seed concrete is similar to the other conventional lightweight concretes in terms of durability properties. Experiments on unfired masonry clay bricks mixed with palm fronds and date pits for thermal insulation applications were carried in [29]. The composite made of clay as a matrix with date pits as a dispersed phase showed greater toughness than the composite made of clay matrix with olive husk as the dispersed phase. This makes date pits a better alternative when moldability or manufacturability is an issue. The use of wastes such as the date pits for producing useful components would be very attractive for the economy. In the present study, the effects of the incorporation of ground date pits (GDP) with different contents (0, 5, 10, 15 and 20 wt%) and diameters (0-0.2, 0.2-0.25, 0.25-0.5 and 0.5-1 mm) on the technological properties of a fired clay brick are analyzed.
EXPERIMENTAL
Materials: the clay used came from Bejaia in Algeria.
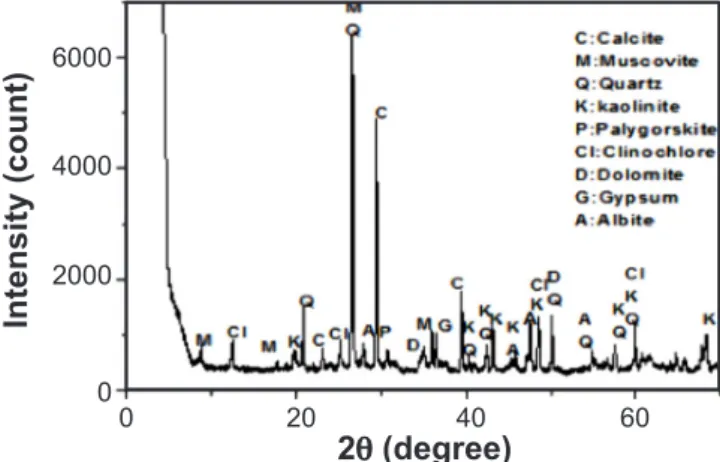
The oxide mass percentages of the sample, as well as the loss on ignition (LOI), are presented in Table I. Oxides such as Fe2O3, CaO, K2O and Na2O acting as effective fluxes are known to lead good properties when fired. A clay is considered as calcareous if it contains more than 6 wt% CaO [30]. If K2O, Fe2O3, CaO, MgO and TiO2 concentration amount to more than 9 wt%, the clay is referred to as low refractory, otherwise it is referred to as highly refractory [31]. From this perspective, the raw material used in this study can be considered as calcareous, with low refractory properties. The loss on ignition shows the weight loss of the dry sample, which was 16.50%. This can be explained by the high lime content in this sample. This clay is thus suitable for the production of porous brick. The X-ray diffraction pattern of the clay (Fig. 1) showed that it was primarily composed of calcite, quartz and muscovite. The presence of quartz is quasi-systematic, coming from the geological clay formation process. The presence of kaolinite in this sample contributed to good workability and drying of the ceramic
products. By linking the results of the X-ray diffraction analysis to those of the ultimate chemical analysis (X-ray fluorescence spectroscopy), the crystalline phases detected in the clay sample can be quantified by calculation. The crystalline phases largely contained in the clay used were primarily represented by the following minerals: quartz, calcite, muscovite, kaolinite and albite (Table II). This type of clay consists of sandy grains (15%), clay particles (20%) and the dusty grains (65%). This showed the clay powder presented the greatest fraction of grains of diameter between 2 and 20 mm. This value of 65% indicated that, in accordance with the grain size range, the clay powder is adequate for obtaining good green density during compaction and good reactivity during firing. This clay brick raw material has a low concentration of sand and, consequently, high plasticity.
The pits of dates from Biskra in Algeria were the refuse from a jam manufacturing plant. They were cleaned after the separation of their shells. They were then ground and sieved to obtain spherical particles with sizes of 0-0.20, 0.20-0.25, 0.25-0.50 and 0.50-1.0 mm in diameter. The date pits mainly consist of substances characteristic of organic matter (carbohydrate, proteins and lipids), cellulose and ashes (Table III). Cellulose is a polysaccharide polymer of glucose which is one of the principal components of the vegetable cell wall. It is the bio-polymer responsible for most mechanical resistance. In order to find out the behavior of ground date pits (GDP) during firing, thermogravimetric (TGA) and differential thermal analysis (DTA) were used (Fig. 2). In the DTA curve, four steps were observed: one
SiO2 Al2O3 CaO Fe2O3 MgO K2O Na2O SO3 TiO2 P2O5 LOI
43.30 13.35 15.34 5.01 1.89 2.03 1.06 0.71 0.63 0.19 16.50
Table I - Chemical composition of the clay (wt%).
[Tabela I - Composição química da argila (% em massa).]
Table II - Mineral composition of the clay (wt%).
[Tabela II - Composição mineral da argila (% em massa).]
Quartz Calcite Muscovite Kaolinite Albite Gypsum Dolomite Palygorskite Clinochlore Ferruginous minerals
22 26 17 10 6 2 3 5 4 5
Figure 1: X-ray diffraction pattern of the clay. [Figura 1: Difratograma de raios X da argila.]
6000
4000
2000
0
2q (degree)
Intensity (count)
40
20 60
endothermic and three consecutive exothermic peaks; the loss of mass was showed by the TGA signal. In the first step, at 105 °C, the sample lost its low moisture. In the second peak, the elimination of fat occurred, between 200 and 210 °C, and the loss of mass was marginal, indicating that the proportion was low (4%). Decomposition of cellulose and the degradation of carbohydrates appeared between 200 and 300 °C [32, 33] with significant weight loss (29.44%) corresponding to the third exothermic peak at 295 °C in the DTA curve. Between 350 and 400 °C, the TGA curve showed a progressive weight loss of 42.09%. The fourth exothermic peak, at around 380 °C, was related to the elimination of the cellulose molecules [32, 33]. Weight loss became insignificant after 650 °C. Finally, in the interval of 50 to 650 °C, the TGA curve showed a total
loss of weight of 75.55%, indicating that ash was produced during combustion.
TGA curves in Fig. 3 show that the weight loss of the
sample with 5% of GDP was more significant than that of the control sample (0% addition). This can be explained by the consumption of the GDP in the clay body, as shown by the TGA curve of the GDP in Fig. 2. During the heating cycle, the sample with 5% GDP showed a weight loss of about 21.5%. On the other hand, in the sample without GDP the loss was about 16.5%. The difference between the two losses was 5%, which represented the combustion of the GDP in the body of the clay. This thermal analysis showed three main losses of mass, attributed to the evaporation of moisture, water of constitution and organic matter, as well as decarbonation (decomposition of carbonates). According to this analysis, the loss in mass of clay with 5% GDP (21.50%) was responsible for the formation of pores during the firing of clay bricks. This showed that the organic matters in clay and GDP are easily consumed during firing.
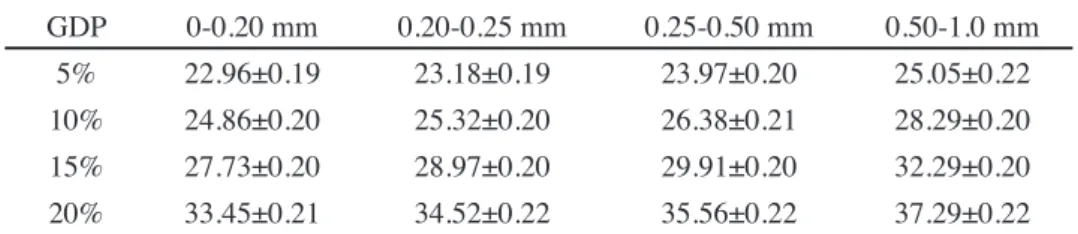
Before the samples were prepared by pressing, the water content of the clay and mixtures with different contents (5 to 20 wt%) and diameters (0-0.20 to 0.50-1.0 mm) of GDP was determined with the Atterberg limits method [34] to ensure good plasticity, which is an important parameter in the production of clay bricks. Table IV shows the increase in the water content of the mixture (clay-GDP) as a function of the increase in diameter and content of GDP. It has been found Moisture Carbohydrate Protein Lipid Cellulose Ash
6.46 50.50 7.22 9.51 16.20 10.20
Table III - Chemical composition of ground date pits - GDP (wt%).
[Tabela III - Composição química dos caroços de tâmara moídos - CTM (% em massa).]
0.40
0.30 0.35
0.20 0.25
0.10
0.05 0.05
0 0
Temperature (ºC)
DT
A
(µV)
TGA
(%)
200 400 600 800 1000 100 90 80 70 60 50 40 30 20 10 0
Figure 2: TGA and DTA curves of GDP.
[Figura 2: Curvas de TGA e DTA de CTM.]
5
0
-5
-10
-20 -15
-25 0
Temperature (ºC)
TGA
(%)
200 400 600 800 1000
Figure 3: TGA curves of the sample containing 5 wt% of GDP compared with the control sample.
[Figura 3: Curvas de TGA de amostra contendo 5% em massa de CTM em comparação com a amostra de controle.]
GDP 0-0.20 mm 0.20-0.25 mm 0.25-0.50 mm 0.50-1.0 mm
5% 22.96±0.19 23.18±0.19 23.97±0.20 25.05±0.22
10% 24.86±0.20 25.32±0.20 26.38±0.21 28.29±0.20
15% 27.73±0.20 28.97±0.20 29.91±0.20 32.29±0.20
20% 33.45±0.21 34.52±0.22 35.56±0.22 37.29±0.22
Note: value for the clay without GDP = 22.35±0.19%.
Table IV - Water content for plasticity (%) of clay-GDP mixtures as a function of diameter and content of the GDP.
that increasing the percentage of GDP in the clay increased the water content necessary for the plasticity of the clay-GDP mixture. The diameter of the clay-GDP also affected the increase in the water content of the mixture, which was very low. The increase in the water content for plasticity of the mixture was related to the high water absorption of the pores of GDP, which was in the range of 4.7 to 8.1 μm (Fig. 4). The cellulose content of GDP (16.20%, Table III) affected the water content of the clay-GDP mixture. Demir et al. [2] reported that the capability of cellulose fiber to absorb water into its naturally existing water channel is the main reason for the increased water requirement for plasticity.
Preparation of the samples: five series of clay brick
samples for each diameter of GDP (5 samples in each series) were prepared for testing according to the added GDP fraction (0, 5, 10, 15 and 20 wt%). The mixture (clay-GDP) was stirred for 3 min in order to ensure it was uniform and that the clay grains were closely mixed with those of the GDP. A hydraulic press with a uniaxial load was then used to press the mixture in molds (40 x 40 x 160 mm for measurement of physical-mechanical properties and 20 x 80 x 160 mm for measurement of thermal properties). The samples formed were air-dried in the laboratory for 72 h, then dried again in an oven at 105 °C until there was no weight loss, to ensure the complete elimination of the free water and prevent cracking during firing. The firing process was carried out in a kiln with an initial slow heating rate of 2 ºC/min (to ensure the incineration of organic substances without them catching fire) up to 600 °C, then 5 °C/min until 900 °C. The samples were then cooled to room temperature in the furnace to prevent thermal shock.
Methods: the mineralogical composition of clay was determined by X-ray diffraction (Siemens, D5000). An X-ray fluorescence spectrometer (Siemens, SRS 300) was used to determine the chemical composition of the major
components of clay and GDP. Differential and gravimetric thermal analyzes (DTA and TGA, Netzsch, STA 409 PC Luxx) were used to investigate the thermal stability and transformations of raw materials at a heating rate of 15 °C/min, in the range from 30 to 1000 °C. The analyses of the fatty substances in the date pits were carried out with a Soxhlet equipment. The GDP porosity was evaluated by scanning electron microscopy (SEM, FEI, Quanta 200). The apparent density, apparent porosity and water absorption of samples were assessed in accordance with the ASTM C 773-88 and C 373-88 standards [35]. The linear shrinkage after drying and firing was determined using calipers with a precision of ±0.01 mm. The compressive and flexural strengths of bricks after drying and firing were determined with a testing machine (Controls, 65-L11D2) applying the load centered to the surface of brick at 20 MPa/s until rupture. The water absorption coefficient test was determined according to the standard NA 1957 [36]. The principal surface of each sample was placed in contact with water, while the samples were stored in stainless steel containers for 10 min (ten-minute test). A 5 mm height spacer was placed on the bottom of the container as a support for the sample and to guarantee a definite thickness of the layer of water between the test surface and the bottom of the container. The water absorption coefficient, C (%), for brick was calculated by the following equation:
C = (M.100)/(S.t1/2) (A)
where M is the mass (g) of absorbed water by the brick, S is the surface area (4 x 16 cm2) of the immersed face, and t is
the time of immersion (10 min). A transient hot-wire method was used to measure thermal conductivity. The apparatus (Remy SAS, FP2C) consisted of a line-source probe placed between two samples of fired clay brick contained in a constant-temperature environment. During the measurement, the line-source probe produced a precise amount of heat. The resulting temperature transient was recorded on a computer data-acquisition system. This transient was analyzed to obtain the thermal conductivity. Mercury intrusion porosimetry (Thermo Fisher Sci., Pascal 140/240) was used to determine the pore size distribution in the 0.01-1000 μm range.
RESULTS AND DISCUSSION
The shrinkage of bricks after drying showed a small increase in terms of the GDP diameter. In the same way, in terms of the content of GDP, brick shrinkage was also slightly increased (Fig. 5a). When clay starts to dry, water evaporates from it. As this happens, the particles of clay are drawn closer together resulting in shrinkage. The reasons for the increase in shrinkage (in terms of diameter and GDP content) are related to the proportional increase in the water content in terms of diameter and content of GDP (Table IV). Fig. 5b illustrates the shrinkage of bricks obtained after firing depending on the content and the diameter of the GDP. The increase in the content and diameter of the GDP caused a proportional Figure 4: SEM micrograph of GDP (ground date pits).
increase in the shrinkage. This increase may be due to the removal of residual and chemically combined water as well as the conversion of additives into ashes which evidently decrease the volume of fired clay brick [31]. The combustion of GDP in the firing process increases the firing temperature in the clay brick allowing reduction of the diameter of the pores formed. During the manufacturing of clay brick, temperature and amount of waste are the factors affecting firing shrinkage. High temperature and higher amount of waste lead to a high increase of shrinkage [37]. Shrinkage, therefore, becomes important, but in this study, the values of shrinkage were found to be suitable. The highest value of shrinkage measured after firing (5.3%) occurred for 20% of GDP with higher diameter. The clay bricks must have a linear shrinkage, lower than 8% in order to preserve good mechanical performance [37], because higher contraction can cause tension stress and rupture, creating structural problems [24].
The optimal value of the water absorption coefficient (C, Eq. A) is considered to be below 30% [36]. The water absorption coefficient is shown in Table V. The values showed that an increase in the addition of GDP increased the water absorption coefficient, and an increase in the diameter of the GDP showed a slight increase in this property. The reason is the size of the open pore formed during firing. All the values of water absorption coefficient were below 30% except for 20% added GDP, whose values were at the limit. The water
absorption coefficient in [25] with 10% of the ground olive stones is clearly less than the water absorption coefficient of fired clay bricks with 10% of GDP. This difference was related to the volume of the open pores and also the shape of the pores generated during the combustion of the GDP in clay brick. These GDP pores were interconnected with the pores of clay dehydroxylation and decarbonation, which were opened in ambient conditions. Water absorption is an important factor influencing properties of clay bricks, such as the bond between them and mortar, the resistance of clay bricks to freezing and thawing, and their chemical stability. The internal structure of bricks must be dense enough to stop the intrusion of water [31]. The water absorption for reference clay brick (0 wt% GDP addition) was 16.81%. The water absorption increased with increasing content and diameter of GDP (Table VI). This increase may be due to the changes in pore structure and formation of cracks [38]. The GDP in the sample was burned out during the process of firing, leaving abundant open pores in the clay bricks,which caused the water absorption increase. It was noted that the GDP content less than 5% and diameter less than 0.20 mm did not exceed the acceptable limit (18%) of water absorption. This result showed that this fired clay brick met the recommended value of 18% according to the Brick Industry Association (USA) [39] and Turkish Standard Institution [40].
The apparent density of the samples reduced with
Figure 5: Shrinkage as a function of diameter and content of GDP of unfired (a) and fired (b) samples. [Figura 5: Retração em função do diâmetro e fração de CTM de amostras antes (a) e depois (b) da queima.]
3.6
3.2 3.4
3 3.5
3.1 3.3
2.9
2.8
5.3
4.8
4.3
3.8
0% 5% 10% 15% 20% 0% 5% 10% 15% 20%
Addition of GDP (wt%) Addition of GDP (wt%)
Shrinkage (%) Shrinkage (%)
a) b)
Table V - Water absorption coefficient - C (%) as a function of diameter and content of GDP of fired samples, according to NA 1957 standard.
[Tabela V - Coeficiente de absorção de água - C (%) em função do diâmetro e fração de CTM de amostras após queima, de acordo com norma NA 1957.]
GDP 0-0.20 mm 0.20-0.25 mm 0.25-0.50 mm 0.50-1.0 mm
5% 16.25±0.21 18.22±0.21 19.48±0.19 20.98±0.20
10% 20.45±0.19 21.21±0.24 22.23±0.21 23.65±0.21
15% 25.98±0.20 25.79±0.24 26.50± 0.21 27.10±0.20
20% 27.98±0.22 28.97±0.19 29.89±0.20 30.39±0.19
the increase in the percentage of GDP and in its diameter (Table VII). The principal reason was the combustion of this GDP and formation of the pores in the structure of fired clay brick. It can be seen in Fig. 2 that the GDP was completely consumed at around 650 °C. This explains its disappearance, leaving pores which made the samples lighter. It was apparent that the density of the sample with coarser GDP was lower due to less compaction than the finer material, at the same fraction of GDP, which explains the effect of the size of GDP on the apparent density. Therefore, the apparent density of the specimens having finer GDP was found to be higher. The formation of pores during firing was also associated with the increase in the water content of the mixture. When the mixture absorbs more water, the fired clay brick shows a larger pore size, resulting in lower density [37]. The apparent porosity refers to the proportion of open pores of a porous solid. The addition of GDP had a significant effect on the microstructure of clay bricks. The evaluation of clay bricks showed that the apparent porosity depended on the size and content of GDP (Table VIII). GDP was consumed easily during firing and caused a multitude of pores. Due to the organic nature of the GDP, pore-forming ability in the body of the clay was investigated. However, the diameter of these pores formed during the combustion of the GDP was considerably reduced. The SEM images showed
that the pores formed were open but non-spherical and confirmed their reduction (Fig. 6). Russ et al. [3] revealed that the increase in apparent porosity is probably due to the significant cracks formed in the samples when the diameter of additive is high.
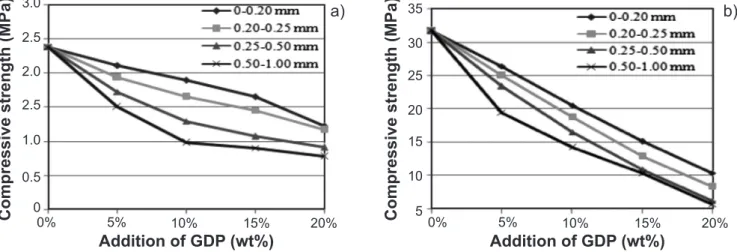
Knowledge of mechanical resistance is very useful. In this study, the compressive strength of unfired clay bricks decreased proportionally with the percentage and the diameter of the GDP (Fig. 7a). Fibrous cellulose material contained in the GDP (16.20%) acted as a structural binder in the brick raw state. Arezki et al. [25] reported that cellulose matter in the ground olive stones (33.42%) acts as a structural binder in crude brick and increases its compressive strength. From experiments on unfired masonry clay bricks mixed with palm fronds and date pits, Alami [29] reported that the date pits considerably improve the mechanical properties of clay bricks in the raw state, making them 85% more resistant. Santos et al. [41] indicated that the purpose of the reinforcement of fibers was to improve the mechanical properties. The compressive strength of the samples after firing decreased with the increase in the percentage of the GDP (Fig. 7b). This reduction in the compressive strength was probably due to the formation of unclosed pores and non-spherical forms (Fig. 6). From Fig. 7b, it can also be seen that mixing the clay with higher
GDP 0-0.20 mm 0.20-0.25 mm 0.25-0.50 mm 0.50-1.0 mm
5% 17.86±0.22 18.68±0.22 20.02±0.21 23.87±0.22
10% 22.20±0.20 24.05±0.21 24.84±0.21 26.59±0.21
15% 24.93±0.21 26.27±0.21 27.11±0.22 28.55±0.22
20% 26.97±0.23 28.80±0.23 30.55±0.21 31.38±0.20
Note: value for the clay without GDP = 16.81±0.21%.
Table VI - Water absorption (%) as a function of diameter and content of GDP of fired samples.
[Tabela VI - Absorção de água (%) em função do diâmetro e fração de CTM de amostras após queima.]
GDP 0-0.20 mm 0.20-0.25 mm 0.25-0.50 mm 0.50-1.0 mm
5% 1.68±0.03 1.66±0.04 1.58±0.03 1.46±0.04
10% 1.43±0.04 1.39±0.03 1.37±0.03 1.33±0.03
15% 1.32±0.03 1.30±0.03 1.28±0.03 1.25±0.03
20% 1.27±0.04 1.24±0.03 1.23±0.03 1.20±0.03
Table VII - Apparent density (g/cm3) as a function of diameter and content of GDP of fired samples.
[Tabela VII - Densidade aparente (g/cm3) em função do diâmetro e fração de CTM de amostras após queima.]
Note: value for the clay without GDP = 1.70±0.03 g/cm3.
GDP 0-0.20 mm 0.20-0.25 mm 0.25-0.50 mm 0.50-1.0 mm
5% 30.00±0.22 31.00±0.22 31.63±0.25 34.85±0.24
10% 31.74±0.23 33.33±0.25 34.03±0.26 35.36±0.21
15% 32.90±0.28 34.15±0.26 34.70±0.26 35.68±0.22
20% 34.25± 0.22 35.59±0.22 37.57±0.24 37.65±0.25
Table VIII - Apparent porosity (%) as a function of diameter and content of GDP of fired samples.
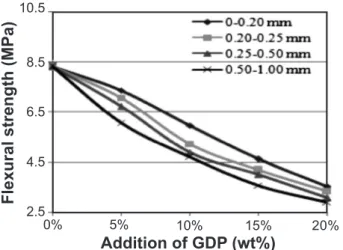
diameter of GDP a significant decrease in compressive strength was obtained. The decrease was due to the higher size of the pores created during firing. Higher porosity and characteristics of the pores have significant consequences for the mechanical resistance of the product [21]. Citroni et al. [42] reported that the compressive strength of fired and porous clay bricks depends on the type of porosity created (e.g. closed porosity), or more probably, the pore shape (e.g. spherical). Some values found were still higher than those required by the Algerian standards which establish a compressive strength of fired clay brick between 10 and 40 MPa (NA 5023) [43]. The samples presented in Fig. 7b had values all above this recommended limit, except the fired clay brick samples with content greater than 15% and GDP diameter above 0.2 mm which had compressive strengths lower than 10 MPa. On the other hand, according to the British Standard, the compressive strength of the fired clay brick should be greater than 5 MPa [44]. Generally, in clay-based ceramic systems, compressive strength decreases with an increase in porosity. The flexural strength is a property that strongly depends on the porosity and microstructural defects of the specimen [45]. High tensile (flexural) strength indicates good quality bricks and reduced crack formation [46]. Flexural strength values decreased from 7.4 to 2.9 MPa
when 5 to 20% GDP was incorporated in the raw materials (Fig. 8). As a function of the increase in the diameter of the GDP, the flexural strength was slightly reduced, which was related to the crack formation. Gafur and Haque [47] reported that the finer sawdust resulted in fine pores having smaller crack lengths than those created by the coarser sawdust particles.
Fig. 9 shows the thermal conductivity of the clay brick samples. The results demonstrated that the thermal conductivity considerably decreased with the increase in the percentage and diameter of the GDP. The additive left voids and pores in the structure upon burning during firing. Ahmada et al. [31] reported that the presence of pores decreases the thermal conduction pathways; therefore, the higher the proportion of air inside a brick body the higher is the thermal insulation character of the material since air is a good insulator in comparison to the solids. The thermal conductivity of clay bricks without any addition (control sample) was 0.578 W/m.K, which decreased by 6% with the addition of 20% GDP with diameter of 0.50-1.00 mm. The measurements also showed that GDP was not a relatively effective additive in improving the insulation behavior of the clay brick. No distinguishable effect of the sawdust content of the specimens on the thermal conductivity of the fired clay
Figure 6: SEM micrographs of fired clay bricks with different diameter of GDP: a) 0-0.20 mm; b) 0.20-0.25 mm; c) 0.25-0.50 mm; and d) 0.50-1.0 mm.
[Figura 6: Micrografias de MEV de tijolos após queima com diferentes diâmetros de CTM: a) 0-0.20 mm; b) 0.20-0.25 mm; c) 0.25-0.50 mm; e d) 0.50-1.0 mm.]
a) b) c) d)
Figure 7: Compressive strength as a function of diameter and content of GDP of unfired (a) and fired (b) samples.
[Figura 7: Resistência à compressão em função do diâmetro e fração de CTM de amostras antes (a) e depois (b) da queima.]
35
25
15
5 30
20
10 2.0
1.0
0 2.5 3.0
2.5
0.5
0% 5% 10% 15% 20% 0% 5% 10% 15% 20%
Addition of GDP (wt%) Addition of GDP (wt%)
Compressive strength (MPa) Compressive strength (MPa)
brick was observed [47]. The porous structure of clay brick with the addition of GDP comprised smaller pores less than 1.00 mm generated during firing. The thermal conduction of a ceramic material depends on the thermally conductive pathways that are affected by the microstructure, the particle size distribution and the amount of space or voids created during the firing of a body [48].
The use of mercury intrusion porosimetry in assessing the effect of GDP on the diameter of the formed pore during the firing process is shown in Fig. 10. The sizes of the GDP particles incorporated in the clay bricks were between 0.5 and 1 mm. Most of the pores in clay bricks studied with different contents of GDP were thus found between 0.30 and 0.80 mm. The pore size distribution showed that the diameter of the formed pore was reduced and confirmed the SEM results. The pores ranging between 0.06 and 0.70 μm were the result of dehydroxylation and carbonate decomposition present in the clay during the drying and firing process.
CONCLUSIONS
The following conclusions can be drawn from this experimental study, relating to the use of the ground date pits (GDP) as an additive in the manufacture of bricks for construction. The water content necessary for the plasticity of the clay-GDP mixture increased depending on the content and the diameter of the GDP because of the presence of cellulose and the high porosity of the GDP, which have an absorbent capacity. The higher water content necessary for plasticity increased the linear shrinkage of bricks before and after firing. The values obtained remained below 8%. The water absorption of the fired clay bricks increased depending on the content and diameter of the GDP. The open pores formed during the consumption of the GDP were connected with the ambient conditions. The low cellulose content in the GDP did not contribute to the increase of the compressive strength of the bricks after drying. Although the addition of GDP reduced the mechanical properties of bricks compared to those of the control sample, the whole series of samples tested showed compressive strength values above the minimum requirements of the existing regulations, except for that produced with a content of 20% and a GDP diameter greater than 0.2 mm. The flexural strength was slightly reduced, which was related to the small crack formation. Thermal conductivity depended also on the size and content of GDP. The empty pores containing the air insulated thermal flow, causing a decrease in thermal conductivity of the samples as the amount of GDP and its diameter were increased. On the other hand, the reduction in the diameter of these pores formed during combustion led to a decrease in the air in the pores, which is a good thermal insulator. The formation of the open pores and the non-spherical shape generated by the combustion of the GDP had a positive influence on the lightness of fired clay brick. This experimental study could, therefore, be a Figure 8: Flexural strength as a function of diameter and content of
GDP of fired samples.
[Figura 8: Resistência à flexão em função do diâmetro e fração de CTM de amostras após queima.]
10.5
8.5
6.5
4.5
2.5
0% 5% 10% 15% 20%
Addition of GDP (wt%)
Flexural strength (MPa)
Figure 9: Thermal conductivity as a function of diameter and
content of GDP of fired samples.
[Figura 9: Condutividade térmica em função do diâmetro e fração de CTM de amostras após queima.]
0.58
0.57
0.56
0.55
0.54
0.53
0.52
0.51
0% 5% 10% 15% 20%
Addition of GDP (wt%)
Thermal conductivity (W/m.K)
Figure 10: Pore size distribution curves of clay containing 5 to 20 wt% of ground date pits (GDP) with diameter of 0.5-1 mm.
[Figura 10: Curvas de distribuição de tamanho de poros de argila contendo 5 a 20% em massa de caroços de tâmara moídos (CTM) com diâmetro de 0,5-1 mm.]
1 0.9
0.5 0.7
0.3
0.1 0.8
0.4 0.6
0.2
0
0.01 0.1 1 10 100 1000 10000
small step towards safeguarding the environment and the economy in future.
REFERENCES
[1] V. Karayannis, K. Ntampegliotis, S. Lamprakopoulos, D. Kasiteropoulou, G. Papapolymerou, X. Spiliotis, J. Rom. Mater. 46, 4 (2016) 523.
[2] I. Demir, M.S. Baspinar, M. Orhan, Build. Environ. 40, 11 (2005) 1533.
[3] W. Russ, H. Mortel, R.M. Pittroff, Construct. Build. Mater. 19 (2005) 117.
[4] P. Milak, M.T. Souza, C.P. Bom, P. Mantas, F. Raupp-Pereira, A.P. Novaes de Oliveira, Cerâmica 63, 368 (2017) 490.
[5] S. Vichaphund, W. Intiya, A. Kongkaew, S. Loykulnant, P. Thavorniti, Environ. Technol. 33, 22 (2012) 2507. [6] P. Turgut, B. Yesilata, Energ. Buildings 40 (2008) 679. [7] L.C.S. Herek, A.T. Silva Junior, C.C. Pavezzi, R. Bergamasco, C.R.G. Tavares, Cerâmica 55, 335 (2009) 326. [8] M. Sutcu, S. Akkurt, Ceram. Int. 35 (2009) 2625. [9] I. Demir, Build. Environ. 41, 9 (2006) 1274. [10] I. Demir, Waste Manage. 28, 3 (2008) 622.
[11] L. Barbieri, F. Andreola, I. Lancellotti, R. Taurino, Waste Manage. 33, 11 (2013) 2307.
[12] N.A. Sarani, A. Abdul Kadir, Adv. Mater. Res. 690-693
(2015) 919.
[13] N.A. Sarani, A. Abdul Kadir, Appl. Mech. Mater. 465-466 (2014) 872.
[14] M.L. Martinez-Cartas, D. Eliche-Quesada, N. Cruz-Pérez, F.A. Corpas-Iglesias, Mater. Construcc. 62, 306 (2012) 199.
[15] G. Viruthagiri, P.S. Sathiya, N. Shanmugam, Indian J. Appl. Res. 4, 8 (2011) 1.
[16] V. Karayannis, X. Spiliotis, A. Domopoulou, K. Ntampegliotis, G. Papapolymerou, J. Rom. Mater. 45, 4 (2015) 358.
[17] M.S. El-Mahllawy, Construct. Build. Mater. 22 (2008) 1887.
[18] G.C. Xavier, F. Saboya, P.C. Maia, J. Alexandre, Mater. Construcc. 62, 306 (2012) 213.
[19] E. Quagliarini, S. Lenci, J. Cult. Herit. 11, 3 (2010) 309. [20] B.E.E. Hegazy, H.A. Fouad, A.M. Hassanain, Adv. Environ. Res. 1, 1 (2012) 83.
[21] M.D. La Rubia-García, A. Yebra-Rodríguez, D. Eliche-Quesada, F.A. Corpas-Iglesias, A. López-Galindo, Construct. Build. Mater. 36 (2012) 495.
[22] J.A. De la Casa, I. Romero, J. Jiménez, E. Castro, Ceram. Int. 38, 6 (2012) 5027.
[23] D. Eliche-Quesada, F.J. Iglesia-Godino, L. Pérez-Villarejo, F.A. Corpas-Iglesias, Construct. Build. Mater. 10, 68 (2014) 659.
[24] H. Mekki, M. Anderson, M. Benzina E. Ammar, J. Hazard. Mater. 158 (2008) 308.
[25] S. Arezki, N. Chelouah, A. Tahakourt, Mater. Construcc.
66, 322 (2016) e082.
[26] S.A. Kolawole, D. Abdullahi, B.M. Dauda, U.S. Ishiaku, Int. J. Sci. Res. 4, 10 (2015) 1412.
[27] J.S. Hamada, I.B. Hashim, F.A. Sharif, Food Chem. 76, 2 (2002) 135.
[28] M. Almograbi, in: WIT Press High Perform. Struct. Mater. V, Spain (2010) 112.
[29] A.H. Alami, J. Renew. Sustain. Ener. 5, 2 (2013) 1. [30] Y. Maniatis, M.S. Tite, J. Archaeol. Sci. 8, 1 (1981) 59. [31] S. Ahmada, Y. Iqbal, R. Muhammad, Bol. Soc. Esp. Ceram. V. 56 (2017) 131.
[32] K.L. Fung, X.S. Xing, R.K.Y. Li, S.C. Tjong, YW. Mai, Compos. Sci. Technol. 63, 9 (2003) 1255.
[33] H. Yang, R. Yan, H. Chen, D.H. Dong, H. Lee, C. Zheng, Fuel 86 (2007) 1781.
[34] French Norms, NF P 94-051, “Determination of the Atterberg limits-liquid limit-plastic limit” (1994).
[35] ASTM C373-88, “Standard test method for water absorption, bulk density, apparent porosity, and apparent specific gravity of fired white ware products”, vol. 15-02, Glass and Ceramic (1988).
[36] Algerian Norms, NA 1957, “Firing clay bricks-determination of water absorption coefficient” (1995). [37] C.H. Weng, D.F. Lin, P.C. Chiang, Adv. Environ. Res.
7 (2003) 679.
[38] A.G. Liew, A. Idris, C.H.K. Wong, A.A. Samad, M.J.M.M. Noor, A.M. Baki, Waste Manage. Res. 22 (2004) 226.
[39] Brick Ind. Ass., “Manufacturing, classification and selection of brick manufacturing-part I”, USA (1986). [40] Turkish Stand. Inst., TS 704, “Clay bricks-wall tile” (1983).
[41] S.F. Santos, G.H.D. Tonoli, J.E.B. Mejia, J. Fiorelli, H. Savastano Jr, Mater. Construcc. 65, 317 (2015) e041. [42] J. Citroni. M. Rodriguez. M. Carrasco, M. Avendaño. J.D. Sota, M.I. Franzoy, E. Baldó, in: Recicl. Resid. Construcc. Demolic. Resid. Proces., PROCQMA, Mendoza (2006).
[43] Algerian Norms, NA 5023, “Firing clay bricks-determination of compressive strength of bricks” (1995). [44] British Standard, BS 3921, “Specification for clay bricks” (1985).
[45] C.M.F. Vieira, S.N. Monteiro, Constr. Build. Mater. 21
(2007) 1754.
[46] A. Abdul Kadir, A. Abbas Mohajerani, F. Roddick, J. Buckeridge, Int. J. Civil Environ. Struct. Construc. Archit. Eng. 3, 5 (2009) 242.
[47] M. Gafur, M. Nasrul Haque, Trans. Indian Ceram. Soc.
52, 5 (1993) 163.
[48] H. Binici, O. Aksogan, M.N. Bodur, E. Akca, S. Kapur, Constr. Build. Mater. 21, 4 (2007) 901.