Environmental factors can influence dengue reported cases
MARCO ANTONIO F. CARNEIRO1, BEATRIZDA C. A. ALVES1*, FLÁVIADE SOUSA GEHRKE1, JOSÉ NUNO DOMINGUES2,NELSON SÁ2, SUSANA PAIXÃO2, JOÃO FIGUEIREDO3, ANA FERREIRA2, CLEONICE ALMEIDA4, AMAURY MACHI4, ERIANE SAVÓIA4,
VÂNIA NASCIMENTO1, FERNANDO FONSECA1,5
1Faculdade de Medicina do ABC (FMABC), Santo André, SP, Brazil 2Environmental Health – IPC, EsTesC, Coimbra Health School, Coimbra, Portugal
3Departamento das Ciências Complementares – IPC, EsTesC, Coimbra Health School, Coimbra, Portugal 4Gestão de Saúde Ambiental, FMABC, Santo André, SP, Brazil
5Biological Science Department, Universidade Federal de São Paulo (Unifesp), Diadema, SP, Brazil
S
UMMARYStudy conducted at Faculdade de Medicina do ABC (FMABC), Santo André, SP, Brazil
Article received: 2/27/2017
Accepted for publication: 3/1/2017
*Correspondence:
Address: Av. Príncipe de Gales, 821 Santo André, SP – Brazil Postal code: 09060-650 bcaalves@uol.com.br
http://dx.doi.org/10.1590/1806-9282.63.11.957
Introduction: Global climate changes directly affect the natural environment and contribute to an increase in the transmission of diseases by vectors. Among these diseases, dengue is at the top of the list. The aim of our study was to understand the consequences of temporal variability of air temperature in the occurrence of dengue in an area comprising seven municipalities of the Greater São Paulo. Method: Characterization of a temporal trend of the disease in the region between 2010 and 2013 was performed through analysis of the notified number of dengue cases over this period. Our analysis was complemented with meteorological (temperature) and pollutant concentration data (PM10).
Results: We observed that the months of January, February, March, April and May (from 2010 to 2013) were the ones with the highest number of notified cases. We also found that there is a statistical association of moisture and PM10 with the reported cases of dengue.
Conclusion: Although the temperature does not statistically display an association with recorded cases of dengue, we were able to verify that temperature peaks coincide with dengue outbreak peaks. Future studies on environmental pollution and its influence on the development of Aedes aegypti mosquito during all stages of its life cycle, and the definition of strategies for better monitoring, including campaigns and surveillance, would be compelling.
Keywords: dengue, mosquito vectors, climate, climate change, environmental pollution.
I
NTRODUCTIONSevere climate alterations, a major concern worldwide, have been occurring over the past few centuries. Such changes derive from a global warming effect that leads to ecological imbalance.1 The World Health Organization (WHO) sees
health problems related to climate changes as one of the greatest issues of the 21st century. These alterations
di-rectly interfere with the natural environment, and upon relating them with climate and tropical diseases, it can be noted that changes in temperature alter the ecosystem balance, contributing to an increase in the transmission of diseases by vectors, including dengue at the top of the list.1,2
Dengue is an infectious disease caused by an RNA virus. Four virus serotypes have been identified so far: DEN-1, DEN-2, DEN-3 and DEN-4. The disease is characterized
by variable febrile periods, clinically classified as dengue fever (DF) or classic dengue fever. Acute manifestations of the disease, classified as dengue hemorrhagic fever (DHF) and dengue shock syndrome (DSS) may lead the patient to death.3
Dengue transmission peaks may be related to an in-crease in the survival rate of the adult vector under favor-able temperature and humidity conditions in the rainy season. This survival rate enables the infected female the possibility to complete the virus replication cycle, thus becoming an infection vector.5
Climate variation among the municipalities, associ-ated with a temporal dimension that allows for the incor-poration of isolated phenomena of climate change patterns, are essential elements for the conduction of this study.6
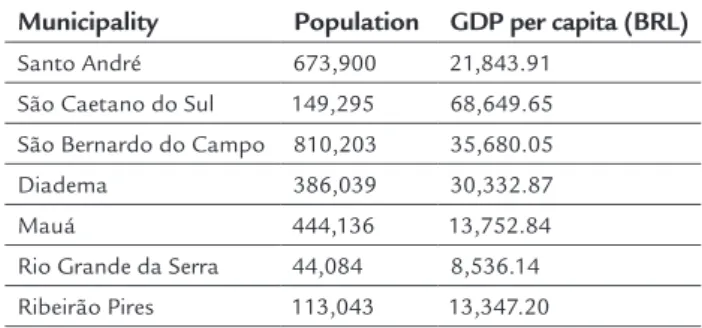
The Greater ABC area comprises seven municipalities, namely Santo André, São Caetano do Sul, São Bernardo do Campo, Diadema, Mauá, Ribeirão Pires and Rio Grande da Serra (Table 1). Located in São Paulo’s southeast area, it concentrates major industrial complexes and highly urbanized areas, but also plenty of green spaces and nature reserves, intended for environmental preservation, with water reservoirs that supply the whole metropolitan area.
TABLE 1 Approximate population and GDP per
capita (BRL)*.
Municipality Population GDP per capita (BRL)
Santo André 673,900 21,843.91 São Caetano do Sul 149,295 68,649.65
São Bernardo do Campo 810,203 35,680.05 Diadema 386,039 30,332.87 Mauá 444,136 13,752.84
Rio Grande da Serra 44,084 8,536.14 Ribeirão Pires 113,043 13,347.20
*Brazilian Census Bureau (IBGE), 2010. GDP: gross domestic product.
Due to the variety of manufacturing industries, these industrialized municipalities attract a great number of people who seek better life conditions. São Caetano do Sul has the highest gross domestic product (GDP) per capita, and General Motors, located in this municipality, directly affects the population’s quality of life. Neverthe-less, according to a study on the environmental impact caused by the industrial conglomerate, which generates particulate matters (PM10) and may affect climatic con-ditions, is important. Moreover, our study seeks to relate these impacts to the spread and dissemination of the dengue mosquito.
São Paulo is the industrial and financial center of Brazil, and the ABC area is where most manufacturing plants are located. Therefore, it is important to conduct studies on climate change as well as air pollution rates with the resulting impact on society in general, and more specifically on public health. Investigations such as these
may serve as a database for better planning and preven-tion against vector-borne diseases.
In sum, our study aims to establish a correlation be-tween dengue incidence and environmental-climatic con-ditions through the analysis of the number of notified dengue cases between the years 2010 and 2013 in the Greater ABC area, in São Paulo, and the following me-teorological data: humidity, temperature and particulate matters less than 10 microns in diameter (PM10).
M
ETHODA cross-sectional observational study with an ecological planning model was carried out. Data were collected, and the following variables were used for epidemiological and entomological investigation: space (regions), time (year, month and seasons), meteorology (temperature-humid-ity index) and the chronological distribution of the disease. The study covered the period between January 2010 and December 2013 in the Greater ABC area in São Pau-lo. Data were collected from the National Meteorological Institute, the Environmental Technology and Sanitation Agency (Cetesb, in the Portuguese acronym),7 the
Epide-miological Surveillance Service – Dengue Prevention De-partment in Santo André and the Epidemiological Sur-veillance Center (CVE, in the Portuguese acronym).8
The data were analyzed in order to verify their relation during the periods of incidence at a certain period of time that allows for the investigation of the resulting phenom-ena of the interactions with the environment. Pearson cor-relation was used to analyze the association between humid-ity, temperature and PM10 regarding the incidence of cases of the disease per year. Statistical significance was reached at p<0.05. IBM SPSS Statistics 19 software was used.
R
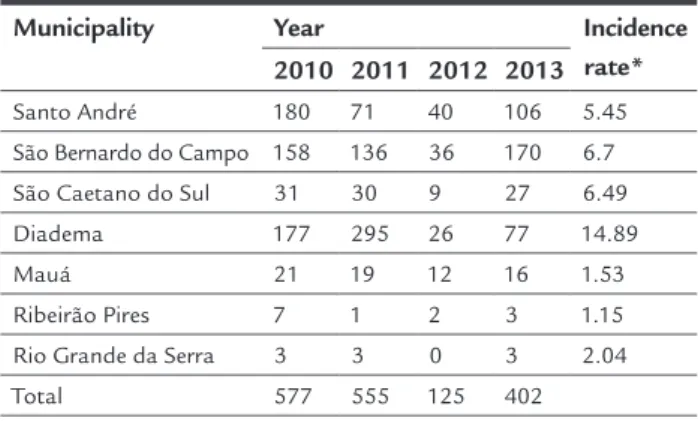
ESULTSAccording to the numbers obtained from Cetesb and the CVE, the year of highest incidence of dengue was 2010, with 577 cases in total, which corresponds to an incidence of 2.22 cases per 10,000 inhabitants (Table 2). In 2011, this number slightly decreased to 555 cases. In 2012, how-ever, a total of 125 cases were notified (0.48 cases/10,000 population), which represents a sharp drop in relation to the previous year (22.5%). Therefore, it is important to point out that the number of cases reported in 2012 was atypical compared with the previous years, and even 2013, when the number of notified cases rose to 402.
rate per municipality was registered in Diadema, with 14.89 cases per 10,000 inhabitants.
TABLE 2 Number of dengue cases in the Greater ABC area.
Municipality Year Incidence
rate* 2010 2011 2012 2013
Santo André 180 71 40 106 5.45 São Bernardo do Campo 158 136 36 170 6.7 São Caetano do Sul 31 30 9 27 6.49
Diadema 177 295 26 77 14.89
Mauá 21 19 12 16 1.53
Ribeirão Pires 7 1 2 3 1.15
Rio Grande da Serra 3 3 0 3 2.04
Total 577 555 125 402
Source: CVE (Epidemiological Surveillance Center) – São Paulo.
*Incidence rate per 10,000 inhabitants.
According to the data supplied by the CVE, the months of January, February, March, April and May (from 2010 to 2013) were the ones with the highest number of noti-fied cases. As a result, an analysis of climatic and environ-mental factors during those months was carried out so that a possible relation between these variables and a higher proliferation and notification of dengue cases could be established.
Figure 1 presents an extremely close relation between temperature values and the notified dengue cases. It can be observed that temperature peaks coincided with epi-demic peaks between the months of January and May. Nevertheless, while this relation is quite clear, there was no statistically significant association between them.
There was, however, a statistically significant associa-tion of humidity and PM10 with dengue cases (p=0.003 and p=0.001, respectively) (Table 3). As for humidity, this variable had a positive correlation (0.163), i.e., the great-er the humidity, the highgreat-er the numbgreat-er of dengue cases. In other words, whenever humidity rates reached their highest values, there was an increase in number of regis-tered cases in the area. Interestingly, PM10 had a negative Pearson correlation (-0,213), showing that lower PM10 values coincided with a higher number of dengue cases. Air pollution could therefore be the reason for reported
dengue cases.
TABLE 3 Relation of temperature, humidity and PM10
with dengue cases.
Temperature Humidity PM10
Dengue cases
Pearson correlation 0.093 0.163 -0.213 p-value 0.088 0.003 0.001
N 336 336 240
D
ISCUSSIONIn scientific terms, there is a relation between temperature and humidity, so that relative humidity can be defined as the ratio of the amount of water vapor in the air at a specific temperature to the maximum amount that the air could hold at that temperature. At higher temperatures the air may contain more water vapor than the same vol-ume of air at lower temperatures.9
Our findings show that the months presenting tem-perature and humidity peaks, namely January, February,
FIGURE 1 Mean temperatures and number of dengue notifications in the Greater ABC area between 2010 and 2013.
Period
JAN 2010 FEB 2010 MAR 2010 APR 2010 MA JAN 2011 FEB 2011 MAR 2011 APR 2011 JAN 2012 FEB 2012 MAR 2012 APR 2012 JAN 2013 FEB 2013 MAR 2013 APR 2013
Y 2010
MA
Y 2011
MA
Y 2012
MA
Y 2013
JUN 2010 JUL 2010 AUG 2010 JUN 2011 JUL 2011 A JUN 2012 JUL 2012 JUN 2013 JUL 2013 UG 2011 AUG 2012 AUG 2013 SEP 2010 OCT 2010 NO SEP 2011 OCT 2011 SEP 2012 OCT 2012 SEP 2013 OCT 2013
V 2010
NO
V 2011
NO
V 2012
NO
V 2013
DEC 2010 DEC 2011 DEC 2012 DEC 2013
Mean t
emper
atur
es
Mean number of dengue notifications
30
25
20
15
10
5
0 25
20
1.6 1.6
1.6
1.6 1.6 1.6 1.6 1.6 1.6
1.6 1.6
1.6 1.6 1.6 1.6 1.6 1.6
1.6 1.6 1.6
1.6
1.6 1.6 1.6 1.6
1.6
1.6 1.6 1.6 1.6 1.6 1.6
1.6 1.6 1.6
1.6
1.6
1.6 1.6
1.6 1.6
March, April and May, also had more notifications of dengue cases.
Another relevant aspect is a significant decline in the number of cases in 2012 compared with the previous year, which, according to Santo André’s Health Depart-ment, may have occurred as a result of the many aware-ness campaigns targeting the general population after the 2011 outbreak.
The year 2013 emerges as the year with the highest num-ber of notified cases. One of the possible explanations is that the months in that year were warmer and wetter all over the state of São Paulo according to meteorological data.
This increasingly common scenario, where winter is no longer a cold and dry season, is a climate change result-ing from global warmresult-ing.10
The most industrialized municipalities are the ones with the highest rates of notified dengue cases, which can be explained by the possibility of many cases being im-ported. As a consequence of industrialization, most work-ers choose to live in other municipalities and commute daily to/from their jobs. Despite the difficulty in identify-ing whether the disease is autochthonous or imported, one must consider that these individuals may be infected in the municipality where they live but seek assistance in the municipality where they work, if medical care is more con-venient or easily accessed in the latter. Therefore, the lower number of cases notified in municipalities such as Ribeirão Pires and Rio Grande da Serra may be justified.
Regardless of other factors, temperature variations and rainfall intensity affect the reproductive cycle and survival of the vector, which cause changes in its distribution and density, since mosquitoes need humidity and temperatures ranging between 15°C and 35°C to survive and reproduce. These climate (abiotic) factors have shown an association with the incidence and prevalence of dengue.2,3
Many studies have revealed the important role of rainfall in the renewal and oscillations of puddles, condi-tions that favor egg hatching and the incubation period of the mosquito.
As for temperature, many authors affirm that it in-terferes with dengue virus incubation period, which drops from 10 to 7 days whenever temperature rises from 27°C to 37°C.2 It is thus clear that temperature and rainfall
levels in the months of January, February and March throughout the years were favorable for the development of the virus and that these factors may have contributed to a higher incidence of dengue cases. As the mosquito’s life span is around 45 days, the generation born in the beginning of January can infect hosts until February 15, whereas the generation born in the second half of January
is able to infect people until March 15. Accordingly, den-gue cases appear after weeks of peak temperature and rainfall, a time during which the mosquito can develop and contaminate the population.11
Another fact to be considered is the time it takes for each individual to show symptoms of the disease, and, as a result, the time that elapses until these individuals search for assistance at a medical care unit. The greatest num-ber of dengue cases is expected to be reported in the months of February, March, April and May. However, there are many difficulties to establish a “key” seasonal pattern of disease incidence and meteorological variables. Concerning particulate matters, a decrease in the concen-tration of PM10 is observed from January to May, a critical period when cases are registered most often in the region. Although not confirmed by any study to date, the presence
of air pollutants apparently interferes with the life cycle of the Aedesaegypti mosquito.
The relation between health and environment can be clearly seen through the analysis of epidemiological char-acteristics in areas close to contamination sources and through the identification of adverse environmental fac-tors that are harmful to health.12
Investigations on the special conditions that trigger the occurrence of dengue may contribute to the under-standing of the role played by social groups in the complex dynamic chain of disease transmission, considering their own limits and possibilities. They can also shed light on more suitable prevention and control strategies in the construction of new indicators by trying the use of mul-tivariate models that take into consideration the spatial distribution of the events.13
Variations in climate patterns may influence some disease cycles, favoring and increasing the number of isolated foci of vector-transmitted diseases. Moreover, these changes stimulate the migration of these vectors, cause an increase in epidemics, reduce productivity, and generate an increase in healthcare-related costs. Although the urgency for action is quite clear, so far, little has been done to reverse this scenario. If actions are not taken, the number of dengue cases will continue to escalate and other diseases will gradually emerge as temperatures rise.2
accessing climate data for the analysis of temperature and humidity in all of the municipalities included in our analysis was very difficult.
C
ONCLUSIONWe found a statistical association of moisture and PM10 with the reported cases of dengue. There was no statisti-cal correlation between the incidence of dengue and tem-perature. The presence of air pollutants also interferes with the life cycle of the dengue mosquito, and further studies may reveal important instruments for environ-mental monitoring and the control of endemic vectors.
C
ONFLICT OF INTERESTThe authors declare no conflict of interest.
R
ESUMOFatores climáticos podem influenciar nos casos de noti-ficação de dengue
Objetivo: As alterações globais que têm ocorrido inter-ferem no ambiente natural, influenciando diretamente no crescimento da transmissão de doenças ocasionadas por vetores, das quais se destaca a dengue. O objetivo deste estudo foi compreender as consequências da varia-bilidade temporal das condições climáticas em relação à ocorrência de dengue na população da região metropo-litana de São Paulo, constituída por sete municípios. Método: A caracterização da tendência temporal da den-gue foi realizada por meio da análise dos números de casos de dengue notificados nos anos de 2010 a 2013, de dados meteorológicos (umidade e temperatura) e dados de concentração de poluentes (PM10).
Resultados: Observou-se que os meses de janeiro a abril (de 2010 a 2013) foram os que apresentaram maior nú-mero de casos notificados de dengue, com associação estatística entre a umidade e PM10 com os casos de den-gue notificados.
Conclusão: Embora a temperatura não assuma, estatis-ticamente, uma associação com os casos de dengue regis-trados, foi possível verificar que os picos de temperatura coincidem com os picos epidêmicos de dengue. Seriam interessantes futuros estudos referentes à poluição am-biental e a sua influência no desenvolvimento do mos-quito Aedes aegypti em todas as suas fases do ciclo de vida e definição de estratégias para melhor monitoração, cam-panhas e vigilância.
Palavras-chave: dengue, mosquitos, vetores, clima, mu-dança climática, poluição ambiental.
R
EFERENCES1. Silva L, Ferreira VF, Santos S, Silva I. Crescimento da dengue em razão do aquecimento global. Proceedings of 61o Congresso Brasileiro de Enfermagem; Fortaleza, CE, Brazil. 2009 [cited 2015 Sept 20]. Available from: http://www. abeneventos.com.br/anais_61cben/files/02214.pdf.
2. Pereda PC, Alves DCO, Rangel MA. Elementos climáticos e incidência de dengue: teoria e evidência para municípios brasileiros. Rio de Janeiro: Sociedade Brasileira de Econometria, 2011 [cited 2015 Oct 28]. Available from: bibliotecadigital.fgv.br/ocs/index.php/sbe/EBE11/paper/download/2938/1333. 3. FUNASA. Fundação Nacional de Saúde, Ministério da Saúde. Programa Nacional de Controle da Dengue – PNCD. Brasília: Ministério da Saúde; 2002 [cited 2015 Oct 28]. Available from: http://bvsms.saude.gov.br/bvs/ publicacoes/pncd_2002.pdf.
4. Donalísio MR, Glasser CM. Vigilância entomológica e controle de vetores de dengue. Rev Bras Epidemiol. 2002; 5(3):259-79.
5. Glasser CM, Gomes AC. Infestação do estado de São Paulo por Aedes aegypti e Aedes albopictus. Rev Saúde Pública. 2000; 34(6):570-7.
6. Ribeiro AF, Marques GRAM, Voltolini JC, Condino ML. Associação entre incidência de dengue e variáveis climáticas. Rev Saúde Pública. 2006; 40(4):671-6.
7. CETESB - Companhia Ambiental do Estado de São Paulo. Qualidade do ar no Estado de São Paulo. 2014 [cited 2016 Feb 20]. Available from: http:// sistemasinter.cetesb.sp.gov.br/Ar/php/ar_resumo_hora.php
8. Centro de Vigilância Epidemiológica “Prof. Alexandre Vranjac”– CVE [cited 2016 Feb 20]. Available from: http://www.cve.saude.sp.gov.br/.
9. Valsson S, Bharat A. Impact of air temperature on relative humidity: a study. Architecture – Time Space and People. 2011; 38-41.
10. Confalonieri UEC, Marinho DP. Mudança climática global e saúde: perspectivas para o Brasil. Rev Multiciência. 2007; 8:48-64.
11. Viana DV, Ignotti E. The ocurrence of dengue and weather changes in Brazil: a systematic review. Rev Bras Epidemiol. 2013; 16(2):240-56.
12. Rocha JRR, Mariano ZF. Aspectos climáticos e ocorrência de casos de dengue em Jataí – GO. Rev Geonorte. 2012 ;3(5):757-69.