Enzymatic variability in
Aedes aegypti
(Diptera: Culicidae) populations
from Manaus-AM, Brazil
Elmary da Costa Fraga
1, Joselita Maria Mendes dos Santos
2and Juracy de Freitas Maia
21
Universidade Estadual do Maranhão, UEMA/CESC, Caxias, MA, Brazil.
2Instituto Nacional de Pesquisas da Amazônia, CPCS, Manaus, AM, Brazil.
Abstract
Eighteen enzymatic loci were analysed in Aedes aegypti populations from four neighbourhoods in the city of Manaus. The analyses showed that the Downtown population was the most polymorphic (p = 55.6%) with higher observed and expected mean heterozygosities (Ho= 0.152 ± 0.052; He= 0.174 ± 0.052, respectively). The least variability was detected in the Coroado and Cidade Nova populations, both with polymorphism of 44.4%. The latter population presented the least observed heterozygosity (Ho= 0.109 ± 0.037). Wright’s F statistics showed that the mean value of Fiswas higher than that of Fst(Fis= 0.164 > Fst= 0.048), and from analysis of molecular variance (AMOVA) it was found that 95.12% of the variability is found within populations indicating a certain intra-population differentiation possibly of the microgeographic structure resulting from some barrier in the random coupling. Although the four populations were similar genetically (D = 0.003 to 0.016), the 4.88% differentiation was significant.
Key words:Aedes aegypti, electrophoreses, isozymes, populations genetics.
Received: July 8, 2002; accepted: February 4, 2003.
Introduction
Aedes (Stegomyia) aegyptiis a widely geographically distributed species as well as of great epidemiological im-portance on account of being the major vector involved in the transmission of the yellow fever virus and four serotypes of dengue and its hemorrhagic fever viruses throughout most of the world’s tropical and subtropical ar-eas (Chowet al., 1998).
The reintroduction of this vector insect to Brazil in 1967, which is presently infesting up to 3,592 municipali-ties nationwide (Honório and Lourenço-de-Oliveira, 2001), has consolidated dengue infection as a major public health problem. Nearly 1.8 million cases have been reported in the past few years. These cases account for about 80% of the Americas total (Schatzmayr, 2000). High population sizes of this mosquito have been recorded in the city of Manaus, highlighting the magnitude of this problem within the re-gion.
Several studies have addressed the population genet-ics of this species (Tabachnick, 1982; Walliset al., 1984; Harrington et al., 1984; Dinardo-Miranda and Contel, 1996; Faillouxet al., 1995; de Sousaet al., 2000, 2001; Ravelet al., 2002). These studies dealt with the population genetical structure as an essential requirement to the under-standing of population dynamics as well as factors that may
interact with them, such as vectorial ability, insecticide resistance and ecological adaptation.
In the present study, four populations ofA. aegypti
were analysed using enzymatic variation of 18 loci to char-acterize the genetic structure of this species in the sampled regions.
Material and Methods
The mosquitoes were collected in Compensa, Cidade Nova, Coroado and Downtown, neighbourhoods of the city of Manaus. Larvae and pupae collected in artificial breed-ing sites outdoors were kept in an insectarium until the emergence of the adults. The adults were then transferred to a cage, where the males were fed on a 10% sucrose solution and the females were fed in a hamster (Mesocricetus auratus). After the couplings, females were isolated for in-dividual oviposition and later identified by means of the Consoli and Lourenço-de-Oliveira (1994) key. Hatched larvae were kept until the electrophoretic analyses specific stages, according to Santoset al. (1981), and frozen in at -70 °C.
Eighteen enzymatic loci were analysed (EST3, EST4, EST5, EST6, LAP1, LAP2, LAP4, LAP5, LAP6, PGI, HEX1, HEX2, MDH, IDH, ME, 6-PGD, PGM and α -GPDH). Fourth instar larvae were used for most of the en-zymes with the exception ofα-GPDH, for which adults
www.sbg.org.br
Send correspondence to J.M.M.S. E-mail: jsantos@inpa.gov.br.
were used. Three individuals from each progeny were used. Electrophoretic techniques and enzyme recipes were those described in Steiner and Joslyn (1979). The gels were pre-pared as described by Santoset al. (1996).
Allelic frequencies were estimated directly from the data. Polymorphic loci ratio (P), found (Ho) and expected (He) heterozygosities and Wright’s coefficients were esti-mated in each population by using BIOSYS (Swofford and Selander, 1981) program. The dendrogram was constructed employing the UPGMA method (Nei, 1978). Values of Fst (Weir and Cockerham, 1984), and hierarchical analysis of molecular variance (AMOVA) (Michalakis and Excoffier, 1996) were calculated using the ARLEQUIN program, ver-sion 2000 (Schneideret al. 2000), in which significance
levels for the overall values were determined after 1023 permutations.
Results
Only 7 out of the 18 loci analysed presented polymor-phism in the four populations:EST4,EST5,LAP2,LAP5,
IDH,MDHandPGM. TheEST3andLAP6loci were poly-morphic in the Compensa and Downtown populations. The
EST3locus was also polymorphic in the Coroado popula-tion. ThePGIlocus was polymorphic in the Cidade Nova and Downtown populations. The Compensa and Coroado populations were monomorphic (Table 1). Chi-square val-ues for most Compensa population polymorphic loci were
Table 1- Allele frequency at each polymorphic locus and chi-square value for the determination of Hardy-Weinberg equilibrium inAedes aegypti
populations from Manaus.
Population
Locus Allele Compensa Cidade Nova Downtown Coroado
EST3(n) 90 90 90 90
100 0.994 1.000 0.917 0.922
96 0.006 0.000 0.022 0.044
93 0.000 0.000 0.061 0.033
χ2H-W 0.000 (df = 1)ns 13.786 (df = 3)* 0.591 (df = 3)ns
EST4(n) 90 90 90 90
100 0.989 0.989 0.933 0,956
98 0.011 0.011 0.067 0.044
χ2H-W 0.006 (df = 1) ns
179.006 (df = 1)* 97.672 (df = 1)* 102.309 (df = 1)*
EST5(n) 90 90 90 90
100 0.900 0.494 0.406 0.461
98 0.072 0.439 0.472 0.372
94 0.028 0.067 0.122 0.167
χ2H-W 33.649 (df = 3)* 73.682 (df = 3)* 22.067 (df = 3)* 38.613 (df = 3)*
LAP2(n) 90 90 90 90
100 0.567 0.550 0.628 0.450
98 0.433 0.450 0.372 0.550
χ2H-W 0.582 (df = 1)
ns 17.780 (df = 1)* 23.109 (df = 1)* 8.637 (df = 1)*
LAP5(n) 90 90 90 90
100 0.767 0.811 0.744 0.767
98 0.233 0.189 0.256 0.233
χ2H-W 1.680 (df = 1)
ns 0.360 (df = 1)ns 0.189 (df = 1)ns 5.086 (df = 1)**
LAP6(n) 90 90 90 90
100 0.989 1.000 0.989 1.000
98 0.011 0.000 0.011 0.000
χ2H-W 179.006 (df = 1)* 179.006 (df = 1)*
PGI(n) 90 90 90 90
105 0.000 0.206 0.033 0.000
100 1.000 0.794 0.967 1.000
not significant, indicating equilibrium according to the Hardy-Weinberg equilibrium. Exceptions were found in the lociEST5,LAP6,MDHandPGMwhich presented sig-nificant deviations. In the Cidade Nova population, four out of the eight polymorphic loci were not in equilibrium (EST5,EST4,LAP2andPGI). However, a higher number of polymorphic loci that showed significant deviations were found in the Downtown (EST3,EST4,EST5,LAP2,
LAP6,PGIandPGM), and in the Coroado (EST5,EST4,
LAP2, LAP5 andIDH) populations as well. According to the four populations genotype frequency analyses, only 45% of the polymorphic loci were in Hardy-Weinberg equilibrium.
The genetic variability estimates in the four popula-tions are shown in Table 2. The Downtown population was the most polymorphic (P = 55.6%), with the largest number of alleles per locus (1.7) and highest level of heterozygosity (Ho= 0.152). The least variability was found in the Coroado and Cidade Nova (P = 44.4%) populations with the smallest
number of alleles per locus (1.6), and the latter presented the least observed heterozygosity (Ho= 0.109).
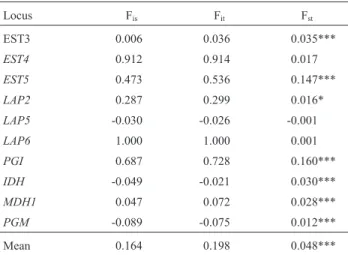
Genetic structure of the populations analysed through Wright’s F statistics showed higher Fismean value relative to Fst(0.164 > 0.048). Higher Fisvalues as compared with Fstwere found in loci LAP6, EST4andPGI with 1.000, 0.912 and 0.687 respectively, suggesting a certain intra-populational differentiation (Table 3). Population structure was also tested at different hierarchical levels using Fstby AMOVA analysis (Table 4). Most of the variation was found within populations (95%), indicating large differen-tiation within population differendifferen-tiation. There was little variation among populations (5%).
However, the genetic distance values shown in Table 5 (D = 0.003 - 0.016) indicate that these populations are very similar genetically, grouping the Cidade Nova, Down-town and Coroado populations in one single “cluster”, while the Compensa population was separated in another “cluster” (Figure 1).
Table 1(cont.)
Population
Locus Allele Compensa Cidade Nova Downtown Coroado
IDH(n) 90 90 90 90
110 0.311 0.183 0.200 0.128
100 0.689 0.817 0.800 0.872
χ2H-W 0.624 (df = 1) ns
1.913 (df = 1)ns 1.015 (df = 1)ns 6.158 (df = 1)**
MDH(n) 90 90 90 90
110 0.350 0.217 0.300 0.422
100 0.650 0.783 0.700 0.578
χ2H-W 5.573 (df = 1)** 0.008 (df = 1) ns
0.000 (df = 1)ns 0.159 (df = 1)ns
PGM(n) 90 90 90 90
115 0.183 0.167 0.211 0.183
105 0.050 0.139 0.183 0.167
100 0.767 0.694 0.606 0.650
χ2H-W 8.556 (df = 3)** 4.845 (df = 3) ns
16.160 (df = 3)* 5.893 (df = 3)ns
n - sample size.
χ2H-W - chi-square/Hardy-Weinberg equilibrium. df - degrees of freedom.
*p < 0.01; ** p < 0.05; ns - not significant.
Table 2- Estimate of measures of genetic variability inA. aegyptipopulations.
Population Mean sample size/locus Mean nº of alleles/locus % Polymorphic loci* Mean heterozygosity Observed Expected** Compensa 90.0 ± 0.0 1.6 ± 0.2 50.0 0.117 ± 0.043 0.131 ± 0.046 Cidade Nova 90.0 ± 0.0 1.6 ± 0.2 44.4 0.109 ± 0.037 0.157 ± 0.050 Downtown 90.0 ± 0.0 1.7 ± 0.2 55.6 0.152 ± 0.052 0.174 ± 0.052 Coroado 90.0 ± 0.0 1.6 ± 0.2 44.4 0.143 ± 0.049 0.164 ± 0.053 * A locus was considered polymorphic if more than one allele was detected.
Discussion
The analysis of the polymorphism found in the four populations, through the allelic frequencies, showed that most loci in Hardy-Weinberg equilibrium were in the Compensa population. In the four population group, it was verified that only 45% of loci were in equilibrium. Similar results were found in the Guariba population (SP) for this vector by Dinardo-Miranda and Contel (1996).
Con-sidering the three populations from their study, it was found that only (35%) of the loci were in equilibrium. However, divergent findings from other countries’A. aegypti popula-tions have been reported, such as observed by Tabachnick and Powell (1978), where most analysed loci did not show significant deviations for the Hardy-Weinberg equilibrium. Likewise, Harrington et al. (1984) found similar results when analysing 20 populations of this vector.
Significant deviations from the expected values of the Hardy-Weinberg equilibrium were found in some loci. These deviations are due to the occurrence of a single homozygote individual for one rare allele, such as the al-lelesLAP6*98in the Compensa,EST4*98in the Cidade Nova,LAP6*98 andPGI*105in the Downtown popula-tions. Similar findings were reported by Scarpassa et al. (1999) inAnopheles nuneztovaripopulations from Tucuruí (PA) for three nonspecific esterase loci.
One of the most important implications of Hardy-Weinberg equilibrium is that when an allele is rare, most of the individuals should be heterozygous (Hartl, 1981). For the loci with deviation from genetic equilibrium due to the heterozygotes deficiency, Crouau-Roy (1988) mentioned that usually these deficiencies are found in some enzymatic loci and/or in some populations presenting other loci whose genotype proportions are in equilibrium.
The Downtown population presented the highest polymorphism indexes. These findings are similar to those detected in populations of São Paulo State by Dinardo-Miranda and Contel (1996), who found a poly-morphic loci rate ranging from 37.5% in the Guariba to 50% in the Ribeirão Preto populations. In populations of this species collected in Kenya, Tabachnick and Powell (1976) found variation in 59% of the loci. Harringtonet al. (1984), found a polymorphic loci rate ranging from 30% to 40% inA. aegyptipopulations from Houston. Recently, de Sousaet al. (2000) detected polymorphic loci rates ranging from 27.3% to 63.6% in Argentinean populations.
Higher mean heterozygosity values detected in the Downtown population indicated that this population was
Table 3- Genetic structure analysis ofAedes aegyptipopulations from Manaus, using Wright’s F statistics.
Locus Fis Fit Fst
EST3 0.006 0.036 0.035***
EST4 0.912 0.914 0.017
EST5 0.473 0.536 0.147***
LAP2 0.287 0.299 0.016*
LAP5 -0.030 -0.026 -0.001
LAP6 1.000 1.000 0.001
PGI 0.687 0.728 0.160***
IDH -0.049 -0.021 0.030***
MDH1 0.047 0.072 0.028***
PGM -0.089 -0.075 0.012*** Mean 0.164 0.198 0.048*** Fis= coefficient of inbreeding among individuals in the subpopulations;
Fit = degree of genetic differentiation among the total populations;
Fst= degree of genetic differentiation among the subpopulations; levels of
significance for Fst> 0 are: *p < 0.005; **p < 0.01; ***p > 0.001.
Table 4- Hierarchical analysis of molecular variance of four Aedes aegyptipopulations from Manaus.
Source of variation d.f % Variation
Fst
P
Fst
Among populations 3 4.88 < 0.001 Within populations 716 95.12 < 0.001 %, percentage molecular variation explained by the hierarchical level; P, level of significance for the distribution for that hierarchical level being different from random.
Table 5- Matrix of genetic distance and similarity among the fourAedes aegyptipopulations.
Population Compensa Cidade Nova Downtown Coroado Compensa ***** 0.986 0.984 0.987 Cidade Nova 0.014 ***** 0.997 0.993 Downtown 0.016 0.003 ***** 0.997 Coroado 0.013 0.007 0.003 ***** The values below the diagonal correspond to unbiased genetic distance and those above the diagonal correspond to unbiased genetic identity (Nei, 1978).
the most variable among the four studied. These values re-semble those found by de Sousaet al.(2000) who detected expected mean heterozygosities ranging from 0.090 to 0.161 for 11 allozymic loci inA. aegyptisamples from Ar-gentina. This also resembles the analyses reported by Tabachnick et al. (1979), where the expected mean heterozygosity was of 0.141 for domestic, and of 0.163 for East African wild populations. Lower expected mean heterozygosity values for this species (He= 0.118 ± 0.009) were detected by Tabachnick (1982) in the Caribbean, and by Harringtonet al.(1984) (He= 0.097 ± 0.055) in Houston populations. Nevertheless, Dinardo-Miranda and Contel (1996) obtained expected mean heterozygosity value diver-gent findings, ranging from 0.48 to 0.53, in this mosquito’s São Paulo populations.
Higher heterozygosity estimates have been detected in this species with the use of other molecular markers. Apostolet al. (1996) detected mean heterozygosity values equal to 0.354, twice the level found with the use of isozymes in Puerto Rico populations, using RAPD-PCR. Yanet al.(1999) found mean heterozygosity values of 0.39 in this vector’s populations with the use of AFLP, and this value was similar in all populations, whereas the values were from 0.44 to 0.58 with the use of RFLP. Similar esti-mates (He = 0.350) by using RAPD-PCR in this species were reported by de Sousaet al. (2001).
On the basis of the data presented, it may be inferred that the heterozygosity values found in this study by using isoenzymes would have a very close correspondence to those found with other markers, and that theA. aegypti pop-ulations here analysed would not be less polymorphic than the others analysed around the world. Therefore, hetero-zygosity indexes found in the ManausA. aegypti popula-tions, point out that there is no “founder effect” occurrence. Since according to Neiet al.(1975), for a new population started by 2 to 10 founder individuals, heterozygosity un-dergoes an initial decrease whose recovery will come about slowly, and only following nearly 105generations will be established back to the initial population levels.
Therefore, these data suggest that the in loci with dis-tribution of their genotypic frequencies according to the ex-pected by the Hardy-Weinberg equilibrium, the couplings are random between the individuals. However, for those where significant deviations between found and expected frequencies were detected, it is possible that it is a result of a higher number of found than expected homozygotes, de-tected in the majority of loci in non-equilibrium in this study’s populations. This hypothesis is forwarded by Faillouxet al. (1995) in studies on populations of this vec-tor, as well as by Santoset al. (1999) onAnopheles darlingi
populations from the Amazonian region.
Genetic structure data from Wright’s F statistics showed disequilibrium resulting from homozygote excess and suggested a certain intrapopulational differentiation, in which Fisvalues were higher than Fstvalues. Similar results
in French PolynesianA. aegyptipopulations were reported by Faillouxet al. (1995), who detected heterozygote defi-ciency in lociEST1,EST3andPGM(Fis= 0.26; 0.20 and 0.13, respectively). de Sousaet al. (2000) found Fstmean value equal to 0.065, in this vector’s Argentinean popula-tions indicating low levels of genetic differentiation among populations from different localities. Nevertheless, Dinardo-Miranda and Contel (1996) found lower Fstvalues (0.018) in São Paulo populations. In their study the author considers that even though actual Fstvalues had been low they nevertheless were significant, and indicate a differen-tiation between populations, making it possible to assert that the allelic frequency variability origin is intra-populacional (Fis= 0.057).
According to Eanes and Koehn (1978) population ge-netic structures is a consequence from the coupling pat-terns, and the genetic flow magnitude between populations and this is expressed by the Hardy-Weinberg equilibrium deviation and by the amount of differentiation or allelic fre-quency between the populations. They further consider that the high genetic flow rates among sub-populations and the tendency for intrapopulational random coupling may lead to a genetic structure decrease. Given this information, it is possible to admit that the Fstvalues detected in this study may indicate the onset of a genetic flow reduction process as well as of the non random couplings occurrence, since the Fisvalue was relatively high. Tabachnick and Wallis (1985) and Faillouxet al. (1995), reported similar findings on this mosquito populations genetic structure to those ob-tained in Manaus, where control measures of both imma-ture and winged forms with insecticide systematic applications led to a decrease in population size within a de-termined period of time. However, a population increase occurs again whenever there is a relaxation of these mea-sures.
The genetic distance values found among the four Manaus populations were small, indicating that these popu-lations are very similar. These findings are similar to those detected in São Paulo populations by Dinardo-Miranda and Contel (1996) who found genetic distance values between 0.009 and 0.018. Tabachnicket al.(1979) and Walliset al.
(1984) working with this vector’s populations who found genetic distance values from 0.002 to 0.082 and 0.002 to 0.084. These findings confirm a low genetic differentiation level among all the populations around the world, including those in Brazil. Taking the direct relation between genetic distance and evolving time into account (Nei, 1972) it may be inferred that, for A. aegypti, the divergence between populations is fairly recent.
determine the genetic structure of theA. aegypti popula-tions that infest the city of Manaus, and thus, subsidise these vectors’ control strategies. Currently, vector control is the only available method for reducing the incidence of dengue fever. Mosquito populations can be limited by in-secticides used against larvae and/or adults. Extended use of insecticides for dengue control may enhance the resis-tance to insecticides in mosquito populations (Pasteur and Raymond, 1996). Furthermore, rebuilding from selected resistant individuals gives rise to a population genetically different from the original one. Therefore, knowledge about geographical genetic variation inA. aegypti popula-tions regarding dengue transmission would be informative. However, further molecular studies involving other Brazil-ian populations must be carried out in the attempt to pro-vide more information on the genetic structure of this vector’s populations, its variability and possibly about its vectorial ability, insecticide resistance and ecological adap-tation.
Acknowledgments
We would like to thank Mr. Jorge Antunes for helping to correct the English version of the manuscript. CAPES/PICDT and CNPq, PPI/INPA 3260 e 3110 sup-ported this research.
References
Apostol BL, Black 4thWC, Reiter P and Miller BR (1996) Popula-tion genetics with RAPD-PCR markers: the breeding struc-ture ofAedes aegyptiin Puerto Rico. Heredity 76:325-334. Chow VTK, Chan YC, Yong R, Lee KM, Lim LK, Chung YK,
Lam-Phua SG and Tan BT (1998) Monitoring of dengue vi-ruses in field-caught Aedes aegypti and Aedes albopictus
mosquitoes by a type-specific polymerase chain reaction and cycle sequencing. Am J Trop Med Hyg 58:578-586. Consoli RAGB and Lourenço-de-Oliveira R (1994). Principais
Mosquitos de Importância Sanitária no Brasil. FIOCRUZ, Rio de Janeiro, 225 p.
Crouau-Roy B (1998) Genetic structure of cave-dwelling beetles populations: significant deficienci of heterozygotes. Hered-ity 60:321-327.
de Sousa GB, Aviles G and Gardenal CN (2000) Allozymic poly-morphism inAedes aegyptipopulations from Argentina. J Am Mosq Control Assoc 16:206-209.
de Sousa GB, Blanco A and Gardenal CN (2001) Genetic relation-ships amongAedes aegypti(Diptera: Culicidae) populations from Argentina using random amplified polymorphic DNA polymerase chain reaction markers. J Med Entomol 38:371-375.
Dinardo-Miranda, LL and Contel EPB (1996) Variability in natu-ral populations ofAedes aegypti(Diptera, Culicidae) from Brazil. J Med Entomol 33:726-733.
Eanes WF and Koehn RK (1978) An analysis of genetic structure in the monarch butterfly,Danaus plexippus L. Evolution 32:784-797.
Failloux AB, Darius H and Pasteur N (1995) Genetic differentia-tion ofAedes aegyptithe vector of dengue French Polynesia. J Am Mosq Control Assoc 11:457-462.
Harrington MA, Haecker CS, Cheng ML and Ferrel RE (1984) Genetic variation in urban population of Aedes aegypti
(Diptera, Culicidae). J Med Entomol 21:706-710.
Hartl DL (1981) A Primer of Population Genetics. Sunderland, Massachusetts, Sinauer Associates, Inc. Publishers. Honório AN and Lourenço-de-Oliveira R (2001) Freqüência de
larvas e pupas de Aedes aegypti e Aedes albopictus em armadilhas, Brasil. Rev Saúde Pública 35:385-391. Michalakis Y and Excoffier L (1996) A generic estimation of
pop-ulation subdivision using distances between alleles with
spe-cial reference for microsatellite loci. Genetics
142:1061-1064.
Nei M, Maruyama T and Chakraborty R (1975) The bottleneck ef-fect and genetic variability in populations. Evolution 29:1-10.
Nei M (1972) Genetic distance between populations. Am Nat 106:283-292.
Nei M (1978). Estimation of average heterozygosity and genetic distance from a small number of individuals. Genetics 89:583-590.
Pasteur N and Raymond M (1996) Insecticide resistance genes in mosquitoes their mutations, migration, and selection in field populations. J Hered 87:444-449.
Ravel S, Hervé JP, Diarrassouba S, Kone A and Cuny G (2002) Microsatellite markers for population genetic studies in
Aedes aegypti(Diptera: Culicidae) from Côte d’ Ivoire: evi-dence for a microgeographic genetic differentiation of mos-quitoes from Bouaké. Acta Trop 82:39-49.
Santos JMM, Contel EPB and Keer WE (1981) Biologia de anofelinos amazônicos I - Ciclo biológico, postura e estádios deAnopheles darlingiRoot, 1926 (Diptera: Culicidae) da Rodovia Manaus/Boa Vista. Acta Amazonica 11:789-797. Santos JMM, Tadei WP and Contel EPB (1996) Electrophoretic
analysis of 11 enzymes in natural populations ofAnopheles (N.) darlingiRoot, 1926 (Diptera: Culicidae) in the Amazon region. Acta Amazonica 26:97-114.
Santos JMM, Lobo JA, Tadei WP and Contel EPB (1999) Intra-populational genetic differentiation in Anopheles (N.) darlingiRoot, 1926 (Diptera: Culicidae) in the Amazon Re-gion. Genet Mol Biol 22:325-331.
Scarpassa VM, Tadei WP and Suarez MF (1999) Population structure and genetic divergence inAnopheles nuneztovari
(Diptera: Culicidae) from Brazil and Colombia. Am J Trop Med Hyg 60:1010-1018.
Schatzmayr HG (2000) Dengue situation in Brazil by year 2000 Mem Inst Oswaldo Cruz 95 (Suppl. 1):179-181.
Schneider S, Roessli D and Excoffier L (2000) Arlequin ver. 2000: A Software for population genetic data analysis. Ge-netics and Biometry Laboratory, University of Geneva, Switzerland.
Steiner WWM and Joslyn DJ (1979). Electrophoretic techniques for the genetic study of mosquitoes. Mosq News 39:35-54. Swofford DL and Selander RB (1981) Biosys - 1: A fortran
pro-gram for the comprehensive analyses of electrophoretic data in population genetics and systematics. J Hered 72:281-283. Tabachnick WJ and Powell JR (1976) Allozymic variation in the
Tabachnick WJ and Powell JR (1978) Genetic structure of the East African domestic populations ofAedes aegypti. Nature 272:535-537.
Tabachnick WJ, Munstermann LE and Powell JR (1979) Genetic distinctness of sympatric forms ofAedes aegyptiin East Af-rica. Evolution 33:287-295.
Tabachnick WJ (1982) Geographic and temporal patterns of ge-netic variation ofAedes aegyptiin New Orleans. Am J Trop Hyg 31:849-853.
Tabachnick WJ and Wallis GP (1985) Population genetic struc-ture of the yellow fever mosquitoAedes aegyptiin the
Carib-bean: ecological considerations. International Mosquito Ecology Workshop Symposium. Vero Beach, Florida. Wallis GP, Tabachnick WJ and Powell JR (1984) Genetic
hetero-geneity among Caribbean populations ofAedes aegypti. Am J Trop Med Hyg 33:492-498.
Weir BS and Cockerham CC (1984) Estimating F-Statistics for the analysis of population structure. Evolution 38:1538-1370.