ISSN 1678-992X
ABSTRACT: The chemical composition of corn is variable and the knowledge of its chemical and energetic composition is required for an accurate formulation of the diet. This study aimed to determine the chemical composition, that is, dry matter (DM), mineral matter (MM), neutral detergent fiber (NDF), acid detergent fiber (ADF), ether extract (EE), crude protein (CP), gross energy (GE) and energetic values of different varieties (batches) of corn and validate mathemat-ical models to predict the metabolizable energy values (ME) of corn for pigs using near infrared spectroscopy (NIRS).Corn samples were scanned in the spectrum range between 1,100 and 2,500 nm, the model parameters were estimated by the modified partial least squares (MPLS) method. Ten prediction equations were inserted into the NIRS and used to estimate the ME values. The first degree linear regression models of the estimated ME values in function of the observed ME values were adjusted. The existence of a linear ratio was evaluated by detecting the significance to posterior estimates of the straight line parameters. The values of digestible energy and ME ranged from 3,400 to 3,752 and 3,244 to 3,611 kcal kg–1, respectively. The
prediction equations, ME1 = 4334 – 8.1MM + 4.1EE – 3.7NDF; ME2 = 4,194 – 9.2MM + 1.0CP + 4.1EE – 3.5NDF; and ME7 = 16.13 – 9.5NDF + 16EE + (23CP × NDF) – (138MM × NDF) were the most adequate to predict the ME values of corn by using NIRS.
Keywords: chemical composition, prediction equations, validation, swine
Using near infrared spectroscopy to predict metabolizable energy of corn
Silvia Letícia Ferreira1*, Ricardo Souza Vasconcellos2, Robson Marcelo Rossi3, Vinicius Ricardo Cambito de Paula4, Marcelise Regina
Fachinello1, Laura Marcela Díaz Huepa1, Paulo Cesar Pozza2
1State University of Maringá – Dept. of Animal Sciences, Av.
Colombo, 5790 − 87020-900 − Maringá, PR − Brazil.
2State University of Maringá − Dept. of Animal Sciences. 3State University of Maringá − Dept. of Statistics. 4São Paulo State University/FMVZ − Dept. of Animal
Production, R. Prof. Dr. Walter Mauricio Correa, s/n –18618-681 − Botucatu, SP – Brazil.
*Corresponding author <[email protected]> Edited by: Antonio Faciola
Received December 29, 2016 Accepted September 27, 2017
Introduction
Although corn (Zea mays L.) is considered food of well-defined chemical composition, with average values provided in food composition tables, factors such as soil fertility, genetic variety of cultivars, planting conditions, storage and processing can significantly alter the chem-ical composition of corn (Li et al., 2014). Determining nutrient composition of corn generally requires differ-ent procedures for each nutridiffer-ent. In addition, energy value of feed ingredients is evaluated mainly through traditional digestion-metabolism experiments, which are labor intensive, time consuming and expensive, which may impair its use in the feed industry (Li et al., 2016).
Thus, other methods have attempted to determine the chemical composition and energetic value of corn, such as the near infrared spectroscopy (NIRS) technol-ogy, which is rapid, non-destructive and analyzes more than one component at the same time, avoiding the use of chemical reagents and producing no waste (Swart et al., 2012). Some studies have also indicated that NIRS is useful to predict the nutritive and energetic content of feed ingredients and diets for poultry (Valdes and Lee-son, 1992, 1994), rabbits (Xiccato et al., 1999, 2003) and even swine (Aufrère et al., 1996; Van Barneveld et al., 1999). However, to the best of our knowledge there is just one report (Li et al., 2016) on the rapid prediction of DE and ME content in corn by NIRS in pigs.
NIRS, in conjunction with prediction equations to estimate the energy value of feed ingredients, is already used by some feed industries; however, the results need
validation, because they consider the prediction errors of estimates of chemical composition and ME, not only the prediction error of the adjusted models to estimate ME of feed ingredients. This study was conducted to deter-mine the chemical composition and energetic values of different corn varieties and validate mathematical models to predict the ME values of corn for pigs by using NIRS.
Materials and Methods
Samples preparation and laboratorial chemical analysis
Ninety-nine corn samples of different varieties and from different municipalities [Ângulo (23°12'52" S, 51°56'6" W, 300 m above sea level); Apucarana (23°31'30" S, 51°24'20" W, 988 m above sea level); Arapongas (23°25'8" S, 51°25'26" W, 816 m above sea level); Atalaia (23°10'05" S, 52°03'10" W, 630 m above sea level); Califórnia (23°39'00" S; 51°21'18" W, 800 m above sea level); Foz do Iguaçu (25°32'45" S, 54°35'07" W; 192 m above sea level); Maringá (23°25'31" S, 51°56'19" W, 555 m above sea level)] of Paraná State, Brazil, were ground through a 1 mm screen and stored in plastic pots, prior chemical analysis. The samples were analyzed using the methods of AOAC International (AOAC, 1990, 2002) for dry matter (DM; AOAC method 934.01), mineral matter (MM; AOAC method 942.05), neutral detergent fiber (NDF; AOAC method 2002:04, 2002), acid detergent fiber (ADF; AOAC method 973.18), ether extract (EE; AOAC method 920.39) and crude
pro-Animal Science and Pastur
es
|
Resear
ch Ar
ticle
tein (CP; AOAC method 954.01). Eighty samples were chosen randomly as a calibration set and nine samples were used for external validation. The remaining ten samples were used in the metabolism assay. Corn, diets, and excreta were analyzed for gross energy (GE, kcal kg–1) using a bomb calorimeter.
NIRS spectra collection
Spectral measurements were performed using a FOSS XDS rapid content with the spectrometer search grid in the full spectrum 400-2500 nm. Spectral data col-lection, processing and calibration were conducted with the software WinISI III. Raw (log (1/R)) data were cor-rected for the scatter effects using the standard normal variance (SNV) and detrend (DT) combined with a math-ematical treatment (2, 4, 4, 1) to derive the NIRS spec-trum. The first number indicates the order of derivative function, the second is the gap, the third represents the number of data points used in the first smoothing, and the fourth is the number of data points in the second smoothing, which is normally set at 1 for no second smoothing (Li et al., 2016).
Calibration and validation process
The selection of the spectra / sample that best rep-resented the data set and the separation of samples that showed large differences compared to the other calibra-tion set of samples were analyzed by the principal com-ponent analysis (PCA). A standardized H static (GH = 3) and Neighborhood H (NH = 0) were adopted to detect outliers.
The regression model parameters were estimated by the modified partial least squares (MPLS) regression method. The calibration model was developed by regres-sion of absorption spectra of standard samples (n = 80) and their respective values of DM, CP, EE, GE, ADF, NDF and MM, which were obtained by conventional laboratory analyses.
The calibration model was evaluated by cross-val-idation (made by NIRS) and through an external vali-dation using the valivali-dation set (n = 9). The results of corn chemical composition, obtained from the conven-tional laboratory analyses and NIRS technology, were compared in a paired manner (observed and predicted values) using the Bayesian approach. The differences in the results of each pair of samples were written as DIF = y2 – y1, providing a sample of differences, normally distributed such as:
Difi ~ N(µ, τ)
with i = 1, 2, ..., n, considering for µ (average) and τ (precision), noninformative prior distributions, such that
µ ~ N(0,10–6) and τ ~ Gama (10–3,10–3) with variance
σ2 = 1/τ, according to the OpenBUGS parameterization
computer program that simulates the chains of param-eters through the Monte Carlo Markov Chain (MCMC) method.
To evaluate the existence (or absence) of the cor-relation between values obtained by NIRS and by the conventional laboratory analyses, we used a Bayesian model, assuming that the response Y has the character-istics of a bivariate normal distribution, that is:
Y N2 11
2 12
21 22 2
1
2
µ µ
σ σ σ σ Y
Y
,
,
where: µY1 and µY2 correspond to Y1 and Y2
respons-es, respectively, and NIRS / predicted and Laboratory / observed for each composition parameter. Similarly, σ
11 2 and σ
22
2 represent their respective variances, and σ
12
= σ21, the covariance between Y1 and Y2. For bivariate model parameters, a noninformative prior distribution was considered µ(.) ~ N (0, 10–6) and a precision matrix
Ω ~ W was deduced, where W is a Wishart distribution
with matrix (co) variance given by Σ = Ω–1. The
correla-tion ρ was given by σ σ σ
12/ 11 22 , according OpenBUGS
parameterization (Rossi et al., 2014).
In both models, posterior distributions were ob-tained through the Brugs package program R (R Develop-ment Core Team, 2014). Fifty thousand values were gen-erated through the MCMC method, with a discharge of 1,000 initial values in jumps of size 1. The convergence of the chains was tested by the coda package R program ac-cording to the criterion of Heidelberger and Welch (1983). The average posterior estimates were used for each composition parameter and a credibility interval was calculated for the average difference, where signifi-cance was observed in the parameters in which the val-ue zero did not belong to the range of 95 % of credibility.
Metabolism assay
The metabolism assay was carried out in Maringá, Paraná, Brazil (23°21' S, 52°04' W, altitude 564 m). All experimental procedures were previously submitted to the Ethics Committee on Animal use in trial (CEUA n° 8329240815). Forty-four crossbred barrows with aver-age initial weights of 25.05 ± 2.01 kg were distributed in a randomized block design with ten treatments plus the reference diet and four replicates per treatment. Corn cultivars replaced 25 % of the reference diet. The chemical composition of ten corn cultivars used in the metabolism assay was determined by the conventional laboratory analyses and the NIRS technology, using the previously developed calibration model.
The experimental period lasted 12 days, seven days for animal adaptation to metabolism cages and feed and five days of feces and urine collection, which were performed once a day, at 08h00. The beginning and the end of the collection period was determined using 2 % iron oxide (Fe2O3) as a fecal marker.
Council (2012). The ration provided daily was calculated
based on metabolic weight (kg0.75) of each animal and
on the average consumption recorded in the adaptation period. The diets were moistened with water, at approxi-mately 30 % of the feed, and fed twice a day (07h30 and 15h00).
The digestible energy (DE), ME, digestibility coef-ficients of GE (DCGE), metabolizability coefcoef-ficients of GE (MCGE), and ME: DE ratio were determined. The analysis of variance (ANOVA) was performed using PROC ANOVA using SAS (Statistical Analysis System, version 8.1), and the DCGE and MCGE were analyzed using the Student Newman Keuls test.
To estimate the ME values, ten equations were included in NIRS (Table 1). A database containing the observed metabolizable energy values (OME) and the es-timated metabolizable energy values (EMElab and EME-nirs) were tabulated. The OME data were obtained in the metabolism assay, while the EMElab data were ob-tained from replacing the chemical composition of corn obtained by the conventional analyses (LAB) in the pre-diction equation. The EMEnirs data were obtained from reading the corn samples in NIRS, using the calibration model developed to predict the chemical composition of values associated with the prediction equations selected in the literature and inserted into NIRS.
The validation of prediction equations was ini-tially assessed with the adjustment of linear regression models of the first degree of estimated metabolizable en-ergy values (EMEnirs and EMElab) due to the observed metabolizable energy values (OME), following a Bayes-ian approach assuming that:
Yi~N(µ,τ) such that µ = β0 + β1Xi
where: Y is the EMEnirs and EMElab and X is OME. For parameters β0, β1 and τ (precision), a noninforma-tive prior distribution and independent were assumed, respectively, β0 ~ N(0, 10–6), β
1 ~ N(0, 10
–6) and τ ~
Gama(10–3,10–3) with variance σ2 = 1/τ, according to
OpenBUGS parameterization.
Posterior distributions were obtained through the BRugs package from program R (R Development Core
Team, 2014), where one million values were generated in a MCMC process with a discharge of 100,000 initial values in jumps of size 1. The convergence of the chains was tested by the convergence diagnostics and output analysis (CODA) package R program, following the cri-terion of Heidelberger and Welch (1983).
The null hypothesis H0: βi = 0 was tested against the bilateral alternative hypothesis Ha: βi ≠ 0 for each parameter individually. The linear relationship between estimated and observed values was evaluated by detect-ing the significance of estimated a posterior parameter
β0 and β1, recorded where the null (zero) did not belong to the 95 % credible intervals for each parameter. The absence of significance for the angular coefficient (β1) of the model indicated no linear relationship between EME and OME.
The regression models adjusted for each equation were subjected to a comparison test intercept (β0) and the angular coefficient (β1) to verify whether the gen-erated regression models were similar for the different methods of analysis. In this case, the null hypothesis H0:
βinirs = βilab was tested against the two-sided alterna-tive hypothesis Ha: βinirs ≠βilab, i = 0.1, for β0 and β1 in-dividually. In cases where the null (zero) did not belong to the 95 % credible interval for the difference between the respective coefficients of each model, the adjusted models were considered distinct.
Results and Discussion
Calibration and cross-validation
The calibration and cross-validation statistics are shown in Table 2. In the calibration set, the highest
coef-ficients of determination were obtained for DM (R2 =
0.99), CP (R2 = 0.94), GE (R2 = 0.86) and EE (R2 = 0.83),
with values for the standard error of cross-validation (SECV) of 0.39, 0.39, 19.62 and 0.24, for each parameter, respectively. The coefficient of determination indicates how much of the variation in the data is explained by the adjusted model; however, R2 should not be considered in
isolation, as it is generally applicable to the dataset from which it was generated and is not a good parameter for independent data sets (Shenk et al., 2007).
Table 1 – Prediction equations used to estimate ME of corn with NIRS.
Item1 Equation (R2)2
ME1 (Noblet and Perez, 1993) 4,334 – 8.1MM + 4.1EE – 3.7NDF 0.91
ME2 (Noblet and Perez, 1993) 4,194 – 9.2MM + 1.0CP + 4.1EE – 3.5NDF 0.92
ME3 (Noblet and Perez, 1993) 1099 + 0.740GE – 5.5MM – 3.7NDF 0.91
ME4 (Ferreira et al., 1997) 3221.47 + 60.91CP – 29.04MM 0.86
ME5 (Li et al., 2014) 4,464.24 + 20.15EE – 17.84NDF – 233.72MM 0.44
ME6 (Li et al., 2014) 4,289.74 + 20.02CP + 22.47EE – 18.40NDF – 245.20MM 0.49 ME7 (Morgan et al., 1987) 16.13 – 9.5NDF + 16EE + (23CP × NDF) – (138MM × NDF) 0.39
ME8 (Morgan et al., 1987) 17.50 – 15.3NDF + 16EE + 5.9CP – 34MM 0.40
ME9 (Morgan et al., 1987) 18.47 – 21NDF + 16EE + (30CP × NDF) – 32MM 0.40
ME10 (Morgan et al., 1987) 5.42 – 17.2NDF – 19.4MM + 0.709GE 0.43
1Suffix (ME
X) corresponds to the number of equations;
All GH values were below the limit (GH < 3) indi-cated by Shenk et al. (2007), showing good accuracy of the adjusted models, because the higher the GH value, the lower the accuracy of the adjusted model. The pa-rameters that showed the best results for the standard error of performance (SEP) were DM, EE, CP and MM; however, the coefficient of determination for the MM was low (R2 = 0.30).
External validation
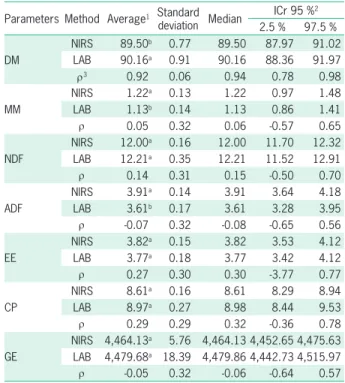
The paired test showed differences between the methods of analysis used (NIRS and LAB) for DM, MM and ADF (Table 3). For CP, NDF and EE, although there
was no difference (p > 0.05) between the methods of
analysis, the correlation between the methods was low, with values of 0.29, 0.14 and 0.27, respectively. Among all parameters, the DM showed the highest correlation (ρ) between the LAB values and NIRS results, showing good precision of the fitted model for this parameter. The worst correlations were observed for MM, ADF and GE.
The difference observed for MM can be related to the low specificity of the NIRS technology to predict the mineral content of food or ingredients. As NIRS relies on how infrared light is absorbed by organic compounds (Age-let et al., 2012), theoretically, there are no absorption bands for minerals in the near infrared region (Clark et al., 1987; Shenk et al., 2007). Minerals forming organic complexes or chelates may be detected, but there are no spectral match-es for minerals in the ionic or salt form (Shenk et al., 2007). Regarding the NDF and ADF, the difference between the methods of analysis and the low correlation between the LAB and NIRS results can be attributed to the diffi-culty of accurately determining the different fractions that comprise the fiber content of foods, which influences the reference values and consequently the predictive power of the fitted curve.
Metabolism assay
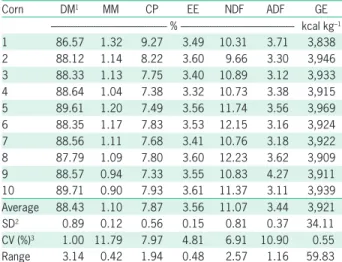
The corn cultivars used in the metabolism assay showed DM values ranging from 86.57 % to 89.71 %
(Table 4). Mineral matter contents ranged from 0.90 % to 1.32 %, corroborating the findings of Pasquetti et al. (2015). The EE values varied from 3.32 % to 3.61 %, near the average (3.65 %) proposed by Rostagno et al. (2011) and also consistent with the value (3.48 %) dis-played in the NRC (2012).
The CP contents found in this study resemble the average (7.88 %) proposed by Rostagno et al. (2011) and are similar to those found by Pasquetti et al. (2015). The ADF values were greater than 3.00 %, reaching 4.27 %. These figures contrast with those found by Kil et al. (2014), who assessed the digestibility of CP and amino acids in corn of different origins for pigs and obtained mostly values below 3.00 %.
The NDF had values between 9.66 % and 12.23 %, with the maximum value close to the value (11.93 %) submitted by Rostagno et al. (2011) and the lowest value similar to the default value (9.11 %) by the NRC (2012). This variation observed in the chemical and nutritional composition of corn may be related to soil fertility, the genetic variety of cultivars, planting conditions, anti-nu-tritional factors, storage and processing (Li et al., 2014). The digestibility coefficients of GE (Table 5) ranged from 85.68 % to 95.66 %, with an average of 90.72 %, which is higher than the average of 88 % indicated by Rostagno et al. (2011) and the NRC (2012). Cultivar 7
Table 3 – Bayesian estimates for bromatological corn composition analyzed by reflectance spectroscopy in the near infrared (NIRS) and physico-chemical method (LAB).
Parameters Method Average1 Standard
deviation Median
ICr 95 %2
2.5 % 97.5 % DM
NIRS 89.50b 0.77 89.50 87.97 91.02
LAB 90.16a 0.91 90.16 88.36 91.97
ρ3 0.92 0.06 0.94 0.78 0.98
MM
NIRS 1.22a 0.13 1.22 0.97 1.48
LAB 1.13b 0.14 1.13 0.86 1.41
ρ 0.05 0.32 0.06 -0.57 0.65
NDF
NIRS 12.00a 0.16 12.00 11.70 12.32
LAB 12.21a 0.35 12.21 11.52 12.91
ρ 0.14 0.31 0.15 -0.50 0.70
ADF
NIRS 3.91a 0.14 3.91 3.64 4.18
LAB 3.61b 0.17 3.61 3.28 3.95
ρ -0.07 0.32 -0.08 -0.65 0.56
EE
NIRS 3.82a 0.15 3.82 3.53 4.12
LAB 3.77a 0.18 3.77 3.42 4.12
ρ 0.27 0.30 0.30 -3.77 0.77
CP
NIRS 8.61a 0.16 8.61 8.29 8.94
LAB 8.97a 0.27 8.98 8.44 9.53
ρ 0.29 0.29 0.32 -0.36 0.78
GE
NIRS 4,464.13a 5.76 4,464.13 4,452.65 4,475.63
LAB 4,479.68a 18.39 4,479.86 4,442.73 4,515.97
ρ -0.05 0.32 -0.06 -0.64 0.57 DM = Dry matter; MM = Mineral matter; NDF = Neutral detergent fiber; ADF = Acid detergent fiber; EE = Ether extract; CP = Crude protein; GE = Gross energy. 1Different letters in the columns indicate significant differences
between the analysis methods through Bayesian comparisons; 2ICr =
Credibility interval (p≤ 0.05); 3ρ = Correlation. Table 2 – Results for the prediction equation in the set of calibration
samples.
Variable n Average SEC R2 SECV 1-VR RPD SEP Bias GH
DM 73 90.30 0.18 0.99 0.39 0.98 6.93 0.33 0.055 0.986 MM 74 1.21 0.11 0.30 0.12 0.17 1.39 0.16 0.024 1.000 NDF 74 12.05 0.79 0.15 0.84 0.02 1.29 0.81 0.030 1.004 ADF 76 3.97 0.39 0.40 0.52 -0.05 1.04 0.43 0.034 1.000 EE 73 3.96 0.17 0.83 0.24 0.66 3.23 0.21 0.010 1.003 CP 74 9.02 0.16 0.94 0.39 0.64 1.12 0.21 0.017 0.988 GE 74 4,476 12.85 0.86 19.62 0.69 1.84 14.06 -0.763 0.977 DM = Dry matter; MM = Mineral matter; CP = Crude protein; EE = Ether extract; NDF = Neutral detergent fiber; ADF = Acid detergent fiber; GE = Gross energy; SEC = Standard error of the calibration set; R2 = Coefficient
showed higher DCGE (p≤ 0.05) compared to Cultivars 10 and 5 that had higher NDF contents compared to other cultivars (except Corns 6 and 8), which may have contributed to the lower DCGE and GE (Le Goff and Noblet, 2001; Noblet and van Milgen, 2004).
The average ME value was 3,434 kcal kg–1,
rang-ing from 3,244 to 3,611 kcal kg–1, similar to the
aver-age value of 3,430 kcal kg–1 found by Li et al. (2014),
who evaluated different cultivars of corn for growing pigs. ME variation is a reflection of the different chemi-cal compositions of the evaluated values found for corn, since the ME and chemical composition of the feed are directly correlated and can be predicted directly from nutrient composition (NRC, 2012).
Although the DCGE and MCGE are higher than the values reported in the literature, the ratio ME:DE remained close to the calculated values (0.96) using the data presented by Rostagno et al. (2011) and reflected the value (0.98) suggested by the NRC (2012). Even with the higher CP content, Cultivar 1 had the lowest ME:DE ra-tio (0.94) because, according to Noblet and Perez (1993), the ratio ME:DE is linearly (inversely) related to the CP content of the diet, which was observed in this study.
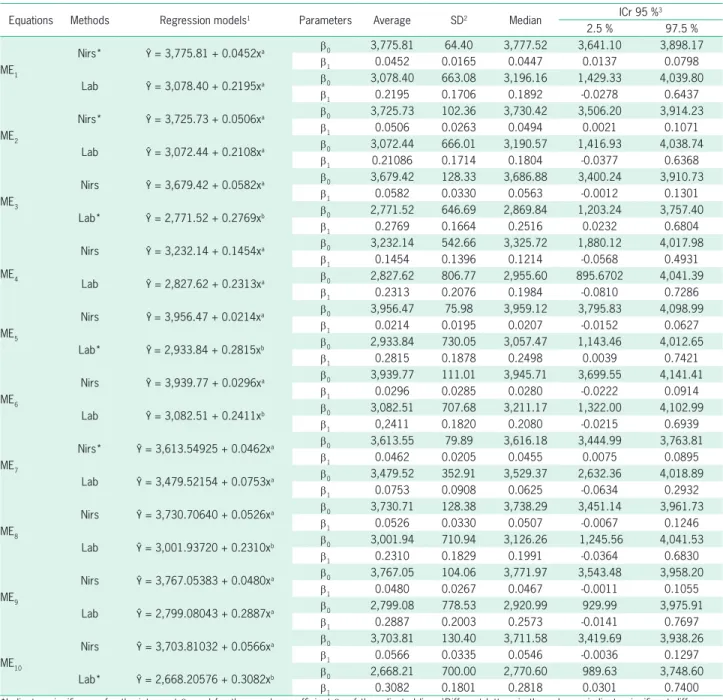
Among all evaluated prediction equations, six had significance (p ≤ 0.05) for both coefficients (β0 ≠ 0 and
β1≠ 0) and the set straight (ME1, ME2, ME3, ME5, ME7 and ME10). Thus, the observed metabolizable energy val-ues explained the estimated valval-ues for these equations (Table 6).
The equations ME1, ME2 and ME7 (Table 1) were effective in predicting ME values only when associated
with NIRS technology. The equations ME3, ME5 and
ME10 were effective in predicting ME values only when
associated with corn chemical composition obtained by the conventional methods (LAB). The effectiveness of different equations for each method of analysis can be justified by the fact that most equations tested had MM as regressive variable, as explained earlier. In addition, MM has a negative effect on ME, since it acts as a dilu-ent of GE, reducing the organic matter contdilu-ent in foods (Morgan et al., 1987; Pasquetti et al., 2015).
The NDF is another regressive variable that may have contributed to the variation in performances of the same equation due to the difficulty to determine ac-curately the different fractions that comprise the food fiber. This influences the reference values and, conse-quently, the predictive power of the adjusted model. In addition, the fibrous fraction is considered an important predictor of the energy value of food.
Fiber has a negative effect due to its lower digest-ibility and its ability to cause changes in the apparent digestibility of the other nutrients (Noblet et al., 1993). As the NDF content increases, there is a reduction in the digestibility of CP and EE (Le Goff and Noblet, 2001; Noblet et al., 1993; Noblet and van Milgen, 2004), which contribute to the energy values of food.
Thus, the significance observed for the equations
(ME1, ME2 and ME7), when associated with the NIRS
method, is explained by the other regressive variables of the model (Table 6). Variables, such as GE and EE, when together with NDF, form a reasonable basis for a predictive equation (Morgan et al., 1987). Similary, EE is considered a good predictor of corn ME due to its high energy value (Li et al., 2014) and has a positive effect on ME (Morgan et al., 1987). The equations ME4, ME6, ME8 and ME9 showed no significance for the angular coeffi-cient (β1), demonstrating the absence of a linear relation-ship between EME and OME for the evaluated methods (NIRS or LAB).
The use of prediction equations associated or not to NIRS requires caution, since predicted ME values us-ing NIRS (EMEnirs) are often similar to laboratory
val-Table 4 – Chemical composition of corn of different cultivars expressed as feed basis.
Corn DM1 MM CP EE NDF ADF GE
--- % --- kcal kg–1
1 86.57 1.32 9.27 3.49 10.31 3.71 3,838 2 88.12 1.14 8.22 3.60 9.66 3.30 3,946 3 88.33 1.13 7.75 3.40 10.89 3.12 3,933 4 88.64 1.04 7.38 3.32 10.73 3.38 3,915 5 89.61 1.20 7.49 3.56 11.74 3.56 3,969 6 88.35 1.17 7.83 3.53 12.15 3.16 3,924 7 88.56 1.11 7.68 3.41 10.76 3.18 3,922 8 87.79 1.09 7.80 3.60 12.23 3.62 3,909 9 88.57 0.94 7.33 3.55 10.83 4.27 3,911 10 89.71 0.90 7.93 3.61 11.37 3.11 3,939 Average 88.43 1.10 7.87 3.56 11.07 3.44 3,921 SD2 0.89 0.12 0.56 0.15 0.81 0.37 34.11
CV (%)3 1.00 11.79 7.97 4.81 6.91 10.90 0.55
Range 3.14 0.42 1.94 0.48 2.57 1.16 59.83
1DM = Dry matter; MM = Mineral matter; CP = Crude protein; EE = Ether
extract; NDF = Neutral detergent fiber; ADF = Acid detergent fiber; GE = Gross energy; 2SD = Standard deviation; 3CV% = Coefficient of variation.
Table 5 – Energetic values and coefficients of metabolizable energy of different corns for pigs, as feed basis.
Corn GE1 DCGE2 DE3 CMGE4 ME5 ME:DE6
kcal kg–1 % kcal kg–1 % kcal kg–1
1 3,838 90.33abc 3,467 84.51b 3,244 93
2 3,946 91.18abc 3,598 88.61ab 3,497 97
3 3,933 90.49abc 3,559 86.83ab 3,415 96
4 3,915 90.76abc 3,553 88.75ab 3,474 97
5 3,969 85.68c 3,400 83.00b 3,294 96
6 3,924 92.07abc 3,613 88.40ab 3,469 96
7 3,922 95.66ª 3,752 92.07ª 3,611 96 8 3,909 92.97ab 3,634 90.02ab 3,518 96
9 3,911 90.13abc 3,525 87.98ab 3,441 97
10 3,939 87.97bc 3,465 85.74ab 3,377 97
CV%7 - 3.06 - 3.41 -
-abcMeans followed by different letters in the column differ by Student Newman
Keuls Test (p≤ 0.05); 1Gross energy; 2Digestibility coefficients of gross
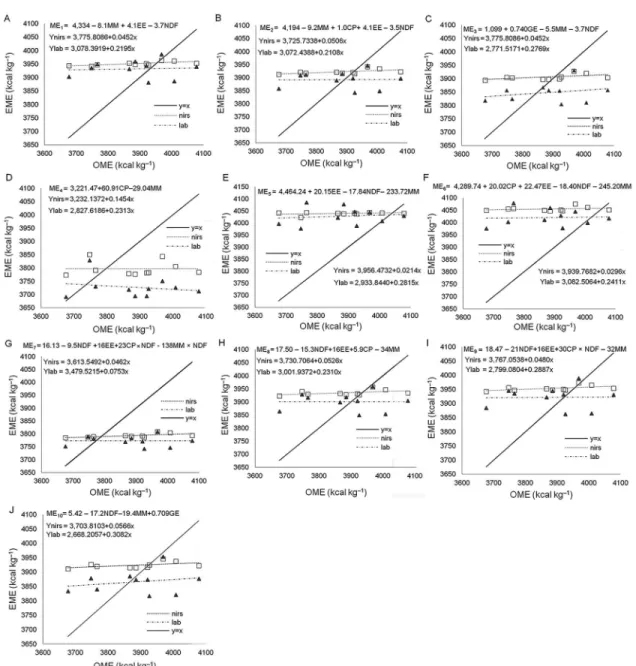
1D and I) adjusted between the values estimated and observed in the metabolism test for the evaluated methods (NIRS and LAB) and cannot be used to predict the ME values of corn. The adjusted regression models for equations ME3, ME5, ME6, ME8 and ME10 were con-sidered distinct by the comparison test of parameters (Table 6 and Figures 1C, E, F, H and J).Equations ME1,
ME2 and ME7 comprise up to four variables of
chemi-cal corn composition, which are all well predicted us-ues (EMElab), but both predictions may differ from the
real value of ME, determined in the metabolism assay (OME) (Figures 1A, B, and G).
Based on the comparison test of parameters of the adjusted regression models for the different methods of analysis, equations ME1, ME2, ME4, ME7 and ME9 were considered to be the same (Figures 1A, B, D, G and I).
However, ME4 and ME9 equations were not significant
for the angular coefficient of the straight line (Figures
Table 6 – Posterior Bayesian estimates for regression equations of the estimated values of metabolizable energy (EME) as a function of the observed values of metabolizable energy (OME), for the corn analyzed by near-infrared spectroscopy (NIRS) and physico-chemical methods (LAB).
Equations Methods Regression models1 Parameters Average SD2 Median ICr 95 % 3
2.5 % 97.5 %
ME1
Nirs* Ŷ = 3,775.81 + 0.0452xa β0 3,775.81 64.40 3,777.52 3,641.10 3,898.17
β1 0.0452 0.0165 0.0447 0.0137 0.0798
Lab Ŷ = 3,078.40 + 0.2195xa β0 3,078.40 663.08 3,196.16 1,429.33 4,039.80
β1 0.2195 0.1706 0.1892 -0.0278 0.6437
ME2
Nirs* Ŷ = 3,725.73 + 0.0506xa β0 3,725.73 102.36 3,730.42 3,506.20 3,914.23
β1 0.0506 0.0263 0.0494 0.0021 0.1071
Lab Ŷ = 3,072.44 + 0.2108xa β0 3,072.44 666.01 3,190.57 1,416.93 4,038.74
β1 0.21086 0.1714 0.1804 -0.0377 0.6368
ME3
Nirs Ŷ = 3,679.42 + 0.0582xa β0 3,679.42 128.33 3,686.88 3,400.24 3,910.73
β1 0.0582 0.0330 0.0563 -0.0012 0.1301 Lab* Ŷ = 2,771.52 + 0.2769xb β0 2,771.52 646.69 2,869.84 1,203.24 3,757.40
β1 0.2769 0.1664 0.2516 0.0232 0.6804
ME4
Nirs Ŷ = 3,232.14 + 0.1454xa β0 3,232.14 542.66 3,325.72 1,880.12 4,017.98
β1 0.1454 0.1396 0.1214 -0.0568 0.4931 Lab Ŷ = 2,827.62 + 0.2313xa β0 2,827.62 806.77 2,955.60 895.6702 4,041.39
β1 0.2313 0.2076 0.1984 -0.0810 0.7286
ME5
Nirs Ŷ = 3,956.47 + 0.0214xa β0 3,956.47 75.98 3,959.12 3,795.83 4,098.99
β1 0.0214 0.0195 0.0207 -0.0152 0.0627 Lab* Ŷ = 2,933.84 + 0.2815xb β0 2,933.84 730.05 3,057.47 1,143.46 4,012.65
β1 0.2815 0.1878 0.2498 0.0039 0.7421
ME6
Nirs Ŷ = 3,939.77 + 0.0296xa β0 3,939.77 111.01 3,945.71 3,699.55 4,141.41
β1 0.0296 0.0285 0.0280 -0.0222 0.0914 Lab Ŷ = 3,082.51 + 0.2411xb β0 3,082.51 707.68 3,211.17 1,322.00 4,102.99
β1 0,2411 0.1820 0.2080 -0.0215 0.6939
ME7
Nirs* Ŷ = 3,613.54925 + 0.0462xa β0 3,613.55 79.89 3,616.18 3,444.99 3,763.81
β1 0.0462 0.0205 0.0455 0.0075 0.0895
Lab Ŷ = 3,479.52154 + 0.0753xa β0 3,479.52 352.91 3,529.37 2,632.36 4,018.89
β1 0.0753 0.0908 0.0625 -0.0634 0.2932
ME8
Nirs Ŷ = 3,730.70640 + 0.0526xa β0 3,730.71 128.38 3,738.29 3,451.14 3,961.73
β1 0.0526 0.0330 0.0507 -0.0067 0.1246 Lab Ŷ = 3,001.93720 + 0.2310xb β0 3,001.94 710.94 3,126.26 1,245.56 4,041.53
β1 0.2310 0.1829 0.1991 -0.0364 0.6830
ME9
Nirs Ŷ = 3,767.05383 + 0.0480xa β0 3,767.05 104.06 3,771.97 3,543.48 3,958.20
β1 0.0480 0.0267 0.0467 -0.0011 0.1055 Lab Ŷ = 2,799.08043 + 0.2887xa β0 2,799.08 778.53 2,920.99 929.99 3,975.91
β1 0.2887 0.2003 0.2573 -0.0141 0.7697
ME10
Nirs Ŷ = 3,703.81032 + 0.0566xa β0 3,703.81 130.40 3,711.58 3,419.69 3,938.26
β1 0.0566 0.0335 0.0546 -0.0036 0.1297 Lab* Ŷ = 2,668.20576 + 0.3082xb β0 2,668.21 700.00 2,770.60 989.63 3,748.60
β1 0.3082 0.1801 0.2818 0.0301 0.7400
*Indicates significance for the intercept β0 and for the angular coefficient β1 of the adjusted line;
1Different letters in the columns indicate significant differences
Figure 1 – Regression models adjusted for the estimated metabolizable energy (EME) values by equations ME1 (A), ME2 (B), ME3 (C), ME4 (D), ME5 (E), ME6 (F), ME7 (G), ME8 (H), ME9 (I), ME10 (J) as a function of the observed metabolizable energy (OME) values for corn analyzed by near infrared spectroscopy (NIRS) and physical chemical methods (LAB).
ing NIRS (Figures 1A, B and G). The use of these NIR-predicted parameters allows for easy and economical application (Pozza et al., 2008). Developing prediction equations with few variables is important because it facilitates the maintenance of robustness and predic-tive power of the NIRS calibration / prediction curve. Moreover, it allows for the periodical expansion of the reference database.
Conclusion
Near infrared spectroscopy was effective in de-termining the NDF, EE, CP and GE contents compared
to the conventional method of laboratory analysis, indi-cating that NIRS could be used as an analysis method to determine corn chemical composition. The calibration set with a larger number of samples and the optimiza-tion of spectral pre-treatment could improve the NIRS calibration and prediction performance for MM. The
prediction equations ME1 = 4,334 - 8.1MM + 4.1EE
- 3.7NDF; ME2 = 4,194 - 9.2MM + 1.0CP + 4.1EE -
3.5NDF and ME7 = 16.13 - 9.5NDF + 16EE + (23CP
Acknowledgements
We thank the State University of Maringá, for sup-porting this work, the Coordination for the Improvement of Higher Level Personnel (CAPES), for the scholarship grant, and the Complex of Research Support Centers (COMCAP) and Research and Projects Financing (FINEP) for enabling the analysis of the adiabatic calorimeter.
References
Association of Official Analytical Chemists - International [AOAC]. 1990. Official Methods of Analysis. 15ed. AOAC, Gaithersburg, MD, USA.
Association of Official Analytical Chemists - International [AOAC]. 2002. Official Method 2002:04. AOAC, Rockville, MD, USA. Agelet, L.E.; Ellis, D.D.; Duvick, S.; Goggi, A.S.; Hurburgh,
C.R.; Gardner, C.A. 2012. Feasibility of near infrared
spectroscopy for analyzing corn kernel damage and viability of soybean and corn kernels. Journal of Cereal Science 55: 160-165. Aufrère, J.; Graviou, D.; Demarquilly, C.; Perez, J.M.; Andrieu, J.
1996. Near infrared refl ectance spectroscopy to predict energy value of compound feeds for swine and ruminants. Animal Feed Science and Technology 62: 77-90.
Clark, D.H.; Mayland, H.F.; Lamb, R.C. 1987. Mineral analysis of forages with near infrared reflectance spectroscopy1. Agronomy Journal 79: 485-490.
Ferreira, E.R.A.; Fialho, E.T.; Teixeira, A.S. 1997. Evaluation of the chemical composition and determination of energetics values and prediction equation of some feedstuffs for swine. Revista Brasileira de Zootecnia 26: 514-523 (in Portuguese, with abstract in English).
Heidelberger, P.; Welch, P.D. 1983. Simulation run length control in the presence of an initial transient. Operations Research 31: 1109-1144.
Kil, D.Y.; Park, C.S.; Son, A.R.; Ji, S.Y.; Kim, B.G. 2014. Digestibility of crude protein and amino acids in corn grains from different origins for pigs. Animal Feed Science and Technology 196: 68-75.
Le Goff, G.; Noblet, J. 2001. Comparative total tract digestibility of dietary energy and nutrients in growing pigs and adult sows. Journal of Animal Science 79: 2418-2427.
Li, Q.; Zang, J.; Liu, D.; Piao, X.; Lai, C.; Li, D. 2014. Predicting corn digestible and metabolizable energy content from its chemical composition in growing pigs. Journal of Animal Science and Biotechnology 5: 11.
Morgan, C.A.; Whittemore, C.T.; Phillips, P.; Crooks, P. 1987. The prediction of the energy value of compounded pig foods from chemical analysis. Animal Feed Science and Technology 17: 81-107.
National Research Council [NRC]. 2012. Nutrient Requirements of Swine. 11ed. The National Academies Press, Washington, DC, USA.
Noblet, J.; Fortune, H.; Dupire, C.; Dubois, S. 1993. Digestible, metabolizable and net energy values of 13 feedstuffs for growing pigs: effect of energy system. Animal Feed Science and Technology 42: 131-149.
Noblet, J.; Perez, J.M. 1993. Prediction of digestibility of nutrients and energy values of pig diets from chemical analysis. Journal of Animal Science 71: 3389-3398.
Noblet, J.; van Milgen, J. 2004. Energy value of pig feeds: effect of pig body weight and energy evaluation system. Journal of Animal Science 82: 229-238.
Pasquetti, T.J.; Pozza, P.C.; Furlan, A.C.; Marcato, S.M.; Castilha, L.D.; Diaz-Huepa, L.M.; Fachinello, M.R.; Tanamati, W. 2015. Adjustment of equations to predict the metabolizable energy of corn for meat type quails. Semina: Ciencias Agrárias 36: 2861-2870.
Pozza, P.C.; Gomes, P.C.; Donzele, J.L.; Rostagno, H.S.; Pozza, M.S.S.; Rodrigueiro, R.J.B.; Nunes, R.V. 2008. Determination and prediction of the digestible and metabolizable energy values of poultry by-products for swine. Revista Brasileira de Saúde e Produção Animal 9: 734-742 (in Portuguese, with abstract in English).
Rossi, R.M.; Martins, E.N.; Lopes, P.S.; Silva, F.F. 2014. Univariate and bivariate Bayesian analysis for feed conversion of the Piau swine breed. Pesquisa Agropecuária Brasileira 49: 754-761 (in Portuguese, with abstract in English).
Rostagno, H.S.; Albino, L.F.T.; Donzele, J.L.; Gomes, P.C.; Oliveira, R.F.; Lopes, D.C.; Ferreira, A.S.; Barreto, S.L.T.; Euclides, F.R. 2011. Brazilian Tables for Poultry and Pigs: Food Composition and Nutritional Requirements = Tabelas Brasileiras para Aves e Suínos: Composição de Alimentos e Exigências Nutricionais. 3ed. UFV, Viçosa, MG, Brazil (in Portuguese).
Swart, E.; Brand, T.S.; Engelbrecht, J. 2012. The use of near infrared spectroscopy (NIRS) to predict the chemical composition of feed samples used in ostrich total mixed rations. South African Journal of Animal Science 42: 550-554.
Shenk, J.S.; Westerhaus, M.O.; Workman, J.J. 2007. Application of NIR spectroscopy to agricultural products. p. 347-386. In: Burns, D.A.; Ciurczak, E.W., eds. Handbook of near-infrared analysis. CRC Press, Boca Raton, FL, USA (Practical Spectroscopy, 35). Valdes, E.V.; Leeson, S. 1992. The use of near-infrared refl ectance
spectroscopy to measure metabolizable energy in poultry feed ingredients. Poultry Science 71: 1559-1563.
Valdes, E.V.; Leeson, S. 1994. Measurement of metabolizable energy, gross energy, and moisture in feed grade fats by nearinfrared refl ectance spectroscopy. Poultry Science 73: 163-171.
Van Barneveld, R.J.; Nuttall, J.D.; Flinn, P.C.; Osborne, B.G. 1999. Near infrared reflectance measurement of the digestible energy content of cereals for growing pigs. Journal of Near Infrared Spectroscopy 7: 1-7.
Xiccato, G.; Trocino, A.; Carazzolo, A.; Meurens, M.; Maertens, L.; Carabano, R. 1999. Nutritive evaluation and ingredient prediction of compound feeds for rabbits by near-infrared refl ectance spectroscopy (NIRS). Animal Feed Science and Technology 77: 201-212.