Bioactive Components and Antioxidant and Antibacterial Activities
of Di
ff
erent Varieties of Honey: A Screening Prior to Clinical
Application
Patricia Combarros-Fuertes,
†Leticia M. Estevinho,
‡Luis G. Dias,
‡Jose
́
M. Castro,
§Francisco A. Toma
s-Barbera
́
n,
́
∥M. Eugenia Tornadijo,
†and Jose
́
M. Fresno-Baro
*
,††
Department of Food Hygiene and Technology, Faculty of Veterinary Science, University of León, C/Profesor Pedro Carmenes s/n,́
Campus de Vegazana, 24007 León, Spain
‡
CIMO, Mountain Research Center, Polytechnic Institute of Bragança, Campus Santa Apolónia, 5301-855 Braganca, Portugaļ §
Departmentof Molecular Biology, Faculty of Biological and Environmental Sciences, University of León, Campus de Vegazana, s/n, 24007 León, Spain
∥
Research Group on Quality, Safety and Bioactivity of Plant Foods, CEBAS-CSIC. P.O. Box 164, 30100 Espinardo, Murcia, Spain
*
S Supporting InformationABSTRACT: This study assessed 16 different honey samples in order to select the best one for therapeutic purposes. First, a study of honey’s main bioactive compounds was carried out. Then phenolic profiles were determined and specific compounds quantified using a HPLC system coupled to a mass spectrometer. Then, antioxidant activity, by three in vitro methods, and antibacterial activity against reference strains and clinical isolates were evaluated. Great variability among samples was observed regarding ascorbic acid (between 0.34 ± 0.00 and 75.8 ± 0.41 mg/100 g honey; p < 0.001), total phenolic compounds (between 23.1±0.83 and 158±5.37 mg/100 g honey;p< 0.001), and totalflavonoid contents (between 1.65±0.11 and 5.93
± 0.21 mg/100 g honey; p < 0.001). Forty-nine different phenolic compounds were detected, but only 46 of them were quantified by HPLC. The concentration of phenolic compounds and the phenolic profiles varied widely among samples (between 1.06± 0.04 and 18.6± 0.73 mg/100 g honey;p< 0.001). Antioxidant activity also varied significantly among the samples. All honey varieties exhibited antibacterial activity against both reference and clinical strains (effective concentrations ranged between 0.05 and 0.40 g/mL depending on the honey sample and bacteria tested). Overall, samples with better combinations of bioactive properties were avocado and chestnut honeys.
KEYWORDS: honey, bioactive compounds, antioxidant activity, antibacterial activity, phenolic profiles
■
INTRODUCTIONHoney has been used as a medicinal remedy throughout the history of the human race: from ancient Egypt and the Classic civilizations (Greeks and Romans), who used honey in medicinal formulas, cosmetics, and perfumery or as embalming substance, to the Arab people of the Middle Ages, for whom honey was the basis of their pharmacy, as reflected in the Quran.1 In modern medicine, with the advent of antibiotics and other drugs, the use of honey was abandoned, mainly due to the absence of scientific studies. However, in recent decades, several investigations have demonstrated the bioactive proper-ties by which honey was empirically used.2
The miscellaneous composition of honey is responsible for the attributable numerous bioactive properties. Certain enzymes such as glucose oxidase and catalase, ascorbic acid, carotenoids, and melanoidins (Maillard reaction products) as well as phenolic acids and flavonoids are related to its antioxidant activity.3 Antibacterial properties are associated with intrinsic characteristics such as high osmolarity and acidity and compounds such as hydrogen peroxide (H2O2),
methyl syringate and methylglyoxal, defensin-1, nitric oxide metabolites, and phenolic acids andflavonoids.4−7In addition,
honey may increase lymphocytic and phagocytic activity and likewise antibody production.5
The majority of recent studies investigating the bioactivity and the action mechanisms of honey have focused on well-characterized, standardized active manuka honey (MkH). MkH is produced from the nectar of different Leptospermum species, native to New Zealand and Australia. Its greater activity is related to non-peroxide activity, due to the presence of an abundant suite of phenolic compounds, such as methyl glyoxal, methyl syringate, and leptosin, that distinguish them from other types of honey.2,8,9However, in recent years, more and more studies are demonstrating the bioactive properties of other varieties of honey different from MkH.
Unfortunately, honey composition is rather variable, depending primarily on botanical origin,10 conditioning its bioactive potential and hampering its further application for clinical purposes.3,4,11 This fact highlights the importance of selecting an adequate variety of honey to carry out clinical
Received: October 11, 2018
Revised: December 20, 2018
Accepted: December 21, 2018
Published: December 21, 2018
Article
pubs.acs.org/JAFC
Cite This:J. Agric. Food Chem.2019, 67, 688−698
assays,7which means a previous screening is necessary in order not only to quantify but also to determine profiles of bioactive substances, especially phenolic compounds; thus, the variation in these profiles might be responsible for the widely varying medical abilities of honey.
The working hypothesis of this study is whether distinct varieties of Spanish honey exhibit rather variable composition, especially regarding bioactive compounds, and in consequence significantly different therapeutic potential. In order to validate the veracity of this assumption, the aims of the study were (i) to quantify bioactive compounds in different honey samples (including a MkH sample as control), (ii) to identify and quantify individual phenolic compounds as major bioactive components present in honey, (iii) to determine the antioxidant activity of honey samples, and (iv) to determine their antibacterial activity against reference strains and clinical isolates. The overall goal was to compare different types of Spanish honey to select one that shows the best properties for potential therapeutic applications.
■
MATERIALS AND METHODSChemicals. Acetonitrile, acetic acid, formic acid, methanol, sodium carbonate, hydrochloric acid, and metaphosphoric acid were supplied by VWR Chemicals-Prolabo (VWR International). 2,2-Diphenyl-1-picrylhydrazyl (DPPH•
), 2,6-dichloroindophenol, caffeic
and gallic acids, flavonoid standards (rutin, quercetin, chrysin, and
catechin), aluminum chloride, ferric chloride, and potassium ferricyanide were supplied by Sigma (St. Louis, MO, USA). All other chemicals were obtained from Merck (Darmstadt, Germany). All solvents were of analytical grade purity except for methanol, formic acid, and acetonitrile used in the identification and
quantification of individual polyphenols, which were HPLC grade.
Water was treated in a Milli-Q water purification system (Millipore,
Molsheim, France).
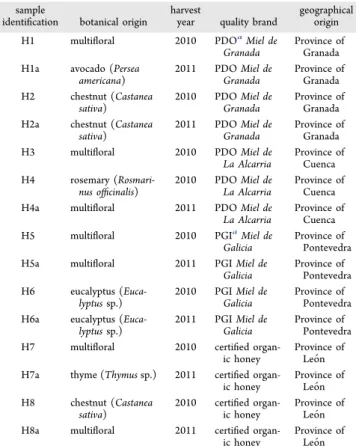
Honey Samples.Fifteen samples of Spanish honey under quality brands (protected designation of originMiel de GranadaandMiel de
La Alcarria, protected geographical indication Miel de Galicia and
organic honey) with different botanical and geographical origins, as
well as an MkH sample (MGO 550+; Manuka Health, Auckland, New Zealand), as a control sample, were used. Spanish honey samples, collected in two consecutive harvests, were previously characterized.12
Table 1 summarizes the information related to botanical and geographical origin of honey samples, as well as the harvest year.
The samples were stored under dark conditions and refrigeration until analysis (few months after harvesting). They were homogenized by agitation before each determination.
Bioactive Compound Quantification. Vitamin C Content. Ascorbic acid (AA) content was determined following the recommended AOAC Official Titrimetric Method 967.21 for ascorbic
acid in vitamin preparations and juices.13A 5 g portion of each sample
was diluted in 5 mL of metaphosphoric acid acetic acid solution. The mixture was titrated with 2,6- dichloroindophenol dye solution. Vitamin C content was expressed in milligrams of ascorbic acid equivalents (AAE) per 100 g of honey.
Total Phenolic Content. Total phenolic content (TPC) was quantified by the Folin−Ciocalteu method according to Silici, Sagdic,
and Ekici.14Absorbance was measured at 765 nm after 90 min of incubation at room temperature (UV−vis spectrophotometer; VWR UV-3100 PC). TPC was determined using a standard curve (y = 32.08x+ 0.012;R2= 0.9996) of gallic acid (0−0.03 mg/mL). The
results were expressed as milligrams of gallic acid equivalents per 100 g of honey.
Total Flavonoid Content. Total flavonoid content (TFC) was
determined using the protocol described by Alvarez-Suarez et al.3A cadmium chloride solution was replaced by an aluminum chloride (AlCl3) solution (10% w/v). Absorbance was measured immediately
against the blank at 510 nm (UV−vis spectrophotometer; VWR
UV-3100 PC). TFC was determined using a standard curve (y= 10.99x+ 0.0052;R2= 0.9997) of (+)-catechin (0−0.03 mg/mL). The results were expressed as milligrams of catechin equivalents per 100 g of honey.
Identification and Quantification of Individual Polyphe-nols.The identification and quantification of phenolic compounds
were carried out following the protocol described by Truchado, Ferreres, and Tomas-Barberá ́n15with slight modifications.
Polyphenolic Extract Preparation. Honey samples (20 g) were fully dissolved in 8 parts of acidified deionized water (adjusted to pH
2 with HCl). The solutions were centrifuged at 5000 rpm for 10 min (Eppendorf 5804R), and the supernatant was applied to a Sep-Pak Classic C18cartridge (Waters, Medford, MA, USA) with a dropwise flow rate to ensure an efficient adsorption of the phenolic compounds.
Phenolic content was eluted with HPLC grade methanol (2 mL). This methanolic extract wasfiltered through a 0.45μmfilter (Waters)
and stored at−20°C until subsequent analysis by HPLC.
Identification and Quantification of Polyphenolic Compounds. HPLC analyses were performed using an Agilent 1100 HPLC system equipped with a photodiode-array UV−vis detector and an ion-trap mass spectrometer detector in series (Agilent Technologies, Waldbronn, Germany). Chromatographic separation was carried out on a reverse phase Poroshell120 C18column (250×3.0 mm and 5 μm particle size) (Agilent Technologies) using water with 1% of formic acid (A) and acetonitrile (B) as mobile phases. The gradient profile was as follows: 0−20 min, 5−30% B; 20−40 min, 30−70% B;
40−45 min, 70−95% B; 46−48 min, 95−5% B; maintained at 5% for 55 min. All analyses were carried out at room temperature, with an injected volume of 20μL and aflow rate of 1 mL/min. UV spectra
were recorded from 210 to 600 nm, whereas chromatograms were monitored at 280, 320, 340, and 360 nm wavelengths.
Table 1. Confirmed Botanical Origin, Year of Harvest, Quality Brand, and Geographical Origin of Spanish Honey Samples
sample
identification botanical origin
harvest
year quality brand geographicalorigin H1 multifloral 2010 PDOaMiel de
Granada Province ofGranada H1a avocado (Persea
americana) 2011 PDOGranadaMiel de
Province of Granada H2 chestnut (Castanea
sativa) 2010 PDOGranadaMiel de
Province of Granada H2a chestnut (Castanea
sativa) 2011 PDOGranadaMiel de
Province of Granada H3 multifloral 2010 PDOMiel de
La Alcarria
Province of Cuenca H4 rosemary (
Rosmari-nus officinalis) 2010 PDOLa AlcarriaMiel de
Province of Cuenca H4a multifloral 2011 PDOMiel de
La Alcarria
Province of Cuenca H5 multifloral 2010 PGIaMiel de
Galicia
Province of Pontevedra H5a multifloral 2011 PGIMiel de
Galicia
Province of Pontevedra H6 eucalyptus (
Euca-lyptussp.) 2010 PGI Miel de
Galicia Province ofPontevedra H6a eucalyptus (
Euca-lyptussp.) 2011 PGI Miel de
Galicia Province ofPontevedra H7 multifloral 2010 certified
organ-ic honey Province ofLeón H7a thyme (Thymussp.) 2011 certified
organ-ic honey Province ofLeón H8 chestnut (Castanea
sativa) 2010 certi
fied
organ-ic honey Province ofLeón H8a multifloral 2011 certified
organ-ic honey Province ofLeón aPDO, protected designation of origin; PGI, protected geographical
indication.
Journal of Agricultural and Food Chemistry Article
The HPLC system was coupled in series to an Esquire 1100 ion-trap mass spectrometer (IT) equipped with an electrospray ionization interface (ESI) (Bruker, Bremen, Germany) in negative mode. Nitrogen was used as a drying gas with a flow of 9 L/min and
temperature of 350°C and nebulizing gas at a pressure of 40 psi. The capillary voltage was set at 3500 V. Mass scan (MS) and daughter (MS−MS) spectra were recorded in the range ofm/z100−1500 with a control mass ofm/z700. The analyses were performed in duplicate. Honey phenolic acids andflavonoids were identified according to
their molecular weight (mass spectra), characteristic UV spectra, MS/ MS fragmentations, and the wide information previously reported in the literature. Hydroxybenzoic acids were quantified using UV
detection at 280 nm with the calibration curve obtained for gallic acid, hydroxycinnamic acids at 320 nm with the calibration curve obtained for caffeic acid, flavonols at 360 nm with the calibration
curve of quercetin,flavanones at 280 nm with the calibration curve of
naringenin, andflavones andflavonol glycosides at 340 nm with the
calibration curves of chrysin and rutin, respectively. Calibration parameters are shown inTable 2.
Antioxidant Activity. Radical Scavenging Activity Assay.The radical scavenging activity (RSA) of honey samples was evaluated using the DPPH radical scavenging assay following the protocol described by Ferreira, Aires, Barreira, and Estevinho.16 The
concentration of water honey solutions tested ranged between 0 and 0.67 g/mL. Radical scavenging activity was calculated as a percentage of DPPH discoloration using the equation % RSA = [(ADPPH −AS)/ADPPH] ×100. The extract concentration providing
50% of radical scavenging activity (EC50) was calculated by
interpolation from the graph of RSA percentage against extract concentration.
Reducing Potential Assay.The ferric reduction power (RP) was evaluated using the protocol described by Ferreira, Aires, Barreira, and Estevinho.16 The concentration of water honey solutions tested
ranged between 0 and 0.11 g/mL. The extract concentration providing 0.5 of absorbance (EC50) was calculated by interpolation
from the graph of absorbance at 700 nm against extract concentration. Inhibition ofβ-Carotene Bleaching Assay.The inhibition of β -carotene bleaching by honey samples was evaluated following the protocol described by Guerrini et al.17with slight modifications. A 4
mL portion ofβ-carotene in chloroform solution (0.2 mg/mL) was pipetted into a round-bottomflask containing 80μL of linoleic acid
and 800μL of Tween 40 as emulsifier. The mixture was shaken, and
chloroform was removed at 40°C under vacuum. A 200 mL portion of distilled water, previously swamped in O2, was added to theflask,
which was vigorously shaken. Aliquots of 4.8 mL of this emulsion were transferred into different test tubes containing 0.2 mL of 300
mg/mL water−honey solutions. The tubes were shaken and incubated in darkness at 55°C. The absorbance was measured at 470 nm (VWR UV-3100 PC) at the moment of emulsion addition and after 120 min. An emulsion without β-carotene was used as a control. The antioxidant activity (AA) expressed as a percentage of inhibition ofβ-carotene oxidation was calculated using the equation AA = [100(DRC− DRS)]/DRC;where DRC = ln(a/b)/120 is the
percentage of degradation ofβ-carotene in the control and DRS =
ln(a/b)/120 is the percentage degradation of β-carotene in honey
Table 2. Calibration Parameters for Phenolic Acids and Flavonoids Used As Standards (mg/mL) and Compound Class To Be Quantified by Each Standard
compound linearity range equation R2 LODa LOQa group to be quantified
gallic acid 0.01−0.30 y= 49.39x 0.999 0.02 0.05 hydroxybenzoic acids
caffeic acid 0.002−0.20 y= 146.82x 0.999 0.01 0.03 hydroxycinammic acids
quercetin 0.002−0.20 y= 62.66x 0.999 0.01 0.04 flavonols
naringenin 0.01−0.20 y= 50.84x 0.999 0.01 0.03 flavanonols andflavanones
chrysin 0.01−0.30 y= 43.01x 0.999 0.01 0.03 flavones
rutin 0.01−0.30 y= 69.31x 0.999 0.01 0.03 flavonol glycosides
aLOD, limit of detection in mg/mL; LOQ, limit of quantification in mg/mL.
Table 3. Ascorbic Acid, Total Phenolic Compounds, Total Flavonoids and Antioxidant Activity of Honey Samples (Mean SD;
n= 3)a
bioactive compounds antioxidant activity
honey sample AAEb TPCc TFCd radical scavenging activitye reducing potentialf β-carotene bleaching inhibitiong
H1 9.11±0.61b 158±5.37a 5.93±0.21a 9.25±0.32mn 26.3±1.29m 32.9±1.47ij
H1a 5.95±0.32cd 117±2.74d 3.30±0.08bc 13.8±0.07kl 30.3±0.04lm 56.9±0.99g
H2 3.64±0.30f 102±1.53ef 2.29±0.14cde 23.0±0.38h 55.3±1.49i 66.8±1.76ef
H2a 6.62±0.05bc 118±3.50cd 5.85±0.21a 9.83±0.07lm 43.0±1.30j 92.6±0.58ab
H3 2.41±0.18fg 67.9±1.48gh 4.06±0.04ab 38.0±0.45ef 34.7±0.70jk 58.4±1.40fg
H4 4.51±0.00d 23.1±0.83l 2.17±0.11defg 202±5.53a 215±1.81a 28.3±1.09jk
H4a 0.34±0.00k 27.7±1.45kl 2.02±0.19efgh 119±0.02ab 157±1.47ab 38.0±0.44hi
H5 1.35±0.11hi 67.5±2.65gh 1.95±0.15fgh 28.9±0.43fg 93.5±0.35ef 92.9±0.52a
H5a 0.88±0.00ij 56.6±0.29hi 1.89±0.14gh 28.2±1.24g 82.4±0.95fg 92.4±0.28ab
H6 0.34±0.00k 50.6±1.64j 1.65±0.11h 55.9±0.35cd 111±1.02de 71.8±1.13de
H6a 0.35±0.00k 50.5±1.69j 1.83±0.22efgh 74.1±0.84bc 118±0.16cd 82.1±0.17bc
H7 0.34±0.00k 51.3±2.80ij 2.25±0.11cdef 54.0±0.81de 147±4.51bc 68.1±0.86ef
H7a 75.9±0.41a 136±2.50bc 2.06±0.22abc 5.46±0.05n 54.1±0.64i −1.34±0.10k
H8 3.61±0.18ef 142±4.70ab 2.97±0.19bcd 21.6±0.33ij 72.0±0.78gh 31.9±1.51ij
H8a 4.22±0.32de 114±4.23de 3.87±0.04efgh 15.1±0.25jk 63.7±0.16h 78.4±0.84cd
MkH 2.19±0.13gh 101±1.92fg 4.76±0.26ab 22.6±0.50hi 32.8±0.33kl 43.9±0.91gh
aIn each column different letters mean significant differences (p< 0.05).bAAE: ascorbic acid equivalents (mg per 100 g of honey).cTPC: total phenolic content equivalents of gallic acid (mg per 100 g of honey).dTFC: totalflavonoids content equivalents of catechin (mg per 100 g of honey).eEC
50: extract concentration (mg/mL) providing 50% of radical scavenging activity.fEC50: extract concentration (mg/mL) providing 0.5
of absorbance.gAntioxidant activity: percentage of inhibition ofβ-carotene oxidation.
Journal of Agricultural and Food Chemistry Article
samples:a= absorbance at time 0;b= absorbance after 120 min of incubation.
Antibacterial Activity. Bacterial Strains, Drug Susceptibility, and Growth Conditions.Staphylococcus aureus,Streptococcus pyogenes,
Escherichia coli, and Pseudomonas aeruginosa as the main bacteria
isolated from the oropharynx of patients suffering from oral mucositis
(University Assistance Complex of León, Spain), as well as strains of these species from the Spanish Type Culture Collection (S. aureus CECT 86,S. pyogenesCECT 985,E. coliCECT 515 andP. aeruginosa
CECT 110) were used. Clinical bacteria were identified using a
MicroScan panel by Siemens (Camberley, U.K.).
The susceptibility of bacteria to different antibiotics was assessed
by a plate microdilution method or a disk−plate diffusion method.
Breakpoints were determined according to values defined by the
Clinical and Laboratory Standards Institute.18 Clinical strains, excludingS. pyogenes, exhibited resistance to several antibiotics tested.
S. aureus was a methicillin-resistant strain (MRSA), E. coli was a
Table 4. Peak Numbers, Target Compounds, Average Expected Retention Times (R
t), and UV and MS Spectra of the Different
Phenolic Compounds Identified in Honey Samples
peak no. compound name Rt(min) UVmax(nm) [M−H]−(m/z) −MSn(m/z)
1 UI 1 8.45 306 sh, 316, 328 sh 188 144
2 UI 2 10.29 318 sh, 330 188 144
3 kynurenic acid 10.77 308, 332, 335 sh, 340 sh 188 144
4 caffeic acid 11.59 238, 296 sh, 322 179 161, 135
5 leptosperin 11.84 266, 296 sh 581 323, 211
6 quercetin-3-O-hex (1→2) hexa 13.92 259, 265 sh, 299 sh, 355 625 445, 301
7 8-methoxykaempferol-3-O- hex (1→2) hexa 14.87 639 624, 459, 315
8 kaempferol-3-O-hex (1→2) hexa 15.39 265, 296 sh, 349 609 447, 429, 285
9 trans-cinnamic acid 15.75 276 147 119, 103
10 8-O-methoxykaempferol-3-O-neoha 15.97 310 sh, 324, 362 sh 623 608, 459, 315
11 quercertin-3-O-rutinoside 16.25 258, 260 sh, 291 sh, 349 609 301
12 ellagic acid 16.50 253, 367 301 301, 257, 229
13 kaempferol-3-O-neoha 16.62 248, 262 sh, 298 sh, 326 593 429, 285
14 4-methoxyphenyllactic acid 16.70 274 195 177, 149
15 UI 3 16.73 298 sh, 309, 319 sh 144 133
16 isorhamnetin-3-O-neoha 16.83 623 459, 315
17 Chlorogenic acid 18.40 298, 328 353 191, 179
18 isorhamnetin-O-pentoside 18.97 253, 346 447 315, 300
19 rosmarinic acid 20.23 294, 329 359 329, 286, 234
20 myricetin 20.30 255, 267 sh, 301 sh, 375 317 179, 151
21 tricetin 21.07 248, 267 sh, 302 sh, 351 301 151
22 methyl syringate 21.30 274 211 181
23 quercetin-3-O-rhama 21.63 447 301
24 trans,trans-abscisic acid 21.87 266 263 219, 201
25 cis,trans-abscisic acid 23.52 266 263 219, 201
26 quercetin 24.46 255, 370 301 179, 151, 121
27 naringenin 7-methyl ether 25.25 288, 320 sh 285 267, 252, 239
28 pinobanksin-5-methyl ether 25.31 286 285 267, 252, 239
29 quercetin 3-methyl ether 25.70 256, 355 315 300, 271, 255
30 p-coumaric acid isoprenil ester 26.42 294, 310 231 163, 119
31 pinobanksin 27.42 292 271 253, 225, 151
32 kaempferol 27.72 266, 370 285 161, 151, 135
33 isorhamnetin 28.37 253, 370 315 300, 151, 107
34 kaempferol methyl ether 28.79 265, 352 299 284
35 kaempferide 28.80 265, 364 299 284, 228, 212, 151, 132
36 quercetin 3,3-dimethyl ether 29.43 253, 355 329 314, 299, 285, 271
37 rhamnetin 30.94 256, 367 315 300, 165, 121
38 quercetin 3,7-dimethyl ether 32.00 256, 355 329 314, 299, 285
39 caffeic acid isoprenyl ester 32.83 298, 325 247 179, 135
40 caffeic acid benzyl ester 33.17 298, 325 269 178, 161, 134
41 chrysin 33.31 268, 314 sh 253 181, 151, 101
42 pinocembrin 33.57 289 255 213, 211, 151
43 galangin 34.03 265, 360 269 269, 241, 151
44 caffeic acid phenylethyl ester 34.24 295, 325 283 179, 135
45 6-methoxychrysin 35.08 265, 300 sh, 346 sh 283 268, 239, 211
46 galangin 5-methyl ether isomer 35.11 266, 302 sh, 360 283 268, 239
47 caffeic acid cinnamyl ester 36.05 295, 324 295 178, 134
48 pinobanksin-3-O-butyrate or isomer 39.28 292 341 271, 253
49 pinobanksin-3-O-pentenoate or isomer 41.43 292 353 271, 253
ahex (1
→2) hex, hexosyl (1→2) hexoside; neoh, neohesperidoside; rham, rhamnoside.
Journal of Agricultural and Food Chemistry Article
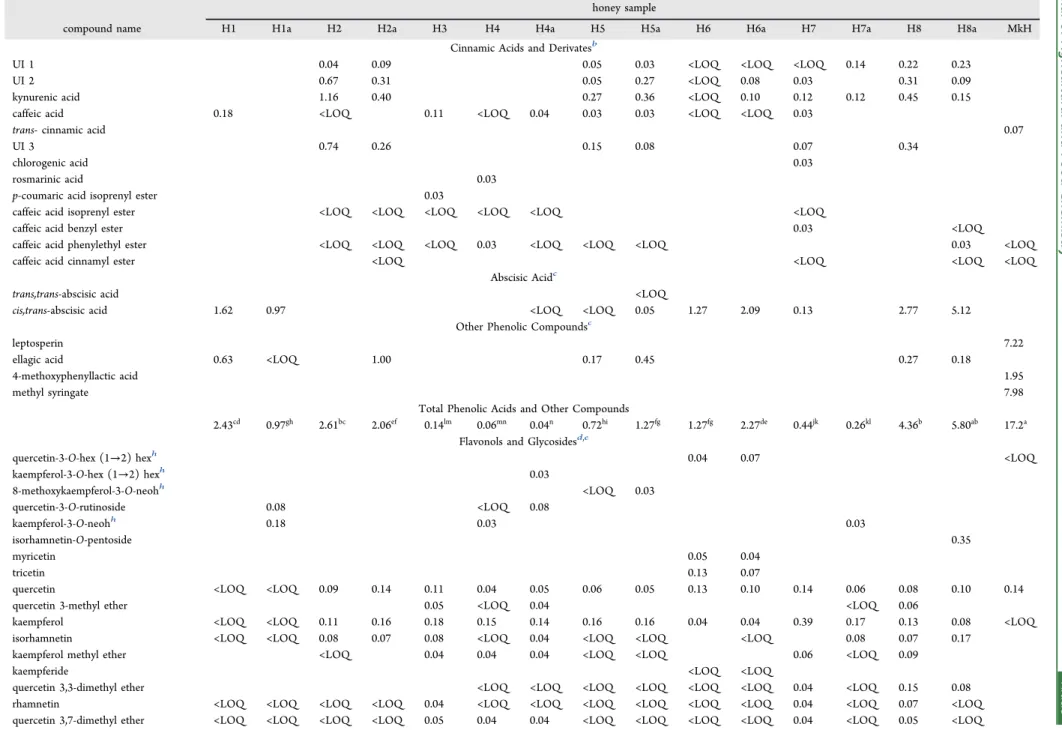
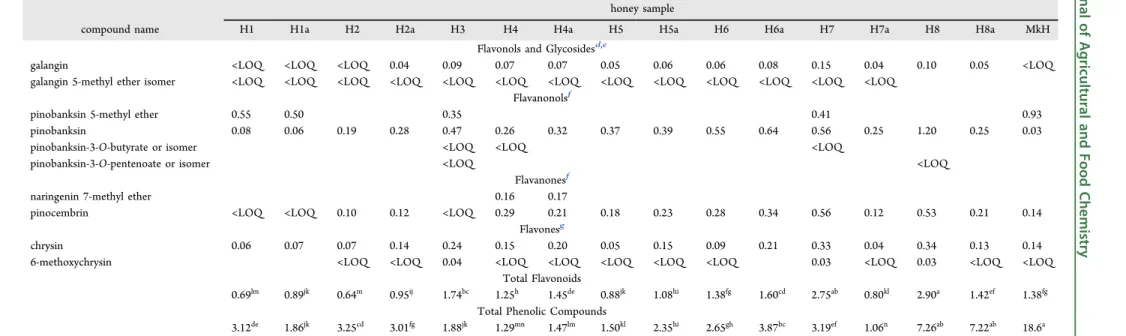
Table 5. Phenolic Compounds and Abscisic Acid Contents (mg/100 g Honey) in the Different Honey Samples Studieda
honey sample
compound name H1 H1a H2 H2a H3 H4 H4a H5 H5a H6 H6a H7 H7a H8 H8a MkH
Cinnamic Acids and Derivatesb
UI 1 0.04 0.09 0.05 0.03 <LOQ <LOQ <LOQ 0.14 0.22 0.23
UI 2 0.67 0.31 0.05 0.27 <LOQ 0.08 0.03 0.31 0.09
kynurenic acid 1.16 0.40 0.27 0.36 <LOQ 0.10 0.12 0.12 0.45 0.15
caffeic acid 0.18 <LOQ 0.11 <LOQ 0.04 0.03 0.03 <LOQ <LOQ 0.03
trans- cinnamic acid 0.07
UI 3 0.74 0.26 0.15 0.08 0.07 0.34
chlorogenic acid 0.03
rosmarinic acid 0.03
p-coumaric acid isoprenyl ester 0.03
caffeic acid isoprenyl ester <LOQ <LOQ <LOQ <LOQ <LOQ <LOQ
caffeic acid benzyl ester 0.03 <LOQ
caffeic acid phenylethyl ester <LOQ <LOQ <LOQ 0.03 <LOQ <LOQ <LOQ 0.03 <LOQ
caffeic acid cinnamyl ester <LOQ <LOQ <LOQ <LOQ
Abscisic Acidc
trans,trans-abscisic acid <LOQ
cis,trans-abscisic acid 1.62 0.97 <LOQ <LOQ 0.05 1.27 2.09 0.13 2.77 5.12 Other Phenolic Compoundsc
leptosperin 7.22
ellagic acid 0.63 <LOQ 1.00 0.17 0.45 0.27 0.18
4-methoxyphenyllactic acid 1.95
methyl syringate 7.98
Total Phenolic Acids and Other Compounds
2.43cd 0.97gh 2.61bc 2.06ef 0.14lm 0.06mn 0.04n 0.72hi 1.27fg 1.27fg 2.27de 0.44jk 0.26kl 4.36b 5.80ab 17.2a
Flavonols and Glycosidesd,e
quercetin-3-O-hex (1→2) hexh 0.04 0.07 <LOQ
kaempferol-3-O-hex (1→2) hexh 0.03
8-methoxykaempferol-3-O-neohh <LOQ 0.03
quercetin-3-O-rutinoside 0.08 <LOQ 0.08
kaempferol-3-O-neohh 0.18 0.03 0.03
isorhamnetin-O-pentoside 0.35
myricetin 0.05 0.04
tricetin 0.13 0.07
quercetin <LOQ <LOQ 0.09 0.14 0.11 0.04 0.05 0.06 0.05 0.13 0.10 0.14 0.06 0.08 0.10 0.14
quercetin 3-methyl ether 0.05 <LOQ 0.04 <LOQ 0.06
kaempferol <LOQ <LOQ 0.11 0.16 0.18 0.15 0.14 0.16 0.16 0.04 0.04 0.39 0.17 0.13 0.08 <LOQ isorhamnetin <LOQ <LOQ 0.08 0.07 0.08 <LOQ 0.04 <LOQ <LOQ <LOQ 0.08 0.07 0.17
kaempferol methyl ether <LOQ 0.04 0.04 0.04 <LOQ <LOQ 0.06 <LOQ 0.09
kaempferide <LOQ <LOQ
quercetin 3,3-dimethyl ether <LOQ <LOQ <LOQ <LOQ <LOQ <LOQ 0.04 <LOQ 0.15 0.08 rhamnetin <LOQ <LOQ <LOQ <LOQ 0.04 <LOQ <LOQ <LOQ <LOQ <LOQ <LOQ 0.04 <LOQ 0.07 <LOQ quercetin 3,7-dimethyl ether <LOQ <LOQ <LOQ <LOQ 0.05 0.04 0.04 <LOQ <LOQ <LOQ <LOQ 0.04 <LOQ 0.05 <LOQ
Journal
of
Agricultural
and
Food
Chemistry
Article
DOI:
10.1021/acs.jafc.8b05436
J.
Agric.
Food
Chem.
2019,
67,
688
−
698
Table 5. continued
honey sample
compound name H1 H1a H2 H2a H3 H4 H4a H5 H5a H6 H6a H7 H7a H8 H8a MkH
Flavonols and Glycosidesd,e
galangin <LOQ <LOQ <LOQ 0.04 0.09 0.07 0.07 0.05 0.06 0.06 0.08 0.15 0.04 0.10 0.05 <LOQ galangin 5-methyl ether isomer <LOQ <LOQ <LOQ <LOQ <LOQ <LOQ <LOQ <LOQ <LOQ <LOQ <LOQ <LOQ <LOQ
Flavanonolsf
pinobanksin 5-methyl ether 0.55 0.50 0.35 0.41 0.93
pinobanksin 0.08 0.06 0.19 0.28 0.47 0.26 0.32 0.37 0.39 0.55 0.64 0.56 0.25 1.20 0.25 0.03
pinobanksin-3-O-butyrate or isomer <LOQ <LOQ <LOQ
pinobanksin-3-O-pentenoate or isomer <LOQ <LOQ
Flavanonesf
naringenin 7-methyl ether 0.16 0.17
pinocembrin <LOQ <LOQ 0.10 0.12 <LOQ 0.29 0.21 0.18 0.23 0.28 0.34 0.56 0.12 0.53 0.21 0.14 Flavonesg
chrysin 0.06 0.07 0.07 0.14 0.24 0.15 0.20 0.05 0.15 0.09 0.21 0.33 0.04 0.34 0.13 0.14
6-methoxychrysin <LOQ <LOQ 0.04 <LOQ <LOQ <LOQ <LOQ <LOQ 0.03 <LOQ 0.03 <LOQ <LOQ Total Flavonoids
0.69lm 0.89jk 0.64m 0.95ij 1.74bc 1.25h 1.45de 0.88jk 1.08hi 1.38fg 1.60cd 2.75ab 0.80kl 2.90a 1.42ef 1.38fg
Total Phenolic Compounds
3.12de 1.86jk 3.25cd 3.01fg 1.88jk 1.29mn 1.47lm 1.50kl 2.35hi 2.65gh 3.87bc 3.19ef 1.06n 7.26ab 7.22ab 18.6a aDifferent letters in the same line indicate significantly different values (p< 0.05).bCalculated using the calibration curve of caffeic acid atλ320 nm.cCalculated using the calibration curve of gallic acid
atλ280 nm.dFlavonols were calculated using the calibration curve of quercetin atλ360 nm.eFlavonol glycosides were calculated using the calibration curve of rutin atλ340 nm.fCalculated using the calibration curve of naringenin atλ280 nm.gCalculated using the calibration curve of chrysin atλ340 nm.hhex (1→2) hex, hexosyl (1→2) hexoide; neoh, neohesperidoside; rham, rhamnoside.
Journal
of
Agricultural
and
Food
Chemistry
Article
DOI:
10.1021/acs.jafc.8b05436
J.
Agric.
Food
Chem.
2019,
67,
688
−
698
producer ofβ-lactamases, andP. aeruginosashowed resistance against 9 of 14 antibiotics tested (Supporting Information).
All bacteria were grown in Mueller Hinton broth (MH; Sigma-Aldrich, St. Louis, MO, USA) at 37°C with shaking (180 rpm) until the exponential growth phase (JP Selecta, Barcelona, Spain). Prior to experiments, bacteria were subcultured twice in MH agar to ensure the purity of cultures.
Honey Susceptibility. The minimal inhibitory concentration (MIC) was determined according to the M07-A9 protocol.18
Honey concentrations between 400 and 6.25 mg/mL were tested. MIC values were defined after 24 and 48 h of incubation. MIC was
the lowest concentration that prevented any discernible growth. The minimal lethal concentration (MLC) was also determined by inoculating on MH agar plates 20μL of each concentration tested from 96-well microtiter plates in which no growth was observed. MLC was defined as the lowest concentration that prevented any bacterial
growth and reduced the viability of the initial inoculum by at least 99.9%. The tests were carried out in triplicate.
Statistical Analyses. Statistical analysis was performed using different packages (car, HH, agricolae, psych) of the open source
statistical program R (version 3.3.3).19All variables were tested for
the assumptions of normality and homoscedasticity. A Kruskal−Wallis test applying Bonferroni correction was utilized to compare the results between samples. p < 0.05 was considered to be significant. In
addition, Spearman’s correlation coefficient in bivariate linear
correlations was used to study the relationship between bioactive compounds and bioactivity.
■
RESULTS AND DISCUSSIONBioactive Compound Quantification (Vitamin C, TPC and TFC).The main bioactive compounds were quantified in the different honey samples. Vitamin C in honey comes essentially from nectar or honeydew and pollen, whereas phenolic compounds come from propolis in addition to nectar and pollen.20 Thus, depending on honey botanical and geographical sources, bioactive compounds content might fluctuate considerably, as hereby reported (Table 3).
Vitamin C was detected in all honey samples. However, contents deeply differed among them, ranging from 0.34 to 75.9 mg/100 g of honey (p < 0.001). Sample H7a, a thyme honey, registered significantly higher values of AA, which corroborates that described in previous studies for this variety of honey.21On the other hand, two eucalyptus (H6 and H6a) and two polyfloral honey samples (H4a and H7) showed the lowest contents.
Similarly, the amounts of TPC and TFC varied considerably among samples (p < 0.001). TPC ranged between 23.1 and 158 mg/100 g of honey and TFC between 1.65 and 5.93 mg/ 100 g of honey. H1, a polyfloral honey, presented the highest values for both TPC and TFC, but in not all cases were the two parameters correlated. The lowest values of TPC and TFC were found in eucalyptus honey (H6 and H6a).
In addition, it is important to take into account that although the Folin−Ciocalteu assay is widely used to determine TPC in food extracts, it is not specific for phenolic quantification, considering that other types of compounds present in honey such as reducing sugars and amino acids can also reduce the Folin−Ciocalteu reagent.22 In the present study a correction factor for interfering substances in the determination of TPC was not used because sugars, as principal interaction components in honey, present low solubility in methanol.23 Nevertheless, it is necessary to consider that TPC determined may have values higher than the real ones. Similar circumstances occur with TFC; results may show an overestimation as some nonflavonoid compounds
can exhibit absorbance at 510 nm.22 However, despite the limitations posed, these methods allow a rapid and estimated evaluation of the availability of these compounds and their potential antioxidant activity.24
Identification and Quantification of Individual Poly-phenols.Characterization of phenolic compounds and other bioactive components in honey intended for medical uses is essential, since these minor substances might be responsible for many of their health protective effects.3
The HPLC-ESI/MS analysis of honey extracts permitted identifcation of 49 different phenolic compounds on the basis of their UV and mass spectra and their MS/MS fragmentations
(Table 4). However, only 46 of these were quantified due to
some compounds coeluting under a single chromatographic peak with the same retention time (Table 5).
Cinnamic acids and their derivatives were the main phenolic acids found. Three compounds (UI 1, UI 2, and UI 3) were considered unknown but were tentatively identified. UI 3 (UV spectrum 319 sh, 309, 298 sh nm; MSm/z144; MS2m/z133)
was previously described by Tomas-Barberá ́n, Martos, Ferreres, Radovic, and Anklam25 as marker of chestnut honey. UI 1 (UV spectrum 328 sh, 316, 306 sh nm; MSm/
z188; MS2m/z144) and UI 2 (UV spectrum 330, 318 sh nm;
MS m/z 188; MS2 m/z 144) compounds are probably
kynurenic acid derivatives in view of the similarities among the UV spectra and MS fragmentations of the three compounds (Table 4). Interestingly, the samples in which
Castanea sativa was the predominant or secondary pollen (samples H2, H2a, H5, H5a, H8, and H8a), presented higher amounts of UI 1, UI 2, and UI 3, as well as kynurenic acid, which suggests the relationship between these compounds and a chestnut source. Furthermore, both isomers of abscisic acid previously described in other varieties of honey26 were detected but onlycis,trans-abscisic acid could be quantified in some samples. Other phenolic compounds, characteristic of MkH, as well as ellagic acid were identified.
Concerning flavonoids, four subclasses of compounds were discriminated:flavonols, flavanonols,flavanones, and flavones, as well as some flavonol glycosides mainly from quercetin, kaempferol, isorhamnetin, and 8-methoxykaempferol, which were previously described in different types of honey.15 Moreover, specific floral markers were found in monofloral samples: myricetin and tricetin in eucalyptus honey,15 kaempferol and derivatives in rosemary honey,25 kynurenic acid in chestnut honey,27 and leptosperin, 4-methoxyphenyl-lactic acid, and methyl syringate in MkH.28
The wide variability of honey samples was reflected in the phenolic profiles (Table 5). MkH was very different from the rest, and among other honey samples only eight compounds (quercetin, kaempferol, rhamnetin, quercetin 3,7-dimethyl ether, galangin, pinobanksin, pinocembrin, and chrysin) were common to all of them, as could be expected from their propolis origin and presence in beeswax. Furthermore, results evidenced three types of honey samples: those characterized by profiles dominated by phenolic acids (H1, H2, H2a, H8, H8a, and MkH in which phenolic acids represent between 60.1 and 92.6% of total phenolic compounds quantified), others in which flavonoids prevailed (H3, H4, H4a, H7, and H7a, in which flavonoids represent between 67.6 and 97.3% of total phenolic compounds quantified), and finally, those in which none of these compounds stood out (H1a, H5, H5a, H6, and H6a, in which phenolic acids andflavonoids represent around 50% of total phenolic compounds quantified).
Journal of Agricultural and Food Chemistry Article
Table 6. Minimal Inhibitory Concentrations (MIC) and Minimal Lethal Concentrations (MLC) (g/mL) of Honey Samples against Reference and Clinical Strains of Bacteriaa
Gram-positive bacteria Gram-negative bacteria
SA CECT86 MRSA SP CECT985 SP clinical EC CECT515 EC clinical PA CECT110 PA clinical statistical analysisb
MIC MLC MIC MLC MIC MLC MIC MLC MIC MLC MIC MLC MIC MLC MIC MLC R/C G+/G− [M]
H1 0.10 0.20 0.20 0.20 0.20 0.20 0.20 0.20 0.25 0.25 0.20 0.20 0.20 0.25 0.20 0.20 NS NS NS
H1a 0.05 0.05 0.10 0.10 0.20 0.20 0.20 0.20 0.20 0.20 0.10 0.10 0.20 0.20 0.20 0.20 NS NS NS
H2 0.05 0.05 0.10 0.10 0.20 0.20 0.20 0.20 0.20 0.20 0.10 0.10 0.20 0.20 0.10 0.10 NS NS NS
H2a 0.10 0.10 0.10 0.10 0.20 0.20 0.25 0.25 0.20 0.20 0.20 0.20 0.20 0.20 0.20 0.20 NS NS NS
H3 0.25 0.25 0.25 0.25 0.20 0.20 0.20 0.20 0.30 0.30 0.25 0.30 0.25 0.25 0.25 0.25 NS * NS
H4 0.25 0.30 0.20 0.20 0.25 0.25 0.20 0.30 0.30 0.30 0.25 0.25 0.30 0.35 0.25 0.25 NS * NS
H4a 0.20 0.20 0.20 0.25 0.20 0.25 0.20 0.25 0.30 0.30 0.25 0.30 0.30 0.30 0.25 0.25 NS * NS
H5 0.20 0.20 0.25 0.25 0.20 0.20 0.20 0.20 0.35 0.35 0.25 0.25 0.25 0.25 0.25 0.25 NS ** NS
H5a 0.10 0.10 0.10 0.10 0.20 0.20 0.20 0.20 0.20 0.20 0.20 0.20 0.20 0.20 0.20 0.20 NS * NS
H6 0.10 0.10 0.10 0.10 0.20 0.20 0.20 0.20 0.20 0.20 0.20 0.20 0.20 0.30 0.20 0.20 NS * NS
H6a 0.10 0.20 0.10 0.10 0.20 0.20 0.20 0.20 0.20 0.20 0.20 0.20 0.20 0.20 0.20 0.20 NS NS NS
H7 0.10 0.10 0.25 0.25 0.20 0.20 0.20 0.20 0.20 0.20 0.25 0.25 0.20 0.20 0.25 0.25 NS NS NS
H7a 0.20 0.20 0.20 0.20 0.20 0.25 0.25 0.25 0.35 0.40 0.30 0.35 0.25 0.35 0.25 0.25 NS ** NS
H8 0.10 0.10 0.10 0.10 0.20 0.20 0.20 0.25 0.20 0.20 0.10 0.20 0.20 0.20 0.20 0.20 NS NS NS
H8a 0.05 0.05 0.05 0.05 0.10 0.20 0.20 0.20 0.10 0.10 0.10 0.20 0.10 0.10 0.10 0.10 NS NS NS
MkH 0.10 0.10 0.10 0.10 0.20 0.20 0.20 0.20 0.20 0.20 0.20 0.20 0.20 0.20 0.20 0.20 NS * NS
aSA,Staphylococcus aureus; MRSA, methicillin resistantStaphylococcus aureus; SP,Streptococcus pyogenes; EC,Escherichia coli; PA,Pseudomonas aeruginosa.bR/C, reference strains vs clinical strains; G+/
G−
, Gram-positive bacteria vs Gram-negative bacteria; [M], MIC vs MLC; NS, no significant differences were observed;*,p< 0.05;**,p< 0.01;***,p< 0.001.
Journal
of
Agricultural
and
Food
Chemistry
Article
DOI:
10.1021/acs.jafc.8b05436
J.
Agric.
Food
Chem.
2019,
67,
688
−
698
The content of total phenolic compounds ranged between 1.06 and 18.6 mg/100 g of honey in H7a and MkH, respectively. No correlation between total content of phenolic compounds quantified by HPLC and Folin−Ciocalteu assay was observed. This disparity might be explained because not all phenolic compounds present in honey samples were identified and/or quantified by HPLC and quantification of TPC through a Folin−Ciocalteu assay is only an estimation which was probably overvalued.29
In addition to their antioxidant and free radical scavenging abilities, polyphenols possess anti-inflammation, modulation of signal transduction, antimicrobial, and antiproliferation activ-ities.30In addition to quantity, the specific phenolic profile may be a key factor, as particular polyphenols could function individually or act synergistically with other components to increase bioactive properties.10This standpoint highlights the importance of understanding the polyphenol composition of honey samples intended for medical uses.
Antioxidant Activity. Owing to the complex nature of matrix and involvement of multiple reaction characteristics and mechanisms, the antioxidant capacity of honey cannot be evaluated accurately by any single method. Therefore, a combination of assays will provide more information on the antioxidant properties.31,32 In the current study three spectrophotometric methods were used.
Regarding the RSA assay, the sample H7a displayed the lowest concentration able to scavenger 50% of the free radicals
(Table 3). The high concentration of vitamin C detected in
this honey sample could explain the greater activity observed. AA has been described as a reducing agent capable of rapidly catching several reactive oxygen and nitrogen species (ROS and RNS).30,33However, no correlation between AA and RSA was observed. The absence of linear relations between variables does not exclude the presence of other nonlinear associations. Moreover, considering phenolic quantification by HPLC, H7a was the sample with the lowest concentration, which suggests that vitamin C is responsible for the antioxidant effects.
Similarly, phenolic compounds (TPC and TFC) may elucidate the results regarding the RP assay. On their behalf, phenolic compounds are capable of scavenging free radicals through electron and proton transfer mechanisms, as much as chelating metals,30 which could explain the significant correlation observed between TPC and TFC with honey reducing capacity (R=−0.80,−0.64;p< 0.01, respectively). H1 was the sample that exhibited the highest values of TPC and TFC and likewise the best antioxidant activity in this assay. Conversely, in the β-carotene inhibition bleaching assay no correlation was observed with bioactive compounds. The difficulties infinding relationships between data may be due to the lipid/water matrix used, especially because of the emulsifier introduced in the system against phase separation. The emulsifier may change the antioxidant distribution in the emulsified medium, and in turn the antioxidant activity, making it more difficult to interpret the results. Moreover, emulsifiers form micelles, which may trap antioxidants in these self-assembled structures and carry them to the water phase.34 In this assay, samples H2a, H5, and H5a presented similarly high antioxidant activities (more than 90% inhibition). In contrast, the H7a sample, which presented the best results in the RSA assay, acted as a pro-oxidant. This performance is apparently due to the high content of AA detected in this sample, which indeed exhibited a negative correlation with the inhibition ofβ-carotene bleaching (R=−0.61;p< 0.05). The
pro-oxidant behavior of AA has been previously described30,35 as a result of the formation of an ascorbyl radical during the oxidation reaction.35
A correlation between TPC and antioxidant activity was observed, suggesting that phenolic compounds are some of the main species responsible for the antioxidant capacity of honey.33 However, for some samples, similar contents in TPC and TFC did not correspond to similar antioxidant capacities. This suggests that, although phenols remain the largest class of antioxidants found in nature, the overall antioxidant capacity of each sample results from the combined activity of other nonphenolic compounds.32
Among those compounds are proteins, amino acids, peptide inhibitors of oxidative enzymes, enzymes such as catalase or/ and glucose oxidase, and organic acids such as gluconic, citric, and malic that could act by chelating metals and thus favor the action of other antioxidants such as polyphenols.11,29 More-over, the antioxidant properties of melanoidins (high-molecular-weight polymers formed in the final stage of the Maillard reaction)36have been described. Finally, because of the complex composition of honey, the interactions among the different compounds with antioxidant capacity and the possible synergies between them can also play an important role in the overall antioxidant capacity.29,31,37
Different assays provided different results, since each test assessed diverse action mechanisms in which a great variety of phytochemicals take part.
Antibacterial Activity. Honey antibacterial activity is associated with its physicochemical properties, as much as multiple compounds originating from the nectar of plants, pollen, propolis, and from the honeybee itself.38 All honey samples exhibited antibacterial capacity against reference and clinical strains. However, effective concentrations ranged between 0.05 and 0.40 g/mL depending on honey variety and microorganism (Table 6).
Overall, S. aureus strains seemed to be the most sensitive bacteria, whereas E. coli strains were the most resistant. The outer membrane surrounding the peptidoglycan layer of Gram-negative bacteria offers a greater resistance to the entrance of antimicrobials.31,39 However, in the current study, significant differences between Gram-positive and Gram-negative bacteria were not observed for all samples. Being a water-soluble substance, is feasible that honey was capable of accessing the periplasmic space of the bacteria through the porins, which act as hydrophilic conduits, as happens with other water-soluble molecules such as lactic acid.39
Significant differences between clinical and reference strains were not observed (p> 0.05), suggesting that honey samples were effective even against drug-resistant bacteria. New therapeutic options against emerging multi-drug-resistant pathogens are necessary, even more considering that some common infections have recently become extremely difficult or even impossible to treat.40Due to its peculiarities, honey might be a good option,20,31 with little chance to resistance development by acting in a multifactorial way upon several bacteria target sites.41However, this natural substance remains underestimated in mainstream healthcare, in part due to the lack of comprehensive scientific evidence supporting its clinical use.2
Furthermore, honey samples exhibited not only bacterio-static but also bactericidal effects. MLC values were similar or slightly higher than MIC values, and no significant differences between the concentrations were observed (p> 0.05).
Journal of Agricultural and Food Chemistry Article
Honey antimicrobial activity has been related to phys-icochemical properties such as high osmolarity, low water activity, and acidity. Moreover, recent studies revealed that polyphenols are key components on antimicrobial effects of honey,10,32on their own or by reacting with H
2O2. Thereby,
benzoic acid can react with H2O2, resulting in peroxy acids,
which are more stable and powerful than hydrogen peroxide and are capable of producing bacteria DNA degradation.4,6 Conversely, in the present study no significant correlations between phenolic compounds and antibacterial activity were observed, as has been described in other studies.42,43 Honey compounds interact among themselves, displaying an additive, synergistic, or antagonistic activity7 which might not be explained by a simple linear relation.
To sum up, considering antioxidant activity, the honey samples with greatest potential were H1 and H2a, correspond-ing to a polyfloral and a chestnut honey, respectively. However, when the antibacterial capacity was analyzed, the best samples were H1a, H2, and H8a, corresponding to an avocado, a chestnut, and a polyfloral honey, respectively. Nevertheless, bioactivity needs to be understood as a combination of beneficial effects, and from this standpoint, H1a, H2, and H8a were the best samples; in addition to a greater antibacterial capacity, their antioxidant potential was appropriate. Although MkH bioactivity is well-known, in this study other varieties of honey were demonstrated to possess greater activity. Curiously, the phenolic profile seems to be a key factor, since honey samples with greater activity were not related with higher phenolic contents by HPLC, as occurred with H1a. No specific phenolic compounds have been described in avocado honey. Nevertheless, evidence encourages the study of possible markers characteristic of this variety, which could explain its higher bioactive functions.
Moreover, it is essential to underline that although polyfloral honey exhibited good bioactivity, its composition is even more variable than monofloral honeys due to the contribution, in different proportions, of several floral origins without any of them predominating. Not only the major but also a secondary floral source might considerably affect the composition and, consequently, bioactive properties.
Finally, considering that the potential therapeutic application of honey might result in dilution depending on the malady to treat, in vivo concentrations must be greater than those obtained as optimal in vitro, in order to maintain high levels of bioactive compounds in the lesion environment. For some drugs, cytotoxicity may then become a limitation, but this should not be an issue with honey, which could be used undiluted. Defining a correct posology for honey application will be essential for clinical success.
In conclusion, bioactive component contents and related bioactive activities among distinct varieties of honey were rather variable and depended primarily on their botanical origin, which confirms the initial hypothesis. The great variability observed reinforces the necessity to choose a proper type of honey for clinical application. Therefore, screening of a particular honey type composition, as well as its antioxidant and antimicrobial properties, is necessary prior to studies assessing in vivo the therapeutic potential of this natural product.
TPC and TFC provide a rapid and cheap estimation of phenolic compounds present in honey and their potential biological activity. However, these methods could overestimate phenolic content when other interference substances are
present; therefore, other techniques that are more precise, such as HPLC-MS, are mandatory. In addition, knowing the phenolic profile is essential in order to identify the association between specific phenolic compounds and particular bio-activity properties.
■
ASSOCIATED CONTENT*
S Supporting InformationThe Supporting Information is available free of charge on the
ACS Publications websiteat DOI:10.1021/acs.jafc.8b05436.
MIC values for different drugs against the bacteria tested (PDF)
■
AUTHOR INFORMATIONCorresponding Author
*J.M.F.-B.: e-mail,jmfreb@unileon.es; tel, +0034 987291850.
ORCID
Francisco A. Tomas-Barberá n:́ 0000-0002-0790-1739
JoséM. Fresno-Baro: 0000-0002-3438-0852
Funding
This work was supported by the Consejeria de Sanidad of́ Junta de Castilla y Leon (Spain); under grant GRS 551/A/10.́
P.C.-F. was funded by the Consejeria de Educació ́n of Junta de Castilla y Leon and European Social Fund.́
Notes
The authors declare no competingfinancial interest.
■
ACKNOWLEDGMENTSThe authors are grateful to Isabel Fernandez Natal (Chief of́
the Clinical Microbiology Service in the University Assistance Complex of León, Spain) for providing us the clinical strains used in this work and drug susceptibility information.
■
REFERENCES(1) Eteraf-Oskouei, T.; Najafi, M. Traditional and Modern Uses of Natural Honey in Human Diseases: A Review.Iran. J. Basic Med. Sci. 2013,16(6), 731−742.
(2) Carter, D. A.; Blair, S. E.; Cokcetin, N. N.; Bouzo, D.; Brooks, P.; Schothauer, R.; Harry, E. J. Therapeutic Manuka Honey: No Longer So Alternative.Front. Microbiol.2016,7, 569.
(3) Alvarez-Suarez, J. M.; Tulipani, S.; Díaz, D.; Estevez, Y.; Romandini, S.; Giampieri, F.; Damiani, E.; Astolfi, P.; Bompadre, S.; Battino, M. Antioxidant and Antimicrobial Capacity of Several Monofloral Cuban Honeys and Their Correlation with Color, Polyphenol Content and Other Chemical Compounds.Food Chem.
Toxicol.2010,48(8−9), 2490−2499.
(4) Oryan, A.; Alemzadeh, E.; Moshiri, A. Biological Properties and Therapeutic Activities of Honey in Wound Healing: A Narrative Review and Meta-Analysis.J. Tissue Viability2016,25, 98−118.
(5) Al-Waili, N. S.; Salom, K.; Butler, G.; Al Ghamdi, A. A. Honey and Microbial Infections: A Review Supporting the Use of Honey for Microbial Control.J. Med. Food2011,14(10), 1079−1096.
(6) Brudzynski, K.; Abubaker, K.; Miotto, D. Unraveling a Mechanism of Honey Antibacterial Action: Polyphenol/H2O2-Induced Oxidative Effect on Bacterial Cell Growth and on DNA Degradation.Food Chem.2012,133(2), 329−336.
(7) Kwakman, P. H. S.; Zaat, S. A. J. Antibacterial Components of Honey.IUBMB Life2012,64(1), 48−55.
(8) Bong, J.; Loomes, K. M.; Lin, B.; Stephens, J. M. New Approach: Chemical and Fluorescence Profiling of NZ Honeys. Food Chem.
2018,267, 355−367.
(9) Lin, B.; Loomes, K. M.; Prijic, G.; Schlothauer, R.; Stephens, J. M. Lepteridine as a Unique Fluorescent Marker for the Authentication of Manuka Honey.Food Chem.2017,225, 175−180.
Journal of Agricultural and Food Chemistry Article
(10) Fyfe, L.; Okoro, P.; Paterson, E.; Coyle, S.; McDougall, G. J. Compositional Analysis of Scottish Honeys with Antimicrobial Activity against Antibiotic-Resistant Bacteria Reveals Novel Anti-microbial Components.LWT - Food Sci. Technol.2017,79, 52−59.
(11) Hossen, M. S.; Ali, M. Y.; Jahurul, M. H. A.; Abdel-Daim, M. M.; Gan, S. H.; Khalil, M. I. Beneficial Roles of Honey Polyphenols against Some Human Degenerative Diseases: A Review.Pharmacol. Rep.2017,69(6), 1194−1205.
(12) Combarros-Fuertes, P.; Valencia-Barrera, R. M.; Estevinho, L. M.; Dias, L. G.; Castro, J. M.; Tornadijo, M. E.; Fresno, J. M. Spanish Honeys with Quality Brand: A Multivariate Approach to Phys-icochemical Parameters Microbiological Quality and Floral Origin.J.
Apic. Res.2018, 1.
(13) AOAC. Official Method 967.21. Ascorbic Acid in Vitamin Preparations and Juices, 18th ed.; AOAC International: Gaithersburg, MD, USA, 2006.
(14) Silici, S.; Sagdic, O.; Ekici, L. Total Phenolic Content, Antiradical, Antioxidant and Antimicrobial Activities of Rhododen-dron Honeys.Food Chem.2010,121(1), 238−243.
(15) Truchado, P.; Ferreres, F.; Tomas-Barberan, F. A. Liquid Chromatography−tandem Mass Spectrometry Reveals the Wide-spread Occurrence of Flavonoid Glycosides in Honey, and Their Potential as Floral Origin Markers. Adv. Sep. Methods Food Anal. 2009,1216(43), 7241−7248.
(16) Ferreira, I. C. F. R.; Aires, E.; Barreira, J.; Estevinho, L. M. Antioxidant Activity of Portuguese Honey Samples: Different Contributions of the Entire Honey and Phenolic Extract. Food
Chem.2009,114(4), 1438−1443.
(17) Guerrini, A.; Bruni, R.; Maietti, S.; Poli, F.; Rossi, D.; Paganetto, G.; Muzzoli, M.; Scalvenzi, L.; Sacchetti, G. Ecuadorian Stingless Bee (Meliponinae) Honey: A Chemical and Functional Profile of an Ancient Health Product. Food Chem. 2009,114 (4), 1413−1420.
(18) CLSI.Methods for Dilution Antimicrobial Susceptibility Tests for Bacteria That Grow Aerobically; Approved Standard, 9th ed.; CLSI Document M07-A9; Wayne, PA, 2012.
(19) R Core Team.R: A Language and Environment for Statistical Computing; R Foundation for Statistical Computing: Vienna, Austria, 2016.
(20) Da Silva, I. A. A.; Da Silva, T. M. S.; Camara, C. A.; Queiroz, N.; Magnani, M.; de Novais, J. S.; Soledade, L. E. B.; Lima, E. de O.; de Souza, A. L.; de Souza, A. G. Phenolic Profile, Antioxidant Activity and Palynological Analysis of Stingless Bee Honey from Amazonas, Northern Brazil.Food Chem.2013,141(4), 3552−3558.
(21) León-Ruiz, V.; Vera, S.; González-Porto, A. V.; San Andres, M.́
P. Vitamin C and Sugar Levels as Simple Markers for Discriminating Spanish Honey Sources.J. Food Sci.2011,76(3), C356−C361.
(22) Silva, K. D. R. R.; Sirasa, M. S. F. Antioxidant Properties of Selected Fruit Cultivars Grown in Sri Lanka.Food Chem.2018,238, 203−208.
(23) Montañes, F.; Olano, A.; Ibá ́ñez, E.; Fornari, T. Modeling Solubilities of Sugars in Alcohols Based on Original Experimental Data.AIChE J.2007,53(9), 2411−2418.
(24) Nguyen, H. T. L.; Panyoyai, N.; Paramita, V. D.; Mantri, N.; Kasapis, S. Physicochemical and Viscoelastic Properties of Honey from Medicinal Plants.Food Chem.2018,241, 143−149.
(25) Tomás-Barberán, F. A.; Martos, I.; Ferreres, F.; Radovic, B. S.; Anklam, E. HPLC Flavonoid Profiles as Markers for the Botanical Origin of European Unifloral Honeys.J. Sci. Food Agric.2001,81(5), 485−496.
(26) Ferreres, F.; Andrade, P.; Tomás-Barberán, F. A. Natural Occurrence of Abscisic Acid in Heather Honey and Floral Nectar.J.
Agric. Food Chem.1996,44(8), 2053−2056.
(27) Truchado, P.; Martos, I.; Bortolotti, L.; Sabatini, A. G.; Ferreres, F.; Tomas-Barberan, F. A. Use of Quinoline Alkaloids as Markers of the Floral Origin of Chestnut Honey.J. Agric. Food Chem. 2009,57(13), 5680−5686.
(28) Kato, Y.; Fujinaka, R.; Ishisaka, A.; Nitta, Y.; Kitamoto, N.; Takimoto, Y. Plausible Authentication of Manuka Honey and Related
Products by Measuring Leptosperin with Methyl Syringate.J. Agric.
Food Chem.2014,62(27), 6400−6407.
(29) Gheldof, N.; Engeseth, N. J. Antioxidant Capacity of Honeys from Various Floral Sources Based on the Determination of Oxygen Radical Absorbance Capacity and Inhibition of in Vitro Lipoprotein Oxidation in Human Serum Samples.J. Agric. Food Chem.2002,50 (10), 3050−3055.
(30) Oroian, M.; Escriche, I. Antioxidants: Characterization, Natural Sources, Extraction and Analysis.Food Res. Int.2015,74, 10−36.
(31) Tenore, G. C.; Ritieni, A.; Campiglia, P.; Novellino, E. Nutraceutical Potential of Monofloral Honeys Produced by the Sicilian Black Honeybees (Apis Mellifera Ssp. Sicula). Food Chem.
Toxicol.2012,50(6), 1955−1961.
(32) Sousa, J. M.; de Souza, E. L.; Marques, G.; Meireles, B.; de Magalhães Cordeiro, Â. T.; Gullon, B.; Pintado, M. M.; Magnani, M.́
Polyphenolic Profile and Antioxidant and Antibacterial Activities of Monofloral Honeys Produced by Meliponini in the Brazilian Semiarid Region.Food Res. Int.2016,84, 61−68.
(33) Perna, A.; Intaglietta, I.; Simonetti, A.; Gambacorta, E. A Comparative Study on Phenolic Profile, Vitamin C Content and Antioxidant Activity of Italian Honeys of Different Botanical Origin.
Int. J. Food Sci. Technol.2013,48(9), 1899−1908.
(34) Shahidi, F.; Zhong, Y. Measurement of Antioxidant Activity.J.
Funct. Foods2015,18, 757−781.
(35) Hassimotto, N. M. A.; Genovese, M. I.; Lajolo, F. M. Antioxidant Activity of Dietary Fruits, Vegetables, and Commercial Frozen Fruit Pulps.J. Agric. Food Chem.2005,53(8), 2928−2935.
(36) Brudzynski, K.; Miotto, D. Honey Melanoidins: Analysis of the Compositions of the High Molecular Weight Melanoidins Exhibiting Radical-Scavenging Activity.Food Chem.2011,127(3), 1023−1030. (37) Escuredo, O.; Míguez, M.; Fernandez-Gonzá ́lez, M.; Carmen Seijo, M. Nutritional Value and Antioxidant Activity of Honeys Produced in a European Atlantic Area.Food Chem.2013,138(2−3), 851−856.
(38) Salonen, A.; Virjamo, V.; Tammela, P.; Fauch, L.; Julkunen-Tiitto, R. Screening Bioactivity and Bioactive Constituents of Nordic Unifloral Honeys.Food Chem.2017,237, 214−224.
(39) Alakomi, H. L.; Skyttä, E.; Saarela, M.; Mattila-Sandholm, T.; Latva-Kala, K.; Helander, I. M. Lactic Acid Permeabilizes Gram-Negative Bacteria by Disrupting the Outer Membrane.Appl. Environ.
Microbiol.2000,66(5), 2001−2005.
(40) Prestinaci, F.; Pezzotti, P.; Pantosti, A. Antimicrobial Resistance: A Global Multifaceted Phenomenon. Pathog. Global
Health2015,109(7), 309−318.
(41) Cooper, R. A.; Jenkins, L.; Henriques, A. F. M.; Duggan, R. S.; Burton, N. F. Absence of Bacterial Resistance to Medical-Grade Manuka Honey. Eur. J. Clin. Microbiol. Infect. Dis. 2010, 29 (10), 1237−1241.
(42) Isidorov, V. A.; Bagan, R.; Bakier, S.; Swiecicka, I. Chemical Composition and Antimicrobial Activity of Polish Herbhoneys.Food
Chem.2015,171, 84−88.
(43) Lukasiewicz, M.; Kowalski, S.; Makarewicz, M. Antimicrobial an Antioxidant Activity of Selected Polish Herbhoneys.LWT - Food
Sci. Technol.2015,64(2), 547−553.
Journal of Agricultural and Food Chemistry Article