Grazing management in an integrated crop-livestock system: soybean
development and grain yield
1Manejo do pastejo em sistemas integrados de produção agropecuária:
desenvolvimento e rendimento de grãos de soja
Taise Robinson Kunrath2*, Paulo Cesar de Faccio Carvalho2, Mónica Cadenazzi3, Christian Bredemeier2 e
Ibanor Anghinoni2
ABSTRACT - Grazing livestock in integrated crop-livestock systems can cause impacts in the subsequent crop cycle.
Aiming to investigate how grazing could affect soybean, the 9th crop cycle of a pasture/soybean rotation was assessed. Treatments were grazing intensities (10, 20, 30 and 40 cm of sward height) applied since 2001 in a mixed of oat and annual ryegrass; and an additional no grazing area as control. Treatments were arranged in a completely randomized block design with three replicates. Grazing affected soybean population and the mass of individual nodules (P<0.05), while the number and mass of nodules per plant were similar (P>0.05). Soybean yield showed differences among treatments, but no difference was found between grazed and non-grazed areas. Grazing intensities impact the coverage and frequency of weeds (P>0.05). In conclusion, grazing intensity impacts different parameters of soybean yield and development, but only the grazing intensity of 10 cm can jeopardize the succeeding soybean crop.
Key words: Grazing management. Mixed crop-livestock system. Soybean yield components. Stocking rates.
RESUMO - Em Sistemas Integrados de Produção Agropecuária, a presença dos animais em pastejo pode provocar
alterações na produção das culturas subsequentes. Com o objetivo de verificar como diferentes manejos do pasto poderiam afetar o cultivo de soja, a 9ª fase de lavoura em rotação pecuária/lavoura foi avaliada. Os tratamentos foram intensidades de pastejo (10; 20; 30; 40 cm de altura do pasto), aplicados desde 2001, em pasto misto de aveia e azevém anual, além de área sem pastejo utilizada como testemunha. O delineamento experimental foi de blocos ao acaso, com três repetições. Houve diferença na população inicial de plantas e na massa do nódulo (P<0,05), porém, o número e a massa de nódulos por planta foi semelhante (P>0,05). O rendimento de soja foi diferente entre os tratamentos, porém, não houve diferença entre áreas pastejadas e não pastejadas. Houve diferença para cobertura e frequência de espécies indesejáveis entre tratamentos (P>0,05). Em conclusão, diferentes intensidades de pastejo afetam os parâmetros de rendimento e desenvolvimento da soja, mas apenas a intensidade de pastejo de 10 cm pode comprometer a safra de soja subsequente.
Palavras-chave: Manejo de pastagens. Integração Lavoura-Pecuária. Componentes de rendimento da soja. Carga animal.
DOI: 10.5935/1806-6690.20150049 * Autor para correspondência
1Recebido para publicação em 02/04/2014; aprovado em 07/02/2015
Part Master of Science dissertation of the first author in Forage Science, UFRGS
2Faculdade de Agronomia, Universidade Federal do Rio Grande do Sul/UFRGS, Avenida Bento Gonçalves, 7712, Agronomia, Porto Alegre-RS,
Brasil, 91.540-000, taiserk@gmail.com, paulocfc@ufrgs.br, cbredemeier@gmail.com, ibanghi@ufrgs.br
3Departamento Biometria, Estadistica y Computación, Universidad de La República/EEMAC, Ruta 3 km 363, Paysandú-Uruguay,
INTRODUCTION
The term integrated crop-livestock (ICL) is commonly used to describe the rotation of annual grain crops and grazed grass and/or legumes pastures. Pasture can function as ground cover and be used for animal feeding, allowing to a more use efficient of farmland area and, as a consequence, of natural resources. According to Russelle, Entz and Franzluebbers, (2007), ICL have several advantages when compared to a traditional production system, enhancing both profitability and environmental sustainability of their farms and communities.
In order to reach long term sustainability in ICL systems, the maintenance of high system efficiency depends on the equilibrium between grain and livestock production, instead of aiming the maximization of
each component, individually (LOPESet al., 2009). It
is worth noting the challenge of finding the adequate pasture management to ensure satisfactory animal performance and the maintenance, at the same time, of sufficient residue (straw) to meet subsequent grain production and requirements of no-tillage (NT).
Farmers reluctance to adopt ICL is based on the risk of soil compaction caused by livestock trampling during the pasture cycle, which could limit crop root growth and grain yield. Suitable stocking rate and grazing management during pasture cycle prevents damages,
which is a key point for ICL efficiency (CARVALHO et al.,
2010). Besides, livestock tampling at sound stocking rates could be important to ICLS. Franzluebbers and Stuedmann (2008) emphasized the significance of animal traffic in the incorporation of plant residues into the soil. Comparing grazed to non grazed top soils, the author stated that the biological process of incorporation is the reason for increasing mineralization processes and soil microbial biomass in grazed areas. ICL can not only impact soil physical attributes, but also chemical (e.g.
phosphorus) (COSTAet al., 2014) and biological (e.g.
microbial biomass) (SOUZA et al., 2010) parameters
that can enhance or jeopardize crop establishment, development and yield depending on grazing intensity.
Regarding soybean, yield depends on the ability of plants to accumulate a minimum amount of dry matter
(200 g plant-1 in V2 phenological stage) as a consequence
of their ability to maximize solar radiation interception. Dry matter accumulation is influenced by several factors, such as weather conditions, sowing date, genotype, soil fertility, plant population and row spacing (BOARD; MODALI, 2005). Furthermore, biological nitrogen fixation (BNF) has a great influence on crop productivity. BNF in soybean, when
efficient, can sustain yields of 4.5 Mg ha-1 without nitrogen
fertilization (SALVAGIOTTIet al., 2008). However, soybean
development is rarely described in the perspective of an ICL
system under NT. Indeed, there is almost no reference on soybean yield and development in response to cumulative controlled preceding pasture management.
In this context, this study aims to evaluate the effect of grazing intensities on soybean nodulation, grain yield and yield components, and the impact of grazing management in the occurrence of undesirable species during soybean growing season.
MATERIAL AND METHODS
The experiment was conducted at São Miguel das
Missões county, Rio Grande do Sul (RS) State, Southern Brazil (28°56’14.00’’ S, 54°20’45.61’’ W, 417m). The climate is Cfa, subtropical humid, according to Köppen. The area presents gently rolling hills. The soil is classified as Rhodic Hapludox (SOIL SURVEY STAFF, 1999), deep, well drained
with clayey texture (0.54, 0.17 and 0.29 kg kg-1 of clay,
silt and sand, respectively, in the 0-20 cm soil layer). Table 1 presents soil chemical attributes.
The experimental area has being managed since 2001 in an integrated crop-livestock system under no-tillage (ICL-NT), where soybean grows in the summer
in rotation with mixed oats (Avena strigosa Schreb.) and
annual ryegrass (Lolium multiflorum Lam.) pastures in the
winter. Treatments consisted of four sward management heights (10, 20, 30 and 40 cm) and a non grazed (NG) reference area. The experiment was carried out under a completely randomized block design with three replicates for grazed treatments, and two for the NG. The preceding 2009 winter pasture management is
described in detail by Kunrath et al. (2014), and key
variables are shown in Table 2. Data from 2001 to 2008 were
similar and were reported by Carvalhoet al. (2011).
On 12/01/2009 the area was desiccated with
glyphosate (900 g a.i. ha-1) and 37.5 g a.i. ha-1 of Ethyl
2-(4-chloro-6-methoxypyrimidin-2-ylcarbamoylsulfamoyl). Soybean Nidera 6401RR cultivar was sown with a NT
seed-drill (12/17/2009) at a seeding rate of 45 seeds m-2, row spacing
of 0.45 m and 60 kg ha-1 of K
2O and P2O5row fertilization.
On 01/14/2010 a mixed of herbicide, fungicide
and insecticide, respectively, 720g a.i. ha-1 of glyphosate,
25 g a.i. ha-1 of epoxiconazole + 67 g a.i. ha-1 of pyraclostrobin
and 24 g a.i. ha-1of diflubenzuron, was applied in the area.
On 02/06/2010 a second application with 25 g i.a. ha-1
of epoxiconazole + 67 g a.i ha-1 of pyraclostrobin and 24 g
a.i. ha-1 of diflubenzuron + 900 g a.i. ha-1 of methamidophos,
fungicides and insecticides, respectively, was made.
Table 1 - Soil chemical attributes of different treatments at two depths
†(mg dm-3);††(cmolc dm-3);†††Organic matter (g kg-1);‡(% of CEC)
Treatment (sward height, cm)
Soil depth (cm) 10 20 30 40
0-10 10-20 0-10 10-20 0-10 10-20 0-10 10-20
P† 15.4 6.6 14.1 6.2 13.2 5.5 16.2 6.4
K† 105.0 101.1 81.0 88.6 105.0 72.3 112.0 87.8
Ca†† 5.6 3.9 4.9 3.5 5.0 3.3 5.4 3.2
Mg†† 3.0 2.4 2.6 2.1 2.7 2.0 2.9 2.0
Al+³ †† 1.6 5.1 1.6 4.8 1.1 4.8 1.2 5.4
OM††† 40 29 42 28 39 27 41 28
pH H2O 4.8 4.0 4.6 3.9 4.7 4.2 4.7 3.8
SMP 5.3 4.9 5.2 4.9 5.4 5.0 5.3 4.9
Na† 4.0 7.6 2.0 7.6 4.5 7.6 2.8 6.3
H+Al†† 7.2 10.3 7.8 10.3 6.6 9.4 6.8 10.4
CEC pH 7 10.5 11.6 9.4 10.6 9.1 10.2 9.7 10.8
CEC†† 16.1 16.9 15.5 16.0 14.7 14.9 15.3 15.8
Base Sat. ‡ 55.4 39.3 50.0 36.0 55.1 36.9 56.0 35.2
Al Sat. ‡ 15.2 42.9 17.1 43.7 12.1 46.5 12.7 47.2
Treatment Actual sward height
(cm)
Forage mass
(kg dry matter ha-1)
Plant residue
(kg dry matter ha-1)
Stocking rate
(kg LW ha-1)*
10 7.3 677 1081 1491
20 19.1 1777 2903 893
30 26.0 2695 4522 697
40 33.8 2873 5613 364
No grazing 58.9 5159 8002
-Standard error 1.68 337.82 263.57 126.08
Table 2 - Actual sward height, forage mass, plant residue, and mean stocking rate according to grazing intensities applied at the 9th
rotation cycle of an integrated crop-livestock system under no-till
*LW=liveweight
(third node, the second trifoliolate leaf fully developed), V8 (eighth node, seventh trifoliolate leaf fully developed) and R2 (full flowering, a flower open in the last two leaf nodes of the stem with leaf fully developed) phenological stages, respectively. The initial population was determined 27 DAS by counting the number of plants contained in 1.5 linear
meter (0.675 m2) in six points per plot. Among the plants
within the 0.675 m2, ten plants were randomly selected and
height was measured. To determine shoot dry matter, all
plants within the 0.675 m2 were harvested and dried in a
forced air circulation oven at 50 °C to constant weight. After drying, samples were weighed, grounded and analyzed for
nitrogen (N) content (TEDESCOet al., 1995). The model
proposed by Lemaire, Jeuffroy and Gastal (2008) for C3
species (%N = 4,8(DM)-0,33) was used to determine the
critical N dilution curve aiming to evaluate crop N level. Simultaneously to the evaluation of initial plant population, visual estimation of weeds coverage was made using a one
meter diameter circle (3.14 m2). Weeds were identified and
frequency ratio of each species was calculated.
determinations, soil monoliths of 0.2 x 0.2 x 0.2 m were taken in each sampling row. The roots were washed and nodules were manually detached and counted. After that, roots and nodules were dried until constant weight.
Soybean grain yield and final plant population were evaluated on 04/13/2010, at R8 stage (full maturity) when all plants within a 1.5 linear meter were counted and then harvested in six points per plot. Then, the number of legumes per plant and 1000-grain weight were determined. The number of grains per legume was estimated by dividing the total number of grains by the total number of legumes per plant. Pods were manually thrashed and the seeds were weighed and their moisture content was measured. Grain
yield and 1000-grain weight were adjusted to a 0.13 kg kg-1
moisture content. The weight of 1000 grains was estimated by weighing three samples of 100 grains and the average was used to extrapolate the value to 1000 grains.
Data was analyzed using regression and correlation analysis at =0.05 level. Response variables were regressed on the actual sward heights measured. When analyzing the soybean growing period, the number of DAS was considered for each sampling period. Further analysis of contrasts between grazed and no grazing area (NG x 10, 20, 30 and 40 cm) were performed by using SAS software (SAS INSTITUTE, 1997). Analyses were run firstly with the block factor in the model, and when not significant, regressions were used without the
block factor. When the response function was significant (P<0.05), the regression equation of higher coefficient of
determination (R2) associated with the biological significance
of the result was used. The models were compared using confidence intervals. Data for number of nodules per plant were transformed using the formula y = 1 + x. The software
INFOSTAT (DI RIENZOet al., 2010) was used to run
the multivariate analysis (principal component analysis and cluster analysis) for coverage and frequency of weeds and grain yield components. For the analysis of frequency only the five most frequent species were analyzed.
RESULTS AND DISCUSSION
Soybean initial plant population differed between treatments (P=0.0056, Table 3). Treatment
means ranged from 37.5 up to 44.8 plants m-2 for sward
heights of 10 and 30 cm, respectively. Differences in initial plant population reflect the effect of previous winter pasture management in soybean seedling establishment. Soil compaction in the highest grazing
intensity was previously reported by Souzaet al. (2008).
In association with the consequently less residue cover (Table 2) it affected seedling establishment and decreased initial plant population. Anyway, according to Thomas, Costa and Pires (2010), plant density in this study can be considered high for modern soybean cultivars.
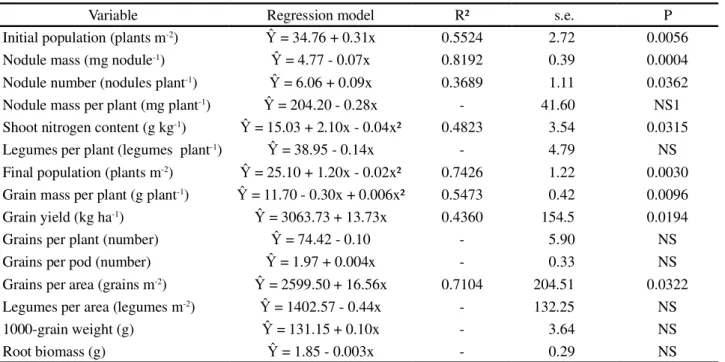
Table 3 - Regression models, coefficient of determination (R²), standard error (s.e.) and actual probability (P) for soybean parameters as a function of different grazing intensities applied at the 9th rotation cycle of an integrated crop-livestock system under no-till
¹NS=Not significant
Variable Regression model R² s.e. P
Initial population (plants m-2) = 34.76 + 0.31x 0.5524 2.72 0.0056
Nodule mass (mg nodule-1) = 4.77 - 0.07x 0.8192 0.39 0.0004
Nodule number (nodules plant-1) = 6.06 + 0.09x 0.3689 1.11 0.0362
Nodule mass per plant (mg plant-1) = 204.20 - 0.28x - 41.60 NS1
Shoot nitrogen content (g kg-1) = 15.03 + 2.10x - 0.04x² 0.4823 3.54 0.0315
Legumes per plant (legumes plant-1) = 38.95 - 0.14x - 4.79 NS
Final population (plants m-2) = 25.10 + 1.20x - 0.02x² 0.7426 1.22 0.0030
Grain mass per plant (g plant-1) = 11.70 - 0.30x + 0.006x² 0.5473 0.42 0.0096
Grain yield (kg ha-1) = 3063.73 + 13.73x 0.4360 154.5 0.0194
Grains per plant (number) = 74.42 - 0.10 - 5.90 NS
Grains per pod (number) = 1.97 + 0.004x - 0.33 NS
Grains per area (grains m-2) = 2599.50 + 16.56x 0.7104 204.51 0.0322
Legumes per area (legumes m-2) = 1402.57 - 0.44x - 132.25 NS
1000-grain weight (g) = 131.15 + 0.10x - 3.64 NS
Figure 1 - Soybean shoot biomass in different growth stages as a function of no grazing or grazing at sward heights applied at the 9th
rotation cycle of an integrated crop-livestock system under no-till
Figure 2 - Relationship between soybean shoot biomass and
nitrogen content according to non grazing or grazing at sward heights applied at the 9th rotation cycle of an integrated crop-livestock
system under no-till. Model represents optimum N concentration
Soybean followed the same growth pattern in relation to plant height, independent of system management (grazed or not grazed). For each DAS, at stages V3 and R2, plants grew 1.8 cm in height
(y=1.80x - 23.28, R2 = 0.9636 and s.e.= 5.20, P<0.0001).
Managing pasture at 10 cm resulted in lower dry matter accumulation for the same period of evaluation as compared to areas managed under 20, 30, 40 cm and NG, respectively (Figure 1). When managing pastures at the lowest height (10 cm), soybean plants daily
accumulated 89 kg ha-1. In the other grazing intensities
daily biomass accumulation was 30% higher (114 kg ha-1).
This difference suggests lower leaf area and fewer nodules per plant (THOMAS; COSTA; PIRES, 2010) in areas highly grazed. Although pasture management did not affect soybean plant height, the 10 cm sward height resulted in different biomass values as compared to other pasture heights.
Figure 2 reinforces the differences occurred in soybean biomass accumulation, and presents the N content in the accumulated soybean biomass as a function of pasture management. Approximately 30 days after sowing, the N levels were deficient for all treatments, including NG. Such result is due to the N fixation peak being reached only in R2 (LAWN; BRUN, 1974), despite nodulation starting in V2 (emergence of the second trifoliate). Furthermore, the dilution model efficiency only occurs for biomass accumulation
above 1 Mg ha-1. From the second assessment on, N
levels were higher than those required by soybean crop.
Nodule biomass did not differ between grazed and NG areas (P=0.0993), but differences were detected in areas managed at 10 cm (P=0.0015). Grazing led to higher nodule mass as compared to NG areas; averages being 2.3
and 4.0 mg nodule-1 for 10 cm and NG, respectively. No
difference between grazing treatments was observed as demonstrated by regression analysis (Table 3). The number of nodules per plant presented an inverse correlation to nodule mass (P=0.0008, r=-0.83) and nodule mass per plant (P=0.0046, r=-0.75). Number of nodules per plant in the present study was similar to those found by Scholles
and Vargas (2004) and Teixeiraet al. (2006), which carried
out experiments under greenhouse conditions. The correlation between number and nodules mass per plant indicates a balance between these variables, which tend to maintain the
same total nodule mass per plant (FERGUSONet al., 2010).
Regression analysis for nodule mass was significant (P>0.0004, Table 3), while number of nodules per plant increased with increasing sward height (P=0.0362, Table 3). Despite the lower nodule mass, soybean plants did not present N deficiency symptoms since most observations were close to the N critical values in the dilution curve (Figure 2). Grazing did not affect N levels (P = 0.5142). However, grazing management affected N content, fitting in a quadratic regression model (P
= 0.0226, Table 3). Averages ranged between 35.1 g kg-1 for
the 10 cm up to 41.0 g kg-1 for the 30 cm reflecting, thus,
differences in shoot biomass (dilution effect).
In the tallest sward height and in the NG, carbon and nitrogen stocks may have inhibited nodulation. Both total and labile C and stocks are higher for the 20, 30 and 40 cm as compared to NG areas and 10 cm (SOUZA
usually from soil native bacteria and, therefore, less efficient for nitrogen fixation when compared to selected strains.
No differences for soybean grain yields were observed when contrasting grazed and NG areas
(P=0.8758). Average values were 3,407 and 3,442 kg ha-1
for grazed and no grazed areas, respectively. Comparing grazed areas, grain yields fitted to a linear regression model (Table 3, Figure 3), indicating yields increase 13.7 kg
ha-1 per each centimeter sward height. Grain yields of
3,266, 3,302, 3,494, 3,567 and 3,442 kg ha-1 for the
treatments 10, 20, 30, 40 cm and NG, respectively, are
similar to those found by Floreset al. (2007), despite
the lack of differences between treatments.
Plant final population, as well as grain mass per plant (Table 3), differed among sward heights fitting a quadratic regression model. Plant population correlated to grain mass per plant (P = 0.0456, r = -0.59), number of pods per area (P = 0.0005, r = -0.85) and grain number per plant (P = 0.0017, r = -0.80).
None of the yield components evaluated were affected by pasture sward heights (Table 3). Number of pods
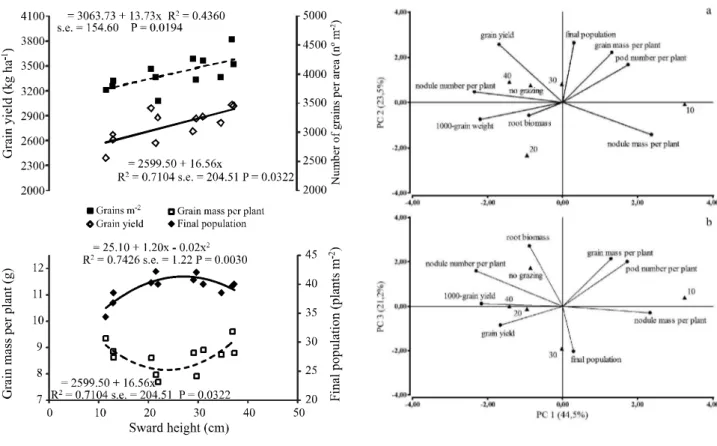
Figure 3 - Soybean grain yield, grain mass per plant, number
of grains per area and final plant population according to sward heights applied at the 9th rotation cycle of an integrated
crop-livestock system under no-till
per plant averaged 35.48 legumes plant-1, while number of
grains per plant, number of grains per legume and 1000-grain weight were 71.92, 2.08 and 133.73 g, respectively. Although yield components presented no differences, number of grains per area differed as a linear regression (Table 3, Figure 3).
Number of pods per plant was not affected by grazing or pasture sward height with grazed areas averaging 35.5 and
NG areas 38.1 legumes plant-1. These values are lower than
those reported by Lunardi et al. (2008) that registered 45
and 28 legumes plant-1 for grazed and NG areas, respectively.
Grain number per plant and per legume was 71.9 and 2.1 in grazed areas, whereas NG presented values of 64.8 grains
plant-1 and 1.7 grains legume-1. No differences were observed
for 1000-grain weight between sward heights, with values of 133.7 and 133.4 g for NG and grazed areas, respectively.
The high correlation between final plant population and grain yield, number of legumes per area and legume number and mass results from the increase in individual yields per plant as the number of plant decreases, maintaining grain yield per area. This soybean characteristic, known as phenotypic plasticity, has been reported by other authors
(PIRESet al., 2000; RAMBOet al., 2003). However, this
Figure 5 -Cluster analysis for the different pasture sward heights (10, 20, 30 and 40 cm) across the range of occupation by undesirable species (a) and combinations of treatments through the block of unwanted species (b). Euclidean distance and Ward agglomeration method were used
compensation was not enough to reverse negative effects for the 10 cm treatment. Despite treatments 20 and 30 cm resulted in lower grain yield per plant, total productivity was recovered by higher final plant population. The yield per area is defined by the productivity per plant and number of plants per area, which also defines the number of grains per area.
Grain yield main component analysis showed that 68% of the total variability is explained by the sum of the axes one and two (PC), 89% becoming explained when a third axis is added. No differences between 10 cm and other treatments were observed in Figure 4, since this treatment locates in the right side of the vertical axis, whilst others are grouped to the left. The 40 cm treatment was related to productivity, 1000-grain weight and number of nodules per plant. Ten centimeter sward height
was related to nodule mass. As presented in Figure 4b, the treatments 40 and 20 cm appear near the PC3 axis being closely related to 1000-grain weight and grain yield. These results indicate that 40 cm pasture management resulted in higher nodule number, grain weight and, as a consequence, higher productivity. In the other hand, 10 cm treatments resulted in higher nodule mass. Non grazed areas and 20 cm resulted in higher root biomass.
According to the multivariate analysis, pasture heights and weed coverage were divided in two groups (cophenetic correlation = 0.972, distance = 1.64). Cluster analysis (Figure 5a) presented 10 cm treatment isolated in the first group with remaining treatments located in the second group (20, 30 and 40 cm and NG), indicating differences in weed coverage. In Figure 5b, treatments were
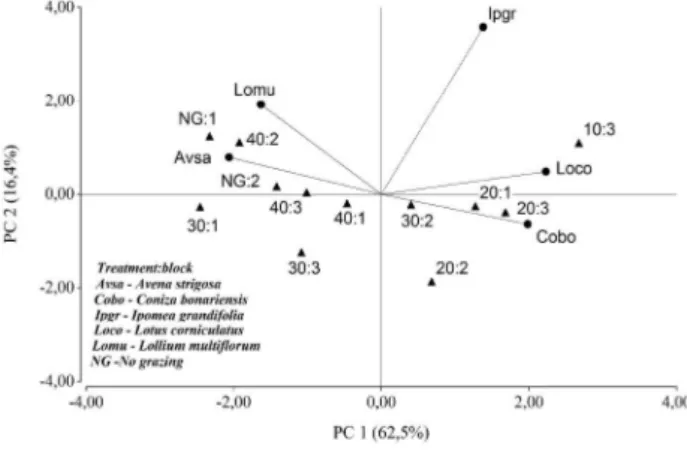
Figure 6 - Principal components analysis of the five most
common species for different pasture sward heights (10, 20, 30 and 40 cm) and no grazing
divided into two groups (distance = 6.44), depending on the frequency of undesirable species in soybean crop (cophenetic correlation = 0.712). Treatments 40 cm, 30 cm and NG were in the first group, while the remaining treatments were in the second one, indicating that each group has different weed coverage.
According to component analysis (Figure 6) of the five main weed species, oats and ryegrass were mostly associated with NG, 40 and 30 cm treatments. Managing pastures at 10 cm resulted in higher frequency of horseweed (Coniza bonariensis (L.) Cronq.), birdsfoot trefoil (Lotus corniculatus) and the string-of-viola (Ipomea nil), which was also associated to 20 cm sward management. PC1 and PC2 axes explained approximately 79% of data variability.
and NG areas, as a consequence of the higher remaining plant residue (Table 2), prevented radiation to reach soil seed bank, thus reducing soil temperature variation and inhibiting seed germination.
CONCLUSIONS
1. In general, grazing did not affect soybean grain yield. However, managing pastures at 10 cm lead to lower grain yields;
2. The number of grains per area decreased when pasture was managed at 10 cm, due to the reduction in the number of plants per area;
3. Nodulation patterns was amended by sward height;
4. Soybean nitrogen content was affected by grazing, although reaching levels not limiting for plant development;
5. Frequency and diversity of weeds differed between areas managed at 10 cm height and at 20 cm or higher.
ACKNOWLEDGEMENTS
We thank Cerro Coroado farm for the experimental animals and area. This research was founded by a doctoral scholarship grant from CNPq, Brazil.
REFERÊNCIAS
BOARD, J. E., MODALI, H. Dry matter accumulation predictors for optimal yield in soybean.Crop Science, v. 45, n. 5, p. 1790-1799, 2005.
CARVALHO, P. C. F.et al.Integração soja-bovinos de corte
no Sul do Brasil. Porto Alegre: Universidade Federal do Rio
Grande do Sul, 2011. 60 p. (Boletim Técnico).
CARVALHO, P. C. F. et al. Managing grazing animals to achieve nutrient cycling and soil improvement in no-till integrated systems.Nutrient Cycling in Agroecosystems, v. 88, n. 2, p. 259-273, 2010.
COSTA, S. E. V. G. A.et al. Impact of an integrated no-till crop-livestock system on phosphorus distribution, availability and stock.Agriculture, Ecosystems & Environment, v. 190, n. 1, p. 43-51, 2014.
DI RIENZO, J. A.et al.InfoStat version 2010. Grupo InfoStat, FCA. Argentina: Universidad Nacional de Córdoba, 2010. FERGUSON, B. J.et al. Molecular analysis of legume nodule development and autoregulation. Journal Integrative Plant
Biology, v. 52, n. 1, p. 61-76, 2010.
FERREIRA, E. M.; CASTRO, I. V. Nodulation and growth of subterranean clover (Trifolium subterraneum L.) in soils previously treated with sewage sludge. Soil Biology and
Biochemistry, v. 27, n. 9, p. 1177-1183, 1995.
FLORES, J. P. C.et al. Atributos físicos e rendimento de soja em sistema plantio direto em integração lavoura-pecuária com diferentes pressões de pastejo.Revista Brasileira de Ciência do
Solo, v. 31, n. 4, p. 771-780, 2007.
FRANZLUEBBERS, A. J.; STUEDMANN, J. A. Early Response of Soil Organic Fractions to Tillage and Integrated Crop-Livestock Production.Soil Science Society of America
Journal, v. 72, n. 3, p. 613-625, 2008.
LAWN, R. J.; BRUN, W. A. Symbiotic nitrogen fixation in soybeans. I. Effect of photosynthetic source-sink manipulations.
Crop Science, v. 14, n. 1, p. 11-16, 1974.
KUNRATH, T. R.et al. Management targets for continuously stocked mixed oat × annual ryegrass pasture in a no-till integrated crop-livestock system. European Journal of
Agronomy, v. 57, n. 1, p. 71-76, 2014.
LEMAIRE, G.; JEUFFROY, M. H.; GASTAL, F. Diagnostic tools for crop and plant N status in vegetative stage. Theory and practices for crop N management. European Journal of
Agronomy, v. 28, n. 4, p. 614-624, 2008.
LOPES, M. L. T. et al. Sistema de integração lavoura-pecuária: efeito do manejo da altura em pastagem de aveia preta e azevém anual sobre o rendimento da cultura da soja.
Ciência Rural, v. 39, n. 5, p. 1499-1506, 2009.
LUNARDI, R. et al. Rendimento de soja em sistema de integração lavoura-pecuária: efeito de métodos e intensidades de pastejo.Ciência Rural, v. 38, n. 3, p. 795-801, 2008.
MOREIRA, F. M. S.; SIQUEIRA, J. O. Microbiologia e
Bioquímica do Solo. Lavras: Editora da UFLA, 2002. 729 p.
PIRES, J. L. F.et al. Efeito de populações e espaçamentos sobre o potencial de rendimento da soja durante a ontogenia.Pesquisa
Agropecuária Brasileira, v. 35, n. 8, p. 1541-1547, 2000.
RAMBO, L.et al. Rendimento de grãos da soja em função do arranjo de plantas.Ciência Rural, v. 33, n. 1, p. 405-411, 2003. RUSSELLE, M. P.; ENTZ, M.; FRANZLUEBBERS, A. J. Reconsidering integrated crop-livestock systems in North America.Agronomy Journal, v. 99, n. 1, p. 325-334, 2007. SALVAGIOTTI, F. et al. Nitrogen uptake, fixation and response to fertilizer N in soybens: A review. Field Crops
Research, v. 108, n. 1, p. 1-13, 2008.
SAS INSTITUTE. SAS/STAT software: changes and enhancements through release 1 6.12. Cary: Statistical Analysis System Institute. 1997.
SCHOLLES, D.; VARGAS, L. K. Viabilidade da inoculação de soja com estirpes deBradyrhizobiumem solo inundado.Revista
Brasileira de Ciência do Solo, v. 28, n. 6, p. 973-979, 2004.
UNITED STATES DEPARTMENT OF AGRICULTURE.
Mak-ing and Interpreting Soil Surveys. 2. ed. Washington, DC, 1999.
SOUZA, E. D.et al. Biomassa microbiana do solo em sistema de integração lavoura pecuária em plantio direto, submetido a intensidades de pastejo. Revista Brasileira de Ciência do Solo, v. 34, n. 1, p. 79-88, 2010.
SOUZA, E. D.et al. Estoques de carbono e de nitrogênio no solo em sistema de integração lavoura-pecuária em plantio direto, submetido a intensidades de pastejo. Revista Brasileira de
Ciência do Solo, v. 33, n. 6, p. 1829-1836, 2009.
SOUZA, E. D.et al. Carbono orgânico e fósforo microbiano em sistema de integração agricultura-pecuária submetido a
diferentes intensidades de pastejo em plantio direto. Revista
Brasileira de Ciência do Solo, v. 32, n. 3, p. 1273-1282, 2008.
TEDESCO, M. J. et al. Análises de solo, plantas e outros
materiais. 2. ed. rev. e ampl. Porto Alegre: Universidade Federal do Rio Grande do Sul, 1995. 174 p.
TEIXEIRA, K. R. G.et al. Efeito da adição de lodo de curtume na fertilidade do solo, nodulação e rendimento de matéria seca do Caupi.
Ciência e Agrotecnologia, v. 30, n. 4, p. 1071-1076, 2006.
THOMAS, A. L.; COSTA, J. A.; PIRES, J. L. F. Estabelecimento da lavoura de soja.In: THOMAS, A. L.; COSTA, J. A.Soja: Manejo