Received December 20, 2010 and accepted July 6, 2011. Corresponding author: claudioarouca@yahoo.com.br
Available phosphorus in diets for 15 to 30 kg pigs genetically selected for
meat deposition
1Cláudio Luiz Corrêa Arouca2, Francisco Carlos de Oliveira Silva3, Dalton de Oliveira Fontes4, Alysson Saraiva5, Juarez Lopes Donzele6, Martinho de Almeida e Silva4, Eriane de Paula7
1Projeto financiado pela FAPEMIG. 2Doutorando em Zootecnia, DZO/UFMG. 3EPAMIG.
4Departamento de Zootecnia/UFMG. 5Doutorando em Zootecnia, DZO/UFV. 6Departamento de Zootecnia/UFV. 7Mestrando em Zootecnia, DZO/UFV.
ABSTRACT - With the objective to evaluate the effect of dietary available phosphorus levels (aP) on the performance,
blood and bone parameters of castrated male and female pigs, genetically selected for meat deposition, 60 commercial hybrids pigs with initial weight of 15.54±0.68 kg were allotted in a completely randomized block design, with six treatments (0.103, 0.210, 0.317, 0.424, 0.531, and 0.638% aP), five replicates, and two animals per experimental unit. Pigs were fed ad libitum
and water was provideduntil the end of the experimental period (21 days), when animals reached 31.31±2.94 kg. Daily weight gain and daily feed intake increased, while the feed conversion improved quadratically up to 0.534, 0.487, and 0.574% aP maximum responses, respectively. The aP intake and the values of inorganic phosphorus in serum increased linearly with increasing the levels of aP in the diets. Alkaline phosphatase activity increased quadratically up to 0.558% maximum response. Bone breaking strength and calcium, phosphorus, and ash contents in the bones increased linearly with increasing aP concentration in the diets. The available phosphorus requirement of castrated male and female pigs genetically selected for meat deposition from 15 to 30 kg for best results of performance is 0.574%, corresponding to a daily intake of 8.26 g of available phosphorus.
Key Words: carcass, growth, minerals, nutrition, performance www.sbz.org.br
Introduction
The production of pig carcasses with reduced fat content, besides meeting the consumer demands, enables better efficiency of the production process as pigs genetically selected for meat production are more efficient
in the conversion of food into kilograms of carcass.However,
changes in the rates of synthesis and deposition of body tissues can result in changes in nutrient requirements of pigs, and among these nutrients phosphorus deserves special attention.
In several countries, as well as in Brazil, intensive animal production tends to concentrate in certain areas and pig production is not an exception. Due to the increasing social and governmental concern with environmental pollution caused by pig slurry and also for economic reasons, the pig industry has been under pressure to take steps to substantially reduce the excretion of nutrients, including phosphorus, into the environment.
Although there is great interest in reducing phosphorus excretion by pigs, these efforts may result in deficiencies
which, although moderate, may affect not only growth but also the integrity of pigs’ bone. The provision of adequate levels of phosphorus in the diet is critical to maintaining profits in production and welfare of animals (Alexander
et al., 2008).Thus, as well as for other nutrients, the first
approach to improve the efficient use of phosphorus for pigs is to ensure an adequate intake of this mineral according to the genetic potential of the animals, avoiding deficient levels in feed or feed formulation with safety margins.
blood and bone parameters of 15 to 30 kg castrated male and female pigs genetically selected for meat deposition.
Material and Methods
T h e e x p e r i m e n t w a s c o n d u c t e d i n F a z e n d a Experimental Vale do Piranga of the state-owned Empresa de Pesquisa Agropecuária de Minas Gerais – EPAMIG (Oratórios, Minas Gerais, Brasil), from May to June.
Sixty commercial hybrid pigs, barrows and gilts, genetically selected for meat deposition, with initial weight of 15.54±0.68 kg were allotted in a completely randomized block design with six levels of available phosphorus, five replicates and two pigs (1 male and 1 female) per experimental unit (cage). Initial body weight was used as criterion in the blocks formation.
Pigs were housed in suspended metal cages
(0.925 m2 per pig), with wired mash floor and sides,
equipped with semi-automatic feeders and nipple drinkers, located in a facility with concrete floor and covered with ceramic tiles. The thermal environment inside the facility was monitored daily (7:00 h), using minimum and maximum thermometer placed in an empty cage in the
middle of the nursery room at half height of the pigs body.
The experimental isonitrogenous and isoenergetic diets (Table 1), were corn and soybean meal based, supplemented with minerals and vitamins to meet the requirements of this animal category according to Rostagno et al. (2005), except for available phosphorus.
The treatments which consisted of different available phosphorus levels (aP) included a basal diet and five diets obtained by the supplementation of the basal diet with dicalcium phosphate, in substitution of kaolin, resulting in diets with 0.103, 0.210, 0.317, 0.424, 0.531, and 0.638% aP. Industrial amino acids were added maintaining the ratios with digestible lysine suggested by Rostagno et al. (2005), according to the ideal protein concept.
The experimental diets were fed ad libitum and water
was provided throughout the experimental period (21
days).Experimental diets, waste and leftovers were weighed
weekly, and pigs were weighed individually at the beginning and at the end of the experiment, when they reached 31.31±2.94 kg, to calculate average weight gain (ADG), feed conversion (FC), daily feed intake (DFI), and daily available phosphorus intake.
Ingredient Available phosphorus level (%)
0 . 1 0 3 0 . 2 1 0 0 . 3 1 7 0 . 4 2 4 0 . 5 3 1 0 . 6 3 8
Corn 6 3 . 1 3 6 6 3 . 1 3 6 6 3 . 1 3 6 6 3 . 1 3 6 6 3 . 1 3 6 6 3 . 1 3 6 Soybean meal 2 9 . 5 8 2 2 9 . 5 8 2 2 9 . 5 8 2 2 9 . 5 8 2 2 9 . 5 8 2 2 9 . 5 8 2 Soybean oil 2 . 3 7 2 2 . 3 7 2 2 . 3 7 2 2 . 3 7 2 2 . 3 7 2 2 . 3 7 2 Dicalcium phosphate 0 . 0 0 0 0 . 5 7 6 1 . 1 5 6 1 . 7 3 4 2 . 3 1 4 2 . 8 9 0 Limestone 1 . 8 4 8 1 . 4 7 6 1 . 1 0 2 0 . 7 3 0 0 . 3 5 4 0 . 0 0 0
Kaolin 1 . 6 4 0 1 . 4 3 6 1 . 2 3 0 1 . 0 2 4 0 . 8 2 0 0 . 5 9 8
Salt 0 . 4 5 8 0 . 4 5 8 0 . 4 5 8 0 . 4 5 8 0 . 4 5 8 0 . 4 5 8
Vitamin premix1 0 . 3 0 0 0 . 3 0 0 0 . 3 0 0 0 . 3 0 0 0 . 3 0 0 0 . 3 0 0
Mineral premix2 0 . 1 0 0 0 . 1 0 0 0 . 1 0 0 0 . 1 0 0 0 . 1 0 0 0 . 1 0 0
Growth promoter3 0 . 1 5 0 0 . 1 5 0 0 . 1 5 0 0 . 1 5 0 0 . 1 5 0 0 . 1 5 0
Growth promoter 0 . 1 5 0 0 . 1 5 0 0 . 1 5 0 0 . 1 5 0 0 . 1 5 0 0 . 1 5 0 L-Lysine HCl – 78.4% 0 . 1 7 0 0 . 1 7 0 0 . 1 7 0 0 . 1 7 0 0 . 1 7 0 0 . 1 7 0 DL-Methionine – 99.0% 0 . 0 5 6 0 . 0 5 6 0 . 0 5 6 0 . 0 5 6 0 . 0 5 6 0 . 0 5 6 L-Threonine – 98.5% 0 . 0 2 8 0 . 0 2 8 0 . 0 2 8 0 . 0 2 8 0 . 0 2 8 0 . 0 2 8 Antioxidant 0 . 0 1 0 0 . 0 1 0 0 . 0 1 0 0 . 0 1 0 0 . 0 1 0 0 . 0 1 0 T o t a l 1 0 0 . 0 0 1 0 0 . 0 0 1 0 0 . 0 0 1 0 0 . 0 0 1 0 0 . 0 0 1 0 0 . 0 0
Nutritional calculated composition
ME (kcal/kg) 3 2 5 0 3 2 5 0 3 2 5 0 3 2 5 0 3 2 5 0 3 2 5 0
Crude protein (%) 1 8 . 8 4 1 8 . 8 4 1 8 . 8 4 1 8 . 8 4 1 8 . 8 4 1 8 . 8 4 Digestible lisine (%) 1 . 0 0 1 . 0 0 1 . 0 0 1 . 0 0 1 . 0 0 1 . 0 0 Digestible met + cys (%) 0 . 6 0 0 . 6 0 0 . 6 0 0 . 6 0 0 . 6 0 0 . 6 0 Digestible threonine (%) 0 . 6 5 0 . 6 5 0 . 6 5 0 . 6 5 0 . 6 5 0 . 6 5
Sodium (%) 0 . 2 0 0 . 2 0 0 . 2 0 0 . 2 0 0 . 2 0 0 . 2 0
Calcium (%) 0 . 8 0 0 . 8 0 0 . 8 0 0 . 8 0 0 . 8 0 0 . 8 0
Total phosphorus (%) 0 . 3 1 4 0 . 4 2 1 0 . 5 2 8 0 . 6 3 5 0 . 7 4 2 0 . 8 4 8 Available phosphorus (%) 0 . 1 0 3 0 . 2 1 0 0 . 3 1 7 0 . 4 2 4 0 . 5 3 1 0 . 6 3 8
1 Provided per kg of product: folic acid - 420 mg; panthothenic acid - 7,350 mg; biotin - 16.56 mg; niacin - 13,650 mg; piridoxin - 700 mg; riboflavin - 2,100 mg;
selenium - 136.50 mg; thiamin - 700 mg; vitamin A - 2,800,000 IU; vitamin B12 - 11,550 mcg, vitamin D3 - 1,050,000 IU; vitamin E - 10,500 mg; vitamin K3 - 2,800 mg. 2 Provided per kg of product: calcium - 98,800 mg; cobalt - 185 mg, copper - 15,750 mg; iron - 26,250 mg; iodine - 1,470 mg; manganese - 41,850 mg; zinc - 77,999 mg. 3 Provided per kg of product:copper - 115,000 mg; iron - 30,000 mg; zinc - 30,000 mg.
ME - metabolizable energy; met + cys - methionine + cystine.
At the end of the experiment all pigs were fasted for 12
hours, followed by 1 hour of feeding ad libitum. Then they
were fasted again and had no access to water for 4 hours of blood sampling by puncturing the orbital venous plexus. Blood samples were kept at rest for one hour at room temperature for clotting and clot retraction, and then centrifuged at 3,500 rpm for 10 minutes to separate serum, which was stored in a refrigerator. Cooled serum was then sent to the laboratory of Patologia Clínica of Escola de Veterinária of UFMG for analysis of alkaline phosphatase activity (APA) and phosphorus in serum.
Analyses were performed using kits for determination of alkaline phosphatase activity and serum phosphorus (Roadmaps for analysis of alkaline phosphatase and
serum phosphorus lab SYNERMED®, Westfield, IN,
USA - SYNERMED® of Brasil, São Paulo, SP) in a device
of the brand “Cobas Mira”, which is equipped with
s p e c t r o p h o t o m e t e r . The Synermed® method for
determination of alkaline phosphatase activity uses the p-nitrophenylphosphate as substrate and measures the reaction kinetically at 405 nm, as described by Bowers & McComb (1966), called UV enzymatic method (IFCC-AMP) for quantitative determination of alkaline phosphatase.
The phosphorus content in serum was measured using the colorimetric IR/catalysed (phosphomolybdate/PVP), which uses polyvinylpyrrolidone to catalyze the reaction of phosphorus with molybdate. The polyvinylpyrrolidone polymer catalyzes the formation of molybdate, which, having reacted with phosphorus, forms a phosphomolybdate complex, which is reduced to form a strong blue chromophore that strongly absorbs the infrared and can be quantified spectrophotometrically between 600 and 700 nm.
After the procedures of blood sampling, one animal from each experimental unit, with the body weight closest to the average weight of the block, was stunned, with further exsanguination for collection of the front foot from the right side. The collected paws were placed in aluminum container and boiled in water to soften the skin and muscle around bones to remove the third metacarpals.
The metacarpal bones were oven-dried (65 °C, 72 hours) and then subjected to a breaking bending force (shear failure), indicator of bone strength. Using the apparatus Instron Corporation IX Automated Materials Testing System - Model 4204, belonging to the Laboratório de papel e cellulose, Departamento de Engenharia Florestal, Universidade Federal de Viçosa, in Viçosa, MG, Brasil.
After the breaking strength test, the bones were defatted in Soxhlet extractor and oven-dried (65 °C, 24 hours) and then ground. Analyses of calcium, phosphorus and bone ash were performed at the Laboratory of Agroceres, Rio Claro - SP, using the methods described by Silva & Queiroz (2002).
The statistical analysis of the performance data, bone parameters and daily carcass protein and fat deposition was performed using the procedures for analysis of variance and regression contained in the SAEG statistical package (Sistemas para Análises Estatísticas, versão 9.1). The requirement of aP was obtained based on the results of daily weight gain, feed conversion and bone parameters using linear, quadratic or linear response plateau models, according to the best model adjustment for each variable. For all statistical procedures, probability values below 0.05 were considered significant.
Results and Discussion
During the experimental period the average minimum and maximum temperatures inside the rooms were 18.65±1.65 °C and 26.69±1.71 °C, respectively. According to the thermoneutral temperature range suggested by Coffey et al. (2000) for 18 to 34 kg pigs, which is between 18.3 and 26.7 °C, it was observed that the temperature variation during the experiment was within the ideal range for this animal category.
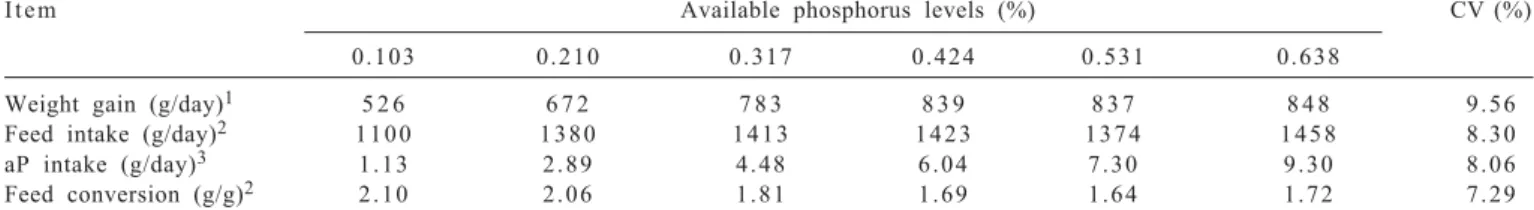
There was effect (P<0.01) of dietary aP levels on the average daily gain (ADG) of pigs (Table 2), which increased
according to the quadratic equation: Y^ = 0.3547 + 1.8801X–
1.7598X2(r2= 0.99) up to 0.534% of aP maximum response
(0.164%/Mcal of metabolizable energy - ME), corresponding
I t e m Available phosphorus levels (%) CV (%)
0 . 1 0 3 0 . 2 1 0 0 . 3 1 7 0 . 4 2 4 0 . 5 3 1 0 . 6 3 8
Weight gain (g/day)1 5 2 6 6 7 2 7 8 3 8 3 9 8 3 7 8 4 8 9 . 5 6
Feed intake (g/day)2 1 1 0 0 1 3 8 0 1 4 1 3 1 4 2 3 1 3 7 4 1 4 5 8 8 . 3 0
aP intake (g/day)3 1 . 1 3 2 . 8 9 4 . 4 8 6 . 0 4 7 . 3 0 9 . 3 0 8 . 0 6
Feed conversion (g/g)2 2 . 1 0 2 . 0 6 1 . 8 1 1 . 6 9 1 . 6 4 1 . 7 2 7 . 2 9
1, 2 Quadratic effect (P<0.01) and (P<0.05), respectively. 3 Linear effect (P<0.01).
CV = coefficient of variation.
to an intake of 7.74 g aP/day. Saraiva et al. (2009a) evaluating levels of aP for pigs with high genetic potential, from 15 to 30 kg, also found a quadratic response in ADG, estimating at 6.39 g/day the aP intake. Similar response was also verified by Stahly & Cook (1996), who estimated the maximum level of aP for greatest ADG in 6 to 36 kg pigs at 0.40%. On the other hand, Stahly et al. (2000) found a linear effect on the variable GPD in a study with piglets from 9 to 37 kg, according to the dietary levels of Pd (0.16 to 0.56%).
The divergent results found among studies may be related, among other factors, to differences in the pigs genetic potential for muscle deposition, since muscle has higher amount of phosphorus in relation to fat (Stahly et al., 2000). Fandrejewski & Rymarz (1986) and Hendricks et al. (1993) found that pigs from lines with different genetic potential for muscle deposition may differ in their phosphorus requirements. Corroborating the findings of these authors, Mahan (2006) evaluated the total content of minerals in the loin and ham from pigs of two genetic lines and found that concentrations of calcium and phosphorus were higher in pigs with higher genetic potential for muscle accretion.
There was quadratic effect (P<0.05) of aP on daily feed intake (DFI) of pigs (Table 2), which increased according to
the equation: Yˆ = 0.9692 + 1.9916X – 2.0444X2 (r2 = 0.78)
up to the 0.487% of aP maximum response (0.150%/Mcal of ME), corresponding to an intake of 7.08 g/day of aP. This result corroborates those obtained by Stahly et al. (2000), who also reported a quadratic increase in DFI of pigs according to the dietary aP levels, up to 0.480% aP maximum response. However, Saraiva et al. (2009a), in a study with pigs from 15 to 30 kg fed diets with aP levels varying from 0.103 to 0.638, found that the average feed intake (AFI) increased linearly by increasing aP concentration. On the other hand, Gomes et al. (1989) and Stahly & Cook (1996) found no effect of aP in the AFI of pigs in the initial phase of growth.
Despite the inconsistency of response observed among studies, our results showed that the quadratic response in
AFI was due to the significantly reduced feed intake of pigs fed the diet with the lowest concentration of aP (0.103%). The aP levels influenced (P<0.01) the available phosphorus intake (aPI), which increased linearly according
to the equation: Y^ = - 0.310202 + 14.8486X (r2 = 0.99). As
feed intake also varied significantly among the levels of aP, it can be inferred that the observed increase in aPI was due to the concentration of phosphorus in the diets and the significant increase in the ADI.
The aP levels also influenced (P<0.05) the feed conversion (FC) of pigs (Table 2), which improved
quadratically according to the the equation: Yˆ = 2.3867 –
2.4641X + 2.1457X2 (r2 = 0.92) up to 0.574% of aP maximum
response (0.177%/Mcal of ME), corresponding to an intake of 8.26 g/day of aP. Quadratic improvement in FC of 15 to 30 kg pigs, selected for meat deposition, up to 0.477% of aP maximum response was also observed by Saraiva et al. (2009a). However, several authors have found no effect of phosphorus levels in the diet in feed efficiency (Combs et al., 1991a; Stahly & Cook, 1996) and the FC (Gomes et al., 1989; Hall et al., 1996; Kegley et al., 2001) of pigs.
Besides possible differences in the genetics capacity for muscle deposition, the divergent results observed among studies, may also be related to the level of pigs immune challenge used in the different experiments. Sthaly and Cook (1997) evaluated levels of aP for 6 to 30 kg challenged piglets and found that the greatest FC of pigs with subjected to moderate immune challenge occurred at the level of 0.70% aP, while for the pigs at high challenge the greatest in FC occurred at the level of 0.40% aP.
In this study, the dietary aP levels influenced ADG and AFI, which increased quadratically. Thus, the improvement observed in the FC up to the estimated maximum level of 0.574% aP, indicates a possible change in the composition of weight gain, with higher muscle and lower fat deposition in the pigs that received diets with the highest aP levels. The increase in weight gain of pigs associated with improvement in feed conversion is explained mainly by a higher muscle accretion (Marinho et al., 2007).
1 Quadratic effect (P<0.05).
2, 3 Linear effect (P<0.01) and (P<0.05), respectively.
CV = coefficient of variation.
I t e m Available phosphorus levels (%) CV (%)
0 . 1 0 3 0 . 2 1 0 0 . 3 1 7 0 . 4 2 4 0 . 5 3 1 0 . 6 3 8
Alkaline phosphatase activity (U/L)1 4 6 9 3 7 5 3 5 2 3 0 0 3 1 7 2 9 2 1 8 . 7 8
Serum phosphorus (μg/dL)2 4 . 7 4 7 . 0 6 8 . 0 9 9 . 5 5 1 0 . 3 2 1 0 . 4 0 1 6 . 3 2
Bone strength (N)3 6 3 2 7 7 4 8 1 5 7 9 4 7 9 3 9 1 8 1 7 . 3 4
Bone phosphorus (mg/kg)2 6 . 7 8 7 . 2 6 7 . 9 5 7 . 4 9 8 . 0 4 7 . 7 9 8 . 3 4
Bone calcium (mg/kg)2 1 5 . 0 8 1 5 . 2 7 1 6 . 5 9 1 6 . 1 5 1 6 . 4 7 1 6 . 3 0 5 . 7 9
Bone ash (%)2 4 0 . 3 7 4 1 . 9 4 4 4 . 2 6 4 5 . 2 8 4 6 . 4 2 4 5 . 4 1 5 . 2 3
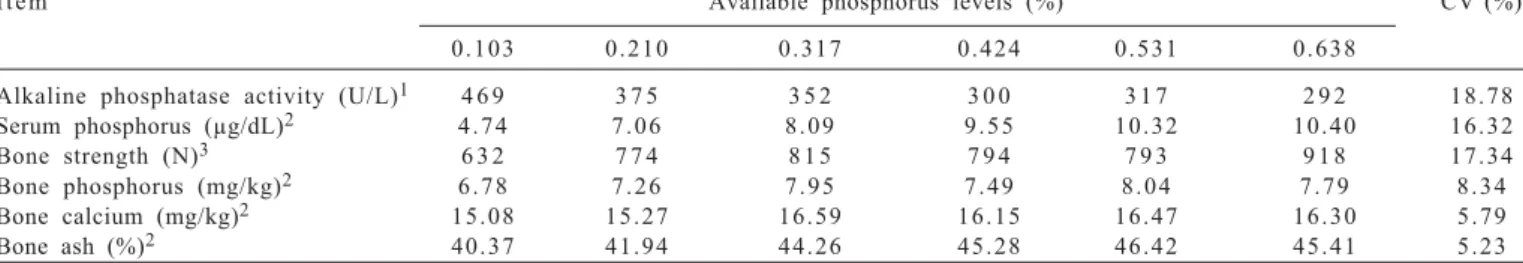
The dietary aP in the diets influenced (P<0.05) the activity of the enzyme alkaline phosphatase (APA) of pigs (Table 3), which reduced quadratically according to the
equation: Y^ = 545.722 – 887.86X + 794.796X2 (r2 = 0.96) up
to 0.558% of aP maximum response (0.172%/Mcal of ME). This result does not confirm those of Koch & Mahan (1985) and Boyd et al. (1983) who, evaluating diets with aP varying from 0.120 to 0.500% and 0.260 to 0.500%, respectively, observed a linear decrease in the APA by increasing aP in the diet of 18 to 35 and 17 to 31 kg pigs. Alkaline phosphatase is an enzyme associated with bone formation that has its levels increased in situations where disorders in bone mineralization occur, such as dietary deficiency of phosphorus (Scott et al., 1997).
According to Guyton and Hall (1997), alkaline phosphatase is almost always an indication of intense bone formation and thus tends to be high during the growth phase, in diseases that cause bone destruction or after bone fractures, and in cases of Ca and/or P deficiency in the diet. However, Dayrell et al. (1972) point out that the alkaline phosphatase has a high coefficient of variation, which may compromise its value as a parameter for assessment of bone metabolic disorders. During stress, for example, alkaline phosphatase originated in the liver may vary suddenly (Furtado, 1991).
Concerning age, most studies have reported that the APA decreases as the animal completes its growth phase (Santos, 1983).
Based on the results of APA obtained in this study, it is possible to use this variable to estimate the available phosphorus requirement of pigs in early stages of growth, based on the quadratic response pattern and the high coefficient of determination verified.
The values of inorganic phosphorus in serum increased (P<0.01) linearly with the increase in the dietary aP levels
(Table 3), according to the equation Y^ = 5.04870 + 9.17104X
(r2 = 0.93). Linear increase of phosphorus content in serum
was also found by Nimmo et al. (1981) and Koch et al. (1984), studying pigs from 7 to 92 kg and 90 to 20 kg, respectively. Different response pattern was obtained by Mahan & Maxson (1983), who assessed phosphorus levels between 0.40 and 0.90%, and reported quadratic increase in serum phosphorus up to 0.50% aP maximum response in pigs at 40 to 57 kg. Contrary to these results, Nimmo et al. (1980) found no effect of dietary calcium and phosphorus in the amount of phosphorus in the serum of pigs.
The aP levels influenced (P<0.05) bone strength of pigs (Table 3), which increased linearly according to the equation:
Y^ = 645.3410 + 386.1730X (r2 = 0.72). Positive linear effect of
dietary aP in the resistance of the third metacarpal bone of growing pigs was also observed by Eeckhout et al. (1995) and Saraiva et al. (2009b). However, different pattern of response was verified by O’Quinn et al. (1997) and Saraiva et al. (2009a), who, working with pigs from 25 to 50 and from 15 to 30 kg, respectively, found that dietary levels of aP quadratically influenced the bone strength.
The bone strength results of this study confirm those obtained by Mahan (1982), Koch et al. (1984), Combs et al. (1991b), and Saraiva et al. (2009a, b) in which the level of phosphorus required for greatest performance of pigs is less than that required for maximum bone development.
The amounts of calcium and phosphorus in the bones (Table 3) were influenced (P<0.01) linearly by increasing the levels of aP in the diets, according to the equations:
Y^ = 15.0272 + 2.6040X (r2 = 0.64) and Y^ = 6.8735 + 1.8323X
(r2= 0.60), respectively. There was also effect (P<0.01) of aP
(Table 3) in the percentage of bone ash that increased
linearly according to the equation: Y^ = 40.0246 + 10.5939X
(r2 = 0.83). These results are consistent with those of bone
strength verified in this study, although they do not corroborate those obtained by Viana (2008) and Saraiva et al. (2009a), who reported a quadratic effect of aP levels in the diet on the amounts of calcium and phosphorus measured in the third metacarpal of 15 to 30 kg pigs, up to the maximum estimated levels of 0.388 and 0.619% for Ca and 0.369 and 0.596% for P, respectively.
On the other hand, in a study with 30 to 60 kg pigs, Saraiva et al. (2009b) found the amount of phosphorus in the third metacarpal increased linearly by increasing the levels of aP in the diet, similarly to the results of this study. However, according to the same authors, the amount of calcium in the bone was not influenced by the dietary levels of aP.
these same authors found linear and quadratic increase in bone strength when evaluated in the rib bones (fifth, sixth and seventh ribs) and femur, respectively.
Feed conversion is one of the performance variables of greatest importance in the pig production, especially in the growing and finishing phases. With the greatest result for this variable at the level of 0.574% of aP in this study, which also meets the requirement for improved ADG (0.534% aP), it can be infered that the levels of 0.320 and 0.400% aP recommended by the NRC (1998) and Rostagno et al. (2005), respectively, may not be sufficient to meet the requirements of the current pig genotypes available in the market.
Conclusions
The available phosphorus requirement of castrated male and female pigs, genetically selected for meat deposition, from 15 to 30 kg, for greatest performance is 0.574%, corresponding to a daily feed intake of 8.26 g of available phosphorus.
References
ALEXANDER, L.S.; QU, A.; CUTLER, S.A. et al. Response to dietary phosphorus deficiency is affected by genetic background in growing pigs. Journal of Animal Science, v.86, p.2585-2595, 2 0 0 8 .
BOWERS Jr., G.N.; McCOMB, R.B. A continuous spectrophotometric method for measuring the activity of serum alkaline phosphatase. Clinical Chemistry, v.12, p.70-89, 1966.
BOYD, R.D.; HALL, D.Y.; WU, J.F. Plasma alkaline phosphatase a s a c r i t e r i o n f o r d e t e r m i n i n g b i o l o g i c a l a v a i l a b i l i t y o f p h o s p h o r u s f o r s w i n e . Journal of Animal Science, v. 5 7 , p.396-401, 1983.
COFFEY, R.D.; PARKER, G.R.; LAURENT, K.M. [2000]. Feeding growing-finishing pigs to maximize lean grow rate. University of Kentucky. College of Agriculture. Available at: <http:// www.animalgenome.org/edu/PIH/prod_grow_finish.pdf> Accessed on: May 14, 2007.
COMBS, N.R.; KORNEGAY, E.T.; LINDEMANN, M.D. et al. Calcium and phosphorus requirement of swine from weaning to m a r k e t w e i g h t : I . D e v e l o p m e n t o f r e s p o n s e c u r v e s f o r performance. Journal of Animal Science, v.69, p.673-681, 1 9 9 1 a .
COMBS, N.R.; KORNEGAY, E.T.; LINDEMANN, M.D. et al. Calcium and phosphorus requirement of swine from weaning to market weight: II. Development of response curves for bone criteria and comparison of bending and shear bone testing. Journal of Animal Science, v.69, p.682-693, 1991b. CRENSHAW, T.D.; PEO JUNIOR, E.R.; LEWIS, A.S. et al. Bone
strength as a trait for assessing mineralization in swine: a critical review of techniques involved. Journal of Animal Science, v.53, p.827-835, 1981.
DAYRELL, M.S.; LOPES, H.O.S.; AROEIRA, J.A.D.C. et al. Teores de cálcio, magnésio, fósforo inorgânico e atividade da fosfatase alcalina no soro sangüíneo de bovinos criados no cerrado. Arquivos da Escola de Veterinária, v.24, p.265-279, 1972. EECKHOUT, W.; PAEPE, M.; WARNANTS, N. et al. An estimation of the minimal P requirements for growing-finishing pigs, as
influenced by the Ca level of the diet. Animal Feed Science and Technology, v.52, p.29-40, 1995.
FANDREJEWSKI, H.; RYMARZ. Effect of feeding level on Ca, P, K and Na content in bodies of growing boars and gilts. Livestock Production Science, v.14, p.211-215, 1986.
FERNÁNDEZ, J.A. Calcium and phosphorus metabolism in growing pigs. II. Simultaneous radio-calcium and radio-phosphorus kinetics. Livestock Production Science, v.41, p.243-254, 1995. FURTADO, M.A.O. Determinação da biodisponibilidade de
fósforo em suplementos de fósforo para aves e suínos. 1991. 61f. Dissertação (Mestrado em Zootecnia) – Escola de Ve t e r i n á r i a , U n i v e r s i d a d e F e d e r a l d e M i n a s G e r a i s , B e l o Horizonte.
GOMES, P.C.; ROSTAGNO, H.S.; PEREIRA, J.A.A. et al. Exigência de fósforo total e disponível para suínos na fase de crescimento. Revista da Sociedade Brasileira de Zootecnia, v.18, n.3, p.233-239, 1989.
GUYTON, A.C. HALL, J.E. Tratado de fisiologia médica. 9.ed. Rio de Janeiro: Guanabara Koogan, 1997. 1014p.
HALL, D.D.; CROMWELL, G.L.; STAHLY, T.S. Effects of dietary calcium, phosphorus, calcium:phosphorus ratio and vitamin K on performance, bone strength and blood clotting status of pigs. Journal of Animal Science, v.69, p.646-655, 1991. HASTAD, C.W.; DRITZ, S.S.; TOKACH, M.D. et al. Phosphorus
requirements of growing-finishing pigs reared in a commercial environment. Journal of Animal Science, v.82, p.2945-2952, 2 0 0 4 .
H E N D R I C K S , W. H . ; M O U G H A N , P. J . W h o l e - b o d y m i n e r a l composition of entire male and female pigs depositing protein at maximal rates. Livestock Production Science, v.33, p.161-170, 1 9 9 3 .
HITTMEIER, L.J.; GRAPES, L.; LENSING, R.L. et al. Genetic background influences metabolic response to dietary phosphorus restriction. Journal of Animal Science, v.17, p385-395, 2006. KEGLEY, E.B.; SPEARS, J.W.; AUMAN, S.K. Dietary phosphorus and an inflammatory challenge affect performance and immune function of weanling pigs. Journal of Animal Science, v.79, p.413-419, 2001.
KETAREN, P.P.; BATTERHAM, E.S.; WHITE, E. Phosphorus studies in pigs. 1. Available phosphorus requirements of grower/ finisher pigs. British Journal of Nutrition, v.70, p.249-268, 1 9 9 2 .
KOCH, M.E.; MAHAN, D.C. Biological characteristics for assessing low phosphorus intake in growing swine. Journal of Animal Science, v.60, p.699-708, 1985.
KOCH, M.E.; MAHAN, D.C.; CORLEY, J.R. An evaluation of various biological characteristics in assessing low phosphorus intake in weanling swine. Journal of Animal Science, v.59, p.1546-1556, 1984.
LE BELLEGO, L.; VAN MILGEN, J.; NOBLET, J. Effect of high t e m p e r a t u r e a n d l o w - p r o t e i n d i e t s o n t h e p e r f o r m a n c e o f growing-finishing pigs. Journal of Animal Science, v.80, p.691-701, 2002.
LE FLOC’H. N.; MELCHIOR, D.; OBLED, C. Modifications of protein and amino acid metabolism during inflammation and immune system activation. Livestock Production Science, v.87, p.37-45, 2004.
MAHAN, D. Necessidades de minerales em cerdos selecionados por um alto contenido em magro y cerdas de alta productividad. FEDNA, 2006. Available at: <http://www.etsia.upm.es/fedna/ capitulos/06CAP_VIII.pdf>. Accessed on: May 18, 2007. MARINHO, P.C.; FONTES, D.O.; SILVA, F.C.O. et al. Efeito da
ractopamina e de métodos de formulação de dietas sobre o desempenho e as características de carcaça de suínos machos castrados em terminação. Revista Brasileira de Zootecnia, v.36, n.4, p.1061-1068, 2007 (supl.).
NIMMO, R.D.; PEO JUNIOR, E.R.; MOSER, B.D. et al. Effect of level of dietary calcium-phosphorus during growth and gestation on performance, blood and bone parameters of swine. Journal of Animal Science, v.52, p.1330-1342, 1981.
NIMMO, R.D.; PEO JUNIOR, E.R.; MOSER, B.D. et al. Response of different genetic lines of boars to varying levels of dietary calcium and phosphorus. Journal of Animal Science, v.51, p.112-120, 1980.
NATIONAL RESEARCH COUNCIL - NRC. Nutritional requirements of swine. 10.ed. Washington, DC: National Academic Science, 1998. 211p.
QUINIOU, N.; NOBLET, J.; VAN MILGEN, J.; DUBOIS, S. Modeling heat production and energy balance in group-housed growing pigs exposed to low or high temperatures. British Journal of Nutrition, v.84, p.97-106, 2000.
ROSTAGNO, H.S.; ALBINO, L.F.T.; DONZELE, J.L. et al. Tabelas brasileiras para aves e suínos: composição de alimentos e exigências nutricionais. 2.ed. Viçosa, MG: UFV, Imprensa Universitária, 2005. 186p.
SANTOS, L.M.M. Influência da idade sobre os níveis séricos de cálcio, fósforo inorgânico, fosfatase alcalina, transaminases glutâmica, oxalacética e pirúvica em suínos. 1983. 26f. Dissertação (Mestrado em Medicina Veterinária) – Escola de Ve t e r i n á r i a , U n i v e r s i d a d e F e d e r a l d e M i n a s G e r a i s , B e l o Horizonte.
SARAIVA, A.; DONZELE, J.L.; ABREU, M.L.T. et al. Available phosphorus levels in diets for swine from 15 to 30 kg genetically s e l e c t e d f o r m e a t d e p o s i t i o n . Revista Brasileira de Zootecnia, v.38, n.2, p.307-313, 2009a.
SARAIVA, A.; DONZELE, J.L.; OLIVEIRA, R.F.M. et al. Níveis de fósforo disponível em rações para leitoas de alto potencial genético para deposição de carne dos 30 aos 60 kg. Revista Brasileira de Zootecnia, v.38, n.7, p.1279-1285, 2009b.
SHURSON, J.; POMERENKE, J. [2008]. Use of US DDGS in practical swine diet formulations. University of Minnesota. International Distillers Grains Conference. Available at: <http://www.thepigsite.com/articles/2629/use-of-us-ddgs-in-practical-swine-diet-formulations> Accessed on: Apr. 12, 2009. SCOTT, D.; LOVERIDGE, N.; NICODEMO, L. et al. Effect of diets varying in nitrogen or phosphorus content on indicators of bone growth in lambs. Experimental Physiology, v.82, p.193-202, 1997
SILVA, D.J.; QUEIROZ, A.C. Análise de alimentos (métodos químicos e biológicos). 3.ed. Viçosa, MG: Universidade Federal de Viçosa, 2002. 235p.
STAHLY, T.S.; COOK, D.R. Dietary available phosphorus needs of pigs from 13 a 70 pounds body weight. ASL-R 1477. Iowa State University. Swine research report, 1996. Available at: <http://www.extension.iastate.edu/pages/ansci/swinereports/ nutrition97.html> Accessed on: Oct. 30, 2007.
STAHLY, T.S.; COOK, D.R. Dietary available phosphorus needs of pigs experiencing a moderate and high level of antigen exposure. ASL-R 1371. Iowa State University. Swine research report, 1997. Available at: <http://www.extension.iastate.edu/pages/ ansci/swinereports/asl-1563.pdf> Accessed on: Oct. 30, 2007. UNDERWOOD, E.J.; SUTTLE, N.F. The mineral nutrition of
livestock. 3.ed. New York: CABI Publishing, 1999. 598p. V I A N A , J . M . Biodisponibilidade de fósforo em fosfatos e
níveis de fósforo disponível para suínos na fase inicial. 2008. 49f. Tese (Mestrado em Zootecnia). Universidade Federal de Viçosa, Viçosa, MG.