A Multi-Agent System for Airline Operations Control
Antonio J. M. Castro, Eugenio OliveiraInformatics Engineering Department and LIACC/NIAD&R Faculty of Engineering, University of Porto
Rua Dr. Roberto Frias s/n, 4200-465, Porto, Portugal [email protected], [email protected]
Abstract. The Airline Operations Control Center (AOCC) tries to solve unexpected problems that might occur during the airline operation. Problems related to aircrafts, crewmembers and passengers are common and the actions towards the solution of these problems are usually known as operations recovery. In this paper we present the implementation of a Distributed Multi-Agent System (MAS) representing the existing roles in an AOCC. This MAS has several specialized software agents that implement different algorithms, competing to find the best solution for each problem and that include not only operational costs but, also, quality costs so that passenger satisfaction can be considered in the final decision. We present a real case study where a crew recovery problem is solved. We show that it is possible to find valid solutions, with better passenger satisfaction and, in certain conditions, without increasing significantly the operational costs.
Keywords: Airline Operations Control, Operations Recovery, Disruption Management, Multi-agent system, Software Agents, Operational Costs, Quality Costs.
1 Introduction
Operations control is one of the most important areas in an airline company. Through operations control mechanisms the airline company monitors all the flights checking if they follow the schedule that was previously defined by other areas of the company. Unfortunately, some problems arise during this phase [7]. Those problems are related to crewmembers, aircrafts and passengers. The Airline Operations Control Centre (AOCC) is composed by teams of people specialized in solving the above problems under the supervision of an operation control manager. Each team has a specific goal contributing to the common and general goal of having the airline operation running with few problems as possible. The process of solving these problems is known as Disruption Management [8] or Operations Recovery.
To be able to choose the best solution to a specific problem, it is necessary to include the correct costs on the decision process. It is possible to separate the costs in two groups: Operational Costs (easily quantifiable costs) and Quality Costs (less easily quantifiable costs). The operational costs are, for example, crew costs (salaries, hotel, extra-crew travel, etc.) and aircraft/flights costs (fuel, approach and route taxes, handling services, line maintenance, etc.). The quality costs that we are interested in calculating in the AOCC domain are, usually, related to
passenger satisfaction. Specifically, we want to include on the decision process the cost of delaying or cancelling a flight from the passenger point of view, that is, in terms of the importance that a delay will have to the passenger.
Starting from the work presented in [6] and based on our observations we have done on an AOCC of a real airline company we hypothesize that the inclusion of quality costs in the decision process will increase the customer satisfaction (a fairly obvious prediction) without increasing significantly (or nothing at all) the operational costs of the solutions in a given period. Basically, we expect to find valid alternate solutions within the same operational cost but with a better impact on the passenger satisfaction.
The rest of the paper is organized as follows. In section 2 we present some work of other authors regarding operations recovery. Section 3 shows how we arrived at the formulas we have used to express the importance of the flight delay, from the passenger point of view. Section 4 shows how we have updated the MAS presented in [6] to include quality costs, including the MAS architecture and the algorithm used to choose the best solution. In section 5 we present the scenario used to evaluate the system as well as the results of the evaluation. Finally, we discuss and conclude our work in section 6.
2 Related work
The paper [2] gives an overview of OR applications in the air transport industry. We will present here the most recent published papers according to [7]. We divided the papers in three areas: crew recovery, aircraft recovery and integrated recovery.
Aircraft Recovery: The most recent paper considering the case of aircraft
recovery is [10]. They formulate the problem as a Set Partitioning master problem and a route generating procedure. The goal is to minimize the cost of cancellation and retiming, and it is the responsibility of the controllers to define the parameters accordingly. It is included in the paper a testing using SimAir [11] simulating 500 days of operations for three fleets ranging in size from 32 to 96 aircraft servicing 139-407 flights. Although the authors do try to minimize the flights delays, nothing is included regarding the use of quality costs.
Crew Recovery: In [1] the flight crew recovery problem for an airline with a
hub-and-spoke network structure is addressed. The paper details and sub-divides the recovery problem into four categories: misplacement problems, rest problems, duty problems, and unassigned problems. The proposed model is an assignment model with side constraints. Due to the stepwise approach, the proposed solution is sub-optimal. Results are presented for a situation from a US airline with 18 problems. This work omits the use of quality costs.
Integrated Recovery: In [4] the author presents two models that considers
aircraft and crew recovery and through the objective function focuses on passenger recovery. They include delay costs that capture relevant hotel costs and ticket costs if passengers are recovered by other airlines. According to the authors, it is possible to include, although hard to estimate, estimations of delay costs to
passengers and costs of future lost ticket sales. To test the models an AOCC simulator was developed, simulating domestic operations of a major US airline. It involves 302 aircrafts divided into 4 fleets, 74 airports and 3 hubs. Furthermore, 83869 passengers on 9925 different passengers’ itineraries per day are used. For all scenarios are generated solutions with reductions in passenger delays and disruptions. The difference regarding our proposal is that we use the opinion of the passengers when calculating the importance of the delay.
In [6] the author presents a Multi-Agent System (MAS) to solve airline operations problems, using specialized agents in each of the three usual dimensions of this problem: crew, aircraft and passengers. However, in the examples presented, the authors ignore the impact that a delay in the flight might have on the decision process and only use operational costs to make the best decision. That is the biggest difference regarding the work we present in this paper.
3 How to quantify quality costs
Overview: The Airline Operations Control Center (AOCC) has the mission of
controlling the execution of the airline schedule and, when a disruption happens (aircraft malfunction, crewmember missing, etc.) of finding the best solution to the problem. It is generally accepted that, the best solution, is the one that does not delay the flight and has the minimum operational cost. In summary, it is the solution that is nearest to the schedule, assuming that the schedule is the optimal one. Unfortunately, due to several reasons (see [9] for several examples), it is very rare to have available solutions that do not delay a flight and/or do not increase the operational cost. From the observations we have done in a real AOCC, most of the times, the team of specialists has to choose between available solutions that delay the flight and increase the operational costs. Reasonable, they choose the one that minimize these two values.
The perception of quality costs: In our observations, we found that some of
the teams in the AOCC, used some kind of rule of thumb or hidden knowledge and, in some cases, they did not choose the solutions that minimize the delays and/or the operational costs. For example, suppose that they have disruptions for flight A and B with similar schedule departure times. The best solution to flight A would cause a delay of 30 minutes and the best solution to flight B would cause a delay of 15 minutes. Sometimes, and when technically possible, they would prefer to delay flight A in 15 minutes and flight B in 30 minutes or more if necessary. We can state that flights with several business passengers, VIP’s or for business destinations correspond to the profile of flight A in the above example. In our understanding this means that they are using some kind of quality costs when taking the decisions, although not quantified and based on personal experience. In our opinion this makes the decision less reliable but that knowledge represents an important part in the decision process and should be included on it.
Quantifying quality costs: To be able to use this information in a reliable
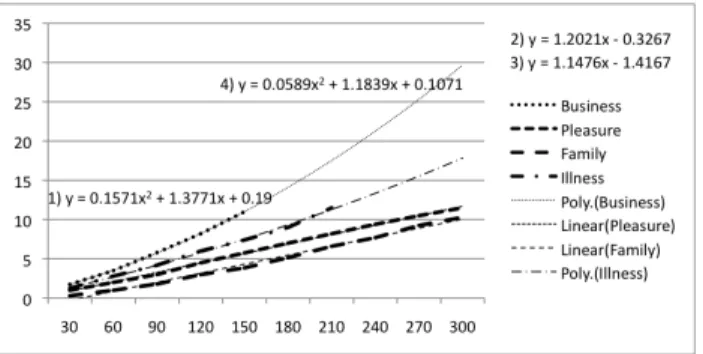
know is how the delay time and the importance of that delay to the passenger are related in a specific flight. It is reasonable to assume that, for all passengers in a flight, less delay is good and more is bad. However, when not delaying is not an opinion and the AOCC has to choose between different delays to different flights, which ones should they choose? To be able to quantify this information, we have done a survey to several passengers on flights of an airline company. Besides asking in what class they were seated and the reason for flying in that specific flight, we asked them to evaluate from 1 to 10 (1 – not important, 10 very important) the following delay ranges (in minutes): less that 30, between 30 and 60, between 60 and 120, more than 120 and flight cancellation. From the results we found four passenger profiles: Business, Pleasure (travelling in vacations), Family (usually immigrants visiting their families) and Illness (travelling due to medical care). To be able to get the information that characterizes each profile we used the airline company database, including relevant database fields like number of business and tourist class passengers, frequent flyer passengers, passengers with special needs, etc. The important information that we want to get from the survey data is the trend of each profile, regarding delay time/importance to the passenger. Plotting the data and the trend we got the graph in figure 1 (x – axis is the delay time and y – axis the importance).
Fig. 1. Delay time versus importance
From the graph in figure 1 it is possible to see the equations that define the trend of each profile. If we apply these formulas as is, we would get quality costs for flights that do not delay. Because of that we re-wrote the formulas. The final formulas that express the importance of the delay time for each passenger profile are presented in table 1. We point out that these formulas should be updated frequently to express any change on the airline company passenger’s profiles.
Table 1. Final quality costs formulas Profile Formula
Business y = 0.16*x2+1.38*x Pleasure y = 1.20*x Family y = 1.15*x Illness y = 0.06*x2+1.19*x
4 Using quality costs in operations recovery
Overview: The MAS we used is a modification of the one used in [6] and
represents the Airline Operations Control Center (AOCC). The development followed the methodology presented in [5]. Some of the Agent/MAS characteristics that make us adopt this paradigm are the following [12]:
Autonomy: MAS models problems in terms of autonomous interacting component-agents, which are a more natural way of representing task allocation, team planning, and user preferences, among others.
Distribution of resources: With a MAS we can distribute the computational resources and capabilities across a network of interconnected agents avoiding problems associated with centralized systems.
Scalability: A MAS is extensible, scalable, robust, maintainable, flexible and promotes reuse. These characteristics are very important in systems of this dimension and complexity.
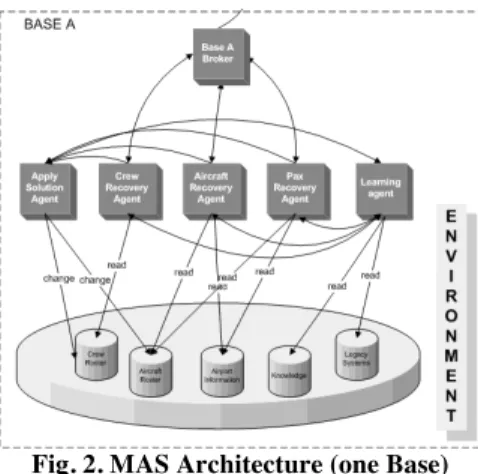
A high-level graphical representation of the MAS architecture is presented in figure 2. The square labeled BASE A shows the part of the MAS that is installed in each operational base of the airline company. Each operational base has its own resources that are represented in the environment. Each operational base has also software agents that represent roles in the AOCC. The Crew Recovery, Aircraft Recovery and Pax Recovery are sub-organizations of the MAS dedicated to solve crew, aircraft and passengers problems, respectively. The Apply Solution Agent applies the solution found and authorized in the resources of the operational base.
Fig. 2. MAS Architecture (one Base)
Architecture and Specialized Agents: The MAS sub-organizations have their
own architecture with their specialized agents. Figure 3 shows the architecture for Crew Recovery in a UML diagram according to the notation expressed in [5]. The architecture for Aircraft Recovery and Pax Recovery are very similar.
Fig. 3. Crew recovery architecture
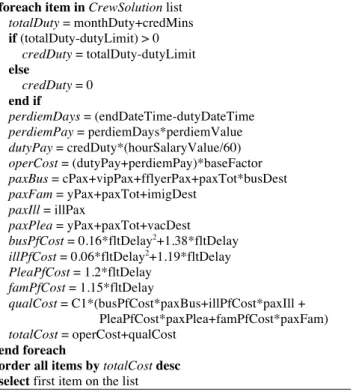
The agent class OpMonitor is responsible for monitoring any crew events, for example, crewmembers that did not report for duty or duties with open positions, that is, without any crewmember assigned to a specific role on board (e.g., captain or flight attendant). When an event is detected, the service MonitorCrewEvents will initiate the protocol inform-crew-event (FIPA Request) informing the OpCrewFind agent. The message will include the information necessary to characterize the event. This information is passed as a serializable object of the type CrewEvent. The OpCrewFind agent detects the message and will start a CFP (call for proposal) through the crew-solution-negotiation protocol (FIPA contractNET) requesting to the specialized agents HeuristicAlgorithm, AlgorithmA and AlgorithmB (or any other that is implemented and deployed in the MAS) of any operational base of the airline company, a list of solutions for the problem. Each agent implements a different algorithm specific for this type of problem. When a solution is found a serializable object of the type CrewSolutionList is returned in the message as an answer to the CFP. The OpCrewFind agent collects all the proposals received and chooses the best one according to the algorithm in Table 2. This algorithm is implemented in the service SendCrewSolution and produces a list ordered by total cost that each solution represents. The computed values in the algorithm in Table 2 are the following:
TotalDuty: Monthly duty minutes of the crewmember after the new duty. CredDuty: Minutes to be paid case the crewmember exceeds the duty limit. DutyPay: Cost of duty computed according to the hour salary of the crewmember. PerdiemDays: Days of work for the specific duty.
PerdiemPay: Cost of duty computed according to the perdiem value
BaseFactor: If the crew belongs to the same operational base where the problem
happened, the value is one. Otherwise, it will have a value greater than one.
OperCost: The operational cost of the solution.
PaxFam: The total of passengers in the family profile on the disrupted flight. PaxIll: The total of passengers in the illness profile on the disrupted flight. PaxPlea: The total of passengers in the pleasure profile on the disrupted flight. BusPfCost: The importance of the delay for passengers of the business profile. IllPfCost: The importance of the delay for passengers of the illness profile. PleaPfCost: The importance of the delay for passengers of the pleasure profile. FamPfCost: The importance of the delay for passengers of the family profile. QualCost: The quality cost of the solution.
It is important to point out the use of coefficient C1 in the quality cost formula. The goal of this coefficient is to give a value to the quality costs in the same unit of the operational costs. Operational costs are expressed in monetary units (Euros, Dollars, etc.) because they are direct and real costs. On the other hand, quality costs are not real costs and express a level of satisfaction of the passengers. Besides transforming the quality costs into a monetary unit, airline companies can also use this coefficient to express the importance that this type of cost has in the decision process, by increasing its value.
Table 2. Selection algorithm foreach item in CrewSolution list
totalDuty = monthDuty+credMins if (totalDuty-dutyLimit) > 0 credDuty = totalDuty-dutyLimit else credDuty = 0 end if perdiemDays = (endDateTime-dutyDateTime perdiemPay = perdiemDays*perdiemValue dutyPay = credDuty*(hourSalaryValue/60) operCost = (dutyPay+perdiemPay)*baseFactor paxBus = cPax+vipPax+fflyerPax+paxTot*busDest paxFam = yPax+paxTot+imigDest paxIll = illPax paxPlea = yPax+paxTot+vacDest busPfCost = 0.16*fltDelay2+1.38*fltDelay illPfCost = 0.06*fltDelay2+1.19*fltDelay PleaPfCost = 1.2*fltDelay famPfCost = 1.15*fltDelay qualCost = C1*(busPfCost*paxBus+illPfCost*paxIll + PleaPfCost*paxPlea+famPfCost*paxFam) totalCost = operCost+qualCost end foreach
order all items by totalCost desc select first item on the list
The SendCrewSolution service initiates the protocol query-crew-solution-authorization (FIPA Query) querying the OpManager agent for query-crew-solution-authorization. The message includes the serializable object of the type CrewSolution.
5 Scenario and experiments
Scenario: To evaluate our MAS we have setup the same scenario used by the
authors in [6] that include 3 operational bases (A, B and C). Each base includes their crewmembers each one with a specific roster. The data used corresponded to the real operation of June 2006 of base A. After setting-up the scenario we found the solutions for each crew event using our Crew Recovery Architecture and Specialized Agents of our MAS. As a final step, the solutions found by our MAS were presented to AOCC users to be validated.
Results: Table 3 presents the results that compare our method (method B) with
the one used by the authors in [6], updated with quality costs for a better comparison (method A). We point out that in method A the quality costs were not used to find the best solution. From the results obtained we can see that in average, method B produced solutions that decreased flight delays in 36%. Method B took 26 seconds to find a solution and method A took 25, a 3% increase.
Table 3. Comparison of the results
Method A Method B A/B
Total % Total % % Delay (avg): 11 100 7 64 -36 Time (avg) 25 100 26 103 3 Total Costs: 11628 100 8912 77 -23 Oper. Costs: 3839 100 4130 108 8 Qual. Costs: 7789 100 4782 61 -39
Regarding the total costs (operational + quality), the method B has a total cost of 8912 and method A a total cost of 11628. Method B is, in average 3% slower than method A in finding a solution and produces solutions that represent a decrease of 23% on the total costs. Regarding operational costs, method A has a cost of 3839 and method B a cost of 4130. Method B is 8% more expensive regarding operational costs. Regarding quality costs, method A has a cost of 7789 and method B a cost of 4782. Method B is 38% less expensive regarding quality costs.
6 Discussion and conclusions
Regarding our first hypothesis we were expecting that the inclusion of quality costs would increase customer satisfaction. This is a fairly obvious conclusion. The quality costs we present here measure the importance of flight delays to the passengers and this is one of the most important quality items in this industry. If we decrease delays we are increasing passenger satisfaction.
Regarding hypothesis two we were expecting to increase the passenger satisfaction without increasing significantly (or nothing at all) the operational
costs in a given period. From the results in table 3 we can see that operational costs increased 8% when comparing with the method used by [6]. If we read this number as is we have to say that our hypothesis is false. An 8% increased on operational costs can represent a lot of money. However, we should read this number together with the flight delay figure. As we can see, although method B increased the operational costs in 8% it was able to choose solutions that decrease, in average, 36% of the flight delays. This means that, when there are multiple solutions to the same problem, our method is able to choose the one with less operational cost, less quality costs (hence, better passenger satisfaction) and, because of the relation between quality costs and flight delays, the solution that produces less flight delays.
From this conclusion, one can argue that if we just include the operational costs and the expected flight delay, minimizing both values, the same results can be achieved having all passengers happy. In general, this assumption might be true. However, when we have to choose between two solutions with impact on other flights, which one should we choose? In our opinion, the answer depends on the profile of the passengers of each flight and on the importance they give to the delays, and not only in minimizing the flight delays. Our method takes into consideration this important information when taking decisions.
It is fair to say that we cannot conclude that our MAS will always have this behavior. For that we need to evaluate much more situations, in different times of the year (we might have seasoned behaviors) and, then, find an average value. From the results we can also obtain other interesting conclusions. As in the previous MAS [6] the cooperation between different operational bases has increased. The reason is the same, we evaluate all the solutions found (including the ones from different operational bases where the event happened) and we select the one with less cost. This cooperation is also possible to be inferred from the costs by base.
This paper has presented an improved version of the distributed multi-agent system in [6] as a possible solution to solve airline operations recovery problems, including sub-organizations with specialized agents, dedicated to solve crew, aircraft and passenger recovery problems that take into consideration the passenger satisfaction in the decision process. We have detailed the architecture of our MAS regarding the sub-organization dedicated to solve crew recovery problems, including agents, services and protocols. We have introduced a process of calculating the quality costs that, in our opinion, represent the importance that passengers give to flight delays. We show how, through a passenger survey, we build four types of passenger profiles and, for each one of these profiles, how we calculate a formula to represent that information. We have introduced an updated multi-criteria algorithm for selecting the solution with less cost from those proposed as part of the negotiation process, taking into consideration the quality costs. A case study, taken from a real scenario in an airline company where we tested our method was presented and we discuss the results obtained. We have shown that our method is able to choose solutions that contribute to a better passenger satisfaction and that produce less flight delays when compared with a method that only minimizes operational costs.
References
1. Abdelgahny, A., Ekollu, G., Narisimhan, R., and Abdelgahny, K. 2004. A Proactive Crew Recovery Decision Support Tool for Commercial Airlines during Irregular Operations. Annals of Operations Research 127:309-331.
2. Barnhart, C., Belobaba, P., and Odoni, A. 2003. Applications of Operations Research in the Air Transport Industry. Transportation Science 37:368-391.
3. Bellifemine, F., Caire, G., Trucco, T., and Rimassa, G. 2004. JADE Programmer’s
Guide. JADE 3.3 TILab S.p.A.
4. Bratu, S., and Barnhart, C. 2006. Flight Operations Recovery: New Approaches Considering Passenger Recovery. Journal of Scheduling 9(3):279-298.
5. Castro, A. and Oliveira, E. (2008) ‘The rationale behind the development of an airline operations control centre using Gaia-based methodology’, Int. J. Agent-Oriented
Software Engineering, Vol. 2, No. 3, pp.350–377.
6. Castro, A.J.M., and Oliveira, E. 2007. Using Specialized Agents in a Distributed MAS to Solve Airline Operations Problems: a Case Study. Proceedings of IAT 2007 (Intelligent Agent Technology Conference), pp. 473-476, Silicon Valley, California, USA 2-5 November 2007, IEEE Computer Society, ISBN: 0-7695-3027-3.
7. Clausen, J., Larsen, A., and Larsen, J. 2005. Disruption Management in the Airline Industry – Concepts, Models and Methods. Technical Report, 2005-01, Informatics and Mathematical Modeling, Technical University of Denmark, DTU.
8. Kohl, N., Larsen, A., Larsen, J., Ross, A., and Tiourline, S. 2004. Airline Disruption Management – Perspectives, Experiences and Outlook. Technical Report, CRTR-0407, Carmen Research.
9. Kohl, N., and Karish, S. 2004. Airline Crew Rostering: Problem Types, Modeling and Optimization, Annals of Operations Research 127: 223-257.
10. Rosenberger, J., Johnson, E., and Nemhauser, G. 2001. Rerouting aircraft for airline recovery. Technical Report, TLI-LEC 01-04, Georgia Institute of Technology. 11. Rosenberger, J., Schaefer, A., Goldsmans, D., Johnson, E., Kleywegt, A., and
Nemhauser, G. 2002. A Stochastic Model of Airline Operations, Transportation
Science 36(4):357-377.
12. Wooldridge, M., 2002. When is an Agent-Based Solution Appropriate? Introduction to