1
Universidade do Algarve
Instituto Superior de Engenharia
André Martins Ramos
Dissertation to obtain the degree of
Master of Food Technology
Faro
Non Chemical Natural Organic Matter Removal with a
Contact TiO
2Process
Supervisors (Cranfield University):
Prof. Bruce Jefferson Dr. Peter Jarvis
Supervisors (Algarve University):
Prof. Ana Cristina Figueira
Faro
2014
6
Universidade do Algarve
Instituto Superior de Engenharia
Non Chemical Natural Organic Matter Removal with a
Contact TiO
2Process
Declaração de autoria de trabalho
Declaro ser a autor deste trabalho, que é original e inédito. Autores e trabalhos consultados estão devidamente citados no texto e constam da listagem de referências incluída.
Andre Martins Ramos
Copyright by Andre Martins Ramos. Universidade do Algarve. Instituto Superior de Engenharia.
A Universidade do Algarve tem o direito, perpétuo e sem limites geográficos, de arquivar e publicitar este trabalho através de exemplares impressos reproduzidos em papel ou de forma digital, ou por qualquer outro meio conhecido ou que venha a ser inventado, de o divulgar através de repositórios científicos e de admitir a sua cópia e distribuição com objetivos educacionais ou de investigação, não comerciais, desde que seja dado crédito ao autor e editor.
Faro
2014
7
Acknowledgments
This Master research has been carried out within the Cranfield Water Institute at Cranfield University, United Kingdom.
I wish to thank all the persons belonging to these institutions who contributed to this work.
I want to thank to Prof. Bruce Jefferson, Dr. Peter Jarvis, Dr. Ana Cristina Figueira for the continuous support during all the phases of this project through very stimulating and enlightening discussions, field work and daily encouragements. I am grateful for all the contributions of time, ideas and insight in all circumstances that definitely contributed to the completion of this project.
I would like to express my gratefulness to Dr. Oliver Autin who provided extremely important support in crucial periods of this project. With his calm and professionalism, his supervision always resulted in rich and efficient exchanges.
Miscellaneously, I would like to thank to technical staff, Jane Hubble, Rukhsana Ormesher, Alan Nelson and Christine Kimpton for their help in work lab.
It is a pleasure to thank all the students from the CWI who made this Master Research possible and particularly to Tomas Molnar, Dr. Ana Soares, Dr. Antonio Guerreiro, Francisco Simões, Dr. Catarina Henrique, Dr. Tamas Zsirai, Zhao Zhao, Dr. Joao Souza and Martina Santinelli.
I would like to express also my gratefulness to my special friends Tomas Mólnar, Tamas Zsirai, Francisco Simões, Yerbol Sarbassov, Dr. Joao Souza and Martina Santinelli for the funny moments
I have the chance to have a wonderful and understanding family. Thanks to Fernando Ramos (Dad) and Anabela Ramos (Mom) for your moral support and encouragements along the course of this time in England.
8
9
Resumo
Ramos, A. M. (2014). Remoção de matéria orgânica natural através de adsorção em
dióxido de titânio imobilizado em fluropolimeros. Dissertação de Mestrado em
Tecnologia de Alimentos. Universidade do Algarve. Faro, Portugal.
A produção de água potável a partir de águas naturais superficiais requer a utilização de tecnologias adequadas para uma eficiente remoção de matéria orgânica natural, assim como outros contaminantes. O grande problema do tratamento de água potável está relacionado com a presença de matéria orgânica dissolvida, que em concentrações elevadas, aumenta a necessidade de um aumento de adição de coagulantes, reage com o cloro da desinfeção produzindo sub-produtos clorados, que consequentemente podem promover um aumento no crescimento de bactérias no decurso da distribuição.
A matéria orgânica natural é um termo utilizado para designar todos os compostos orgânicos provenientes de plantas e animais presentes no meio ambiente. Existe uma grande diversidade de substâncias húmicas e não-húmicas nos solos, sedimentos e águas naturais. As características da matéria orgânica natural são influenciadas basicamente por processos biogeoquímicos e envolvidos no ciclo do carbono, tanto no meio terrestre como no meio aquático.
Os componentes principais da matéria orgânica natural são essencialmente substâncias húmicas classificadas como ácido húmico, ácido fúlvico e humina. Estas substâncias húmicas, devido á sua natureza ubíqua têm um papel fundamental no transporte e ligação de poluentes naturais, atuando como percursores de produtos carcinogénicos provenientes da desinfeção durante o processo de cloração nas estações de tratamento de agua potável.
Existem vários estudos para remoção de matéria orgânica natural através da adsorção em diferentes sólidos adsorventes, como carbono ativado, minerais e kaolinite.
Recentemente, a remoção de matéria orgânica natural de água potável através de processos avançados de oxidação, tem atraído grande interesse, pois trata-se de um processo sustentável que proporciona a mineralização da maioria dos contaminantes orgânicos, isto é, os compostos não são apenas adsorvidos mas transformados em CO2,
10 Existem diferentes processos avançados de oxidação, desde a reação de Fenton, ozonização e a fotocatálise por dióxido de titânio, no entanto a propriedade química comum nestes processos é a capacidade de gerar radicais hidroxilo (•OH).
As limitações da aplicação do dióxido de titânio em processos de tratamento de água residem essencialmente no pós-tratamento, nomeadamente na separação de nanopartículas de TiO2 altamente dispersas. Para resolver estas limitações, muitos
estudos têm sido realizados para imobilizar o TiO2 em várias matrizes utilizando
diferentes métodos.
Neste trabalho pretende-se criar um meio imobilizando o TiO2 em diferentes
polímeros (fluoropolímeros) através de fotocatálise, usando uma recção denominada de PSFD. Os fluoropolímeros utilizados foram o fluoreto de polivinilideno (PVDF) e o politetrafluoretileno (PTFE) também conhecido como Teflon.
As primeiros imagens através do microscópio eletrônico foi possivel observar uma melhor cobertura de TiO2 na superfíce do polímero PVDF comparado com o PTFE
(Figuras 4.3 e 4.4). Por esta razão o PVDF foi utilizado para a continuação do trabalho experimental.
Após reação de PSFD, foi possivel verificar que a extensão da cobertura de TiO2
na superfície de PVDF pode ser controlada atraves de pH. As figuras 4.8 a 4.12 mostram que em meio ácido existe maior quantidade de TiO2 na superfície de PVDF
comparado com o meio básico.
Para a avaliar a capacidade de fotodegradação, submeteu-se o meio PVDFf-TiO2
preparado em diferentes soluções de TiO2, de concentração 0.5, 1.5 e 2.5 g/L com
diferentes pH (1,3,5,7 e 10). As figuras 4.14 a 4.17 mostram a curva de degradação do azul metileno. Apenas foram feitos estudos de cinética no meio preparado em meio ácido. Na tabela 4.1 é possível verificar que PVDFf-TiO2 preparado com uma solução
de TiO2 1.5g/L a pH 3, apresenta um capacidade de degradação de azul metileno de
97.58% apos 70 minutos, uma constante de pseudo primeira ordem de 0.054 min-1 e um tempo de meio vida de 12.85 minutos. Segundo as imagens SEM e os resultados de fotodegradação considerou-se serem as melhores condições de preparação para desenvolver o meio para estudos de adsorção.
Em seguida, este meio foi testado em sucessivos testes Jar (300 rpm durante 10 minutos) seguido de fotodegradações de azul de metileno para verificar a robustez do meio, em relação ao tipo de ligação do TiO2 e o polímero PVDF. Os resultados indicam
11 confirmado pelas figura 4.22 e as constantes de pseudo primeira ordem expressas na tabela 4.2.
Após desenvolvimento do meio PVDFf-TiO2 optimizado, este foi utilizado para
adsorver ácido húmico como composto representante de matéria orgânica natural. Foi utilizado tambem TiO2 em pó para adsorver HA de forma a comparar as isotermas de
adsorção e a assim chegar a um valor em massa de TiO2 na superfície do polímero
PVDF (0.813mg de TiO2 por grama de PVDF)(Tabela 4.6).
A isoterma de adsorção de TiO2 em pó com HA é do tipo de Langmuir.
Em relação ao meio PVDFf-TiO2 a adsorção de HA segue os modelos de
Freundlich e Langmuir.
Os resultados da linerarização de Langmuir indicam uma capacidade de adsorção de 0.014 mg de HA por grama de PVDF. A constante b de Langmuir indica uma afinidade de 0.184 L/mg. (Tabela 4.4) Os valores RL abaixo de 1 indicam que a
adsorção de ácido húmico em PVDFf-TiO2 é favorável (Tabela 4.5)
Em relação a linerarização de Freundlich, os parametros indicam uma capacidade adsortiva de 0.0019 (L/mg) e uma intensidade (n) de 1.44, o que significa uma adsorção favorável (Tabela 4.4).
Baseado na isoterma de adsorção de ácido húmico no meio PVDFf-TiO2 foram
efectuados 8 ciclos de adsorção e seguido de 120 minutos de regeneração do meio por luz UV entre ciclos.
De acordo com a figura 4.35, o meio PVDFf-TiO2 mantém a sua estabilidade de
adsorção durante os 8 ciclos pois as curvas de adsorção são muito semelhantes.
Na figura 4.36 é possível verificar que o meio PVDFf-TiO2 mantém a sua
capacidade de adsorção, com um valor médio de 0.014 mg de HA por grama de PVDFf -TiO2.
De acordo com estes resultados experimentais, procedeu-se ao desenvolvimento de uma coluna de adsorção para avaliar futura aplicação na índustria da água.
Uma solução de HA (5 mg/L) foi introduzida na coluna no sentido ascendente com diferentes caudais 10.40, 5.19, 3.25, 2.60, 1.30 mL/min.
A figura 4.37 mosta as curvas de ruptura onde é possivel verificar que a medida que aumenta o caudal diminui a remoção de HA. Através do tratamento de resultados a melhor remoção de HA é de 0.42% para um caudal de 1.30 mL/min (Tabela 4.7).
13
Abstract
Ramos, A. M. (2014). Non chemical natural organic matter removal with a contact TiO2
process. Master in Food Technology. Algarve University, Faro, Portugal.
The current work looked for a new media to remove natural organic matter by adsorption on TiO2 nanoparticles bound to fluoropolymers beads through photocatalysis. The work
investigated the best methods of production as well the effectiveness of the media thus providing insight into its potential for further adsorption technology development.
The results obtained lead to the conclusion that is possible to immobilize TiO2 on a
PVDF surface by UV-V, resulting in a photocatalytic surface deposition functionalization. The extended of the PSFD reaction can be controlled by adjusting the pH, with acidic conditions increasing the extension of surface coverage.
The polymer with significant results was PVDF, based on SEM figures, MB photodegradation (97.58 %), Kapp (0.054 min-1) and t1/2 (12.85 min) the optimum conditions
to increase surface coverage of PVDF is a solution of 1,5 g/L of TiO2 pH 3 under 2 h on UV
collimated beam.
The photocatalytic activity of PVDFf-TiO2 following Jar tests suggests a very strong
electrostatic bond between the TiO2 and the polymer surface.
The adsorption of HA onto PVDFf-TiO2 was found to be well described by both the
Langmuir and Freundlich models. The maximum adsorption capacity (qmax) was 0.0149
mg/g and the parameters n and KL show a favorable adsorption.
Fixed-bed adsorption column studies was developed to remove HA from water, using a fixed bed height of 17 cm, a fixed feed concentration of 5mg/L but different flow rates. Results show that for lower flows there is a higher removal as compare with a higher flow. The best result obtained was 0.42% of HA removal with a feed flow of 1.30 mL/min.
14
Index
Acknowledgments... 7 Resumo ... 9 Abstract ... 13 Figures Index ... 18 Tables Index ... 21 Glossary ... 22 1. Literature review ... 241.1. Drinking water and natural organic matter (NOM) ... 24
1.2. Removal of NOM by Advanced Oxidation Processes (AOPs) ... 24
1.2.1. Heterogeneous photocatalysis ... 25 1.2.2. TiO2 Photocatalysis ... 26 1.2.3. Photoxidation of pollutants ... 29 1.3. Adsorption ... 30 1.3.1. Langmuir isotherm ... 31 1.3.2. Freundlich isotherm ... 32
1.3.3. Humic acid removal by adsorption ... 33
1.4. Immobilization of Titanium dioxide ... 34
1.4.1. Polyvinylidene fluoride ... 34
1.4.2. Polytetrafluoroethylene ... 35
1.5. Scanning electronic microscopy (SEM) ... 35
1.6. Fixed - bed Adsorption column ... 36
1.6.1. Analysis of column data... 37
2. Aims of the present work... 38
3. Materials and Methods ... 39
3.1. Materials ... 39
3.1.1. Polymers ... 39
15 3.2.3. Instrumentation ... 39 3.2. Methods ... 41 3.2.1. Media preparation ... 41 3.2.2. Media performance ... 42 3.2.3. Adsorption experiments ... 43 4.1 Media preparation ... 47
4.1.1. Observation of PVDF and PTFE surfaces under SEM ... 47
4.1.2. Photocatalytic surface functionalization deposition of TiO2 into PVDF and PTFE surfaces ... 48
4.1.3. Influence of UV light distance (100 mm e 230 mm) ... 50
4.1.4. Scanning electron microscopic images of PVDFf-TiO2 at different pH ... 51
4.2. Media Performance ... 55
4.2.1. Photodegradation of methylene blue using PVDFf - TiO2 prepared at different concentrations and pH of TiO2 solutions ... 55
4.2.2. Evaluation of photocatalytic activity of PVDFf-TiO2 after centrifugations in Jar test apparatus ... 62
4.2.3. Blanks ... 64
4.3. Humic acid adsorption ... 67
4.3.1. Adsorption isotherm of humic acid on TiO2 powder ... 67
4.3.2. Adsorption isotherm of humic acid on PVDFf - TiO2 media prepared with optimized conditions (1.5 g/L, pH=3) ... 68
4.3.3. Calculation of the mass TiO2 per gram of PVDF based on adsorption capacities .... 72
4.3.4. Blanks ... 73
4.5. Photodegradation and adsorption of humic acid in PVDFf - TiO2 media ... 73
4.5.1. Determination of regeneration time ... 73
4.5.2. PVDFf- TiO2 Adsorption stability ... 75
4.6. Adsorption column ... 76
16 6. Suggestions for future work ... 79 7. References ... 80 8. Annex... 88
18
Figures Index
Figure 1.1 – Schematic photo-excitation in a semiconductor particle 26 Figure 1.2 – Schematic illustration for energetics and primary reaction mechanism of TiO2 photocatalysis
28
Figure 1.3 – Adsorption mechanism 30
Figure 1.4 – Chemical structure of PVDF 34
Figure 1.5 – Chemical structure of PTFE 35
Figure 1.6 – Example of a breakthrough curve 37
Figure 3.1 – Collimated beam UV light reactor a) and associated controller b) 39 Figure 3.2 –Scanning electron microscope (SEM)- Philips/FEI XL 30 SFEG 40 Figure 3.3 – Photodegradation of Methylene Blue 42
Figure 3.4 –Fixed-Bed adsorption column 45
Figure 3.5 – Schematic overview of the adsorption column – A) Fixed-bed adsorption column B) Outlet container C) Watson Marlow 520S pump, UK D) Inlet container (Feed concentration of HA = 5 mg/L)
46
Figure 4.1 – PVDF surface (x5000) 47
Figure 4.2 – PTFE surface (x5000) 47
Figure 4.3 – Scanning electron microscopic image of PVDFf-TiO2 prepared with a 1.5
g/L TiO2 solution at pH 3 (UV time = 2h, light distance = 100mm) (x5000)
48 Figure 4.4 – Scanning electron microscopic image of PTFEf-TiO2 prepared with a 1.5
g/L TiO2 solution at pH 3(UV time = 2h, light distance = 100mm) (x5000)
48 Figure 4.5 – Scanning electron microscopic image of a) PVF b)PVFf-TiO2 prepared at
pH 5 (external side) c) PVFf-TiO2 prepared at pH 5 (internal side)
49 Figure 4.6 – Scanning electron microscopic image of PVDFf-TiO2 prepared with a 1.5
g/L TiO2 solution at pH 3(UV time = 2h, light distance = 100mm) (x5000)
50 Figure 4.7 – Scanning electron microscopic image of PVDFf-TiO2 prepared with a 1.5
g/L TiO2 solution at pH 3(UV time = 2h, light distance = 230mm) (x5000)
50 Figure 4.8 – PVDF surface after PSFD with TiO2 (1.5 g/L at pH = 1) (x5000) 51
Figure 4.9 – PVDF surface after PSFD with TiO2 (1.5 g/L at pH = 3) (x5000) 52
Figure 4.10 – PVDF surface after PSFD with TiO2 (1.5 g/L at pH = 5) (x5000) 52
Figure 4.11 – PVDF surface after PSFD with TiO2 (1.5 g/L at pH = 7) (x5000) 53
Figure 4.12 – PVDF surface after PSFD with TiO2 (1.5 g/L at pH = 10) (x5000) 53
19
deposition as function of pH
Figure 4.14 – Photodegradation of Methylene blue – PVDFf- TiO2 prepared at pH = 1 57
Figure 4.15 – Photodegradation of Methylene blue – PVDFf- TiO2 prepared at pH = 3 57
Figure 4.16 – Photodegradation of Methylene blue – PVDFf- TiO2 prepared at pH = 5 58
Figure 4.17 – Photodegradation of Methylene blue – PVDFf- TiO2 prepared at pH = 7 58
Figure 4.18 – Pseudo-first-order kinetics – PVDFf-TiO2 prepared at pH = 1 60
Figure 4.19 - Pseudo-first-order kinetics – PVDFf-TiO2 prepared at pH = 3 60
Figure 4.20 - Pseudo-first-order kinetics – PVDFf-TiO2 prepared at pH = 5 61
Figure 4.21 – Photodegradation of Methylene blue –( PVDFf- TiO2 submitted to three
centrifugations
62
Figure 4.22- Surface analysis of PVDFf- TiO2 (1.5 g / L prepared at pH = 3) and after three centrifugations. Clockwise from top left: a) x1000 b) x5000 c) x35000 d) x70000 63 Figure 4.23– Pseudo-first order kinetics – PVDFf-TiO2 after three consecutive
centrifugations
64
Figure 4.24– Blanks tests to assess the photocatalytic capacity of the media PVDFf-TiO2 65
Figure 4.25 –Photodegradation capacity of PVDF+TiO2 (1.5 g / L pH = 3) a) prepared
without UV light (dark) b) and subjected to three consecutive centrifugations.
66
Figure 4.26– Surface Analysis of PVDF + TiO2 (1.5 g / L at pH = 3) a) prepared
without UV light b) subjected to three centrifugations
66
Figure 4.27– Adsorption isotherm of HA on TiO2 at pH 5; qe (mg/g) is the concentration
of HA adsorbed per gram of TiO2 determined by UV-Vis spectroscopy at 254 nm; Ce
(mg/L) is mass concentration of HA at the equilibrium, according to the Langmuir model 67
Figure 4.28–Linear plot of Langmuir isotherm for adsorption of HA onto PVDFf-TiO2 68
Figure 4.29–Adsorption isotherm of HA on PVDFf - TiO2; qe (mg/g) is the
concentration of HA adsorbed per gram of PVDFf - TiO2 determined by UV-Vis
spectroscopy at 254 nm; Ce (mg/L) is HA mass concentration at the equilibrium, according to the Langmuir model
69
Figure 4.30– Linear plot of Langmuir isotherm for adsorption of HA onto PVDFf-TiO2 69
20
Figure 4.32 –Adsorption of humic acid in PVDF polymer pellets and 0,22 μm filters
73 Figure 4.33– Photodegradation of Humic acid with PVDFf-TiO2 media 74
Figure 4.34 – Schematic illustration of the possible structure of meso – TiO2/SAC and
adsorption and photocatalytic degradation of HA by meso – TiO2/SAC
74
Figure 4.35 – Adsorption isotherms stability of HA on PVDFf-TiO2 showing 8 cycles
with 120 min regeneration time per cycle
75 Figure 4.36 - Adsorption capacity of PVDFf- TiO2 showing 8 cycles with 120 minutes
regeneration time per cycle 75
Figure 4.37- Breakthrough curves of HA on PVDFf-TiO2 77
21
Tables Index
Table 4.1 – Photodegradation of methylene blue (%) and Pseudo-first-order kinetics parameters
61
Table 4.2 - Photodegradation (%) and Pseudo-first-order kinetics parameters 64 Table 4.3 –-Adsorption constants for humic acid on TiO2 according to the Langmuir
model
67
Table 4.4– Langmuir and Freundlich constants and regression coefficients for the adsorption of humic acid on the surface of PVDFf-TiO2
71
Table 4.5 –Dimensionless Constant separation factor RL for the adsorption of HA on
PVDFf-TiO2
72
Table 4.6–Mass of TiO2 (mg) per gram of PVDF 72
22
Glossary
AOP – Advanced oxidation process;
b (or Ka) – Langmuir adsorption constant (L/mg) BSE – Back scatter electron detector
CB – Conduction Band;
Ce - Adsorbate equilibrium concentration (mg/L) Ci - initial concentration of the reactant (mg/L)
C0 – Adsorbate initial concentration (mg/L)
C - Concentration of the reactant at time t (mg/L) EBCT – Empty Bed Contact time (min.)
EDX – Energy dispersive X- ray; Eg – Band gap Energy
FA – Fulvic acid;
F – Flow of adsorbate (mL/min)
h+ - Electron holes HA – Humic acid;
Kf – Freundlich Isotherm constant for adsorption capacity (L/mg)
Kapp - apparent-first-order rate constant (min-1)
m - Adsorbent mass (g) MB – Methylene blue;
n – Freundlich isotherm constant for adsorption intensity
NOM – Natural organic matter;
PSFD – Photocatalytic surface functionalization deposition; PTFE – Polytetrafluoroethylene;
23 PVDF - Polyvinylidene fluoride;
PTFEf-TiO2 – Photocatalytic surface functionalization deposition of TiO2 into PTFE surface;
PVDFf-TiO2 – Photocatalytic surface functionalization deposition of TiO2 into PVDF surface;
q - Mass of solute adsorbed per mass of adsorbent (mg / g) – adsorption capacity qmax – Maximum adsorption capacity (mg/g)
R2 – Correlation coefficients RL – Separation factor
SE – Secondary electron detector; SEM - Scanning electron microscope t = time (min)
t1/2 – Half life time (min)
tb – Breakthrough time (min.)
ts – Saturation time (min.)
TOC – Total organic carbon
THMFP – Trihalomethane formation potential UV – Ultraviolet radiation
UVC – Ultraviolet radiation (280-100nm) UV – V- Ultraviolet/Visible radiation V -Solution volume (L)
VB – Valence band
VUV – Vacuum ultraviolet radiation
Greek symbols:
h – Planck’s constant v – Frequency
24
1. Literature review
1.1. Drinking water and natural organic matter (NOM)
The quality of drinking water is a key indicator for assessing the level of development of a country and the welfare of its population.
Disinfection of drinking water is essential to prevent the transmission of diseases, both in developing and industrialized countries. The production of drinking water from natural surface water requires the use of technologies for the efficient removal of natural organic matter (NOM) as well as other contaminants. The major problem of the treatment of drinking water is related to the presence of dissolved organic matter at high concentrations, which increases the need for increased addition of coagulant , which reacts with chlorine disinfection producing chlorinated by-products, which in turn may promote a regrowth of bacteria during the distribution (Humbert et al., 2008).
The NOM is a term applied to all organic compounds from plant or animal origins that are present in the environment. There is a wide variety of humic substances and non-humic soils, sediments in natural waters. The characteristics of NOM are influenced primarily by biogeochemical processes involved in the carbon cycle, both on land and in water (Mori et al., 2013);(Uyguner & Bekbolet, 2004).
The main components of natural organic matter are mainly humic substances classified as humic acid (HA), fulvic acid (FA) and humin. These humic substances, due to its ubiquitous nature, have a key role in the transport and binding of natural pollutants, acting as precursors of carcinogenic products during disinfection, the chlorination steps in drinking water treatment (Uyguner & Bekbolet, 2011).
The humic substances are composed of a variety of aliphatic, aromatic, different functional groups, with and without electric charges, different sizes and molecular structures (Matilainen & Sillanpää, 2010);(Matilainen & Sillanpää, 2011).
1.2. Removal of NOM by Advanced Oxidation Processes (AOPs)
Recently, the removal of NOM from potable water through advanced oxidation processes (AOPs) have attracted a great interest, because it is a sustainable process and provides the majority of the mineralization of organic contaminants, since the compounds are not only adsorbed but also transformed into CO2, H2O and inorganic anions (Andreozzi, et
25 al., 1999).
AOPs are divided in homogeneous processes, where the reactants and catalysts are in the same phase and heterogeneous processes where catalysts and reagents are in different phases. Heterogeneous processes are the most commonly used because it’s easier to recover the products from reactants (Goetz et al., 2009).
The results of various studies dealing with NOM removal by AOPs are always study specific depending on the water’s characteristics, namely the amount of organic matter. Therefore, the characterization of NOM in water should be made before the design and optimization of the AOP treatment. Furthermore, in order to assess its influence on the downstream processes, it is important to determine the organic characteristics of the treated water (Bundaleski et al., 2010).
AOPs have been studied intensively for decades. Various combinations of oxidants, radiation and catalysts have been developed for the removal of NOM and organic pollutants, e.g. O3/H2O2, UV/ H2O2, UV/O3, UV/TiO2, Fe2+/ H2O2, Fe2+/ H2O2 + hv, vacuum ultraviolet
(VUV) radiation or ionizing radiation. These processes involve the generation of highly reactive radical intermediates, especially the •OH radical (Bayarri et al., 2007);(Wiszniowski et al., 2003).
1.2.1. Heterogeneous photocatalysis
The heterogeneous photocatalysis involves the activation of a metal oxide semiconductor by a light source (either sunlight or artificial light). These semiconductors when acting as photocatalysts have two energy regions: the region of lower energy, which correspond to the valence band (VB), where the electrons do not a have free movement and the region of higher energy, which is the conduction band (CB) where the electrons are free to move throughout the crystal, producing an electrical conductivity similar to a metal (Goetz et al. 2009); (Mazille et al., 2009); (Shen et al., 2012)
Between these two regions there is a band gap region. The band gap energy (Eg) is the minimum energy required to excite an electron and promote it from the valence band to the conduction band. A schematic representation of the semiconductor particle is represented in Figure 1.1 and shows the absorption of photons with energy higher than the energy of the band gap resulting in the promotion of an electron from the valence band to the conduction band, generating electron holes (h+) in the valence band. (Oliveira & Silveira, 2011)
26 Figure 1.1 – Schematic photo-excitation in a semiconductor particle (Yates, 2009)
1.2.2. TiO2 Photocatalysis
The Photocatalytic process requires a metallic oxide semiconductor as a catalyst and oxygen as the oxidizing agent. Many metallic oxides have been used; however titanium dioxide has excellent features such as being (Shen et al., 2012);(Gómez-Solís et al., 2012):
a) Photoactive;
b) Excited with visible light and / or ultraviolet light; c) Biologically and chemically inert;
d) Greater stability; e) Low cost;
f) Nontoxic; g) Photo-stable;
This thesis mainly focuses on TiO2 as a catalyst, the physicochemical properties are summarized
27 Table 1.1- Physicochemical properties of TiO2 – Degussa P25
Property Degussa P-25 Physical state White powder
Composition ≈ 80 (anatase)
≈ 20 (rutile)
Density (g L-1) 3.8
BET surface area (m2g-1) ≈55 Average primary particle size (nm) ≈30 pH in aqueous solution 3-4 Contents: SiO2 (%) Al2O3 (%) Fe2O3 (%) TiO2 (%) HCl (%) <0.2 <0.3 <0.01 >97 <0.3 Calcining losses (%) <2 (1000C) Porosity Non-porous Volatiles (%) ---
Titanium dioxide when irradiated with electromagnetic radiation with an energy equal or higher to the band gap (Eg = hv ≥ 3.2 eV) begins the process of photoactivation, which generates electron-hole pairs (Equation 1.1). (Houas et al., 2001)
Equation 1.1
The electrons with high reduction capacity, promote the reduction of dissolved oxygen producing an ion superoxide radical O2• -and the holes promote the oxidation of adsorbed H2O and OH- into the reactive hydroxyl radical (•HOad).(Equation 1.2)(Houas et al., 2001)
These reactions are extremely important in the processes of oxidative degradation due Equation 1.2
28 to the high concentration of HOad- and H2O adsorbed on the surface of titanium dioxide
particles (Figure 1.2) (Andreozzi et al.,1999)
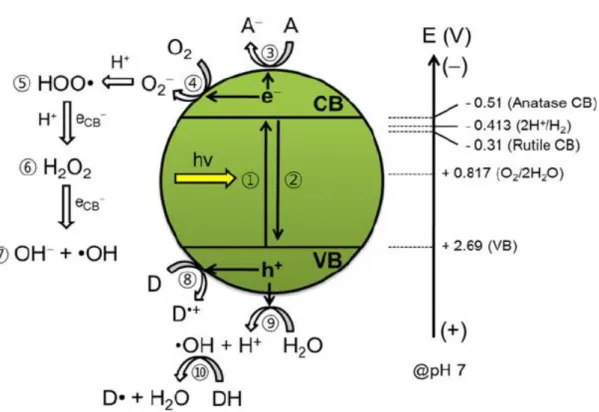
Figure 1.2 - Schematic illustration for energetics and primary reaction mechanism of TiO2
photocatalysis. 1: Bandgap (Eg) excitation and electron-hole charge pair creation, 2: the
charge pair recombination, 3: electron transfer to electron acceptor (A: usually dissolved oxygen), 4: electron transfer to oxygen molecule, 5: formation of hydroxyperoxyl radical via reductive pathaway, 6: formation of hydrogen peroxide, 7: formation of hydroxyl radical, 8: hole transfer to electron donor (D: usually organic pollutants), 9: hole transfer to surface hydroxyl group to generate OH radical, 10: hydroxyl radical-mediated oxidation of organic substrate. Note that the energy levels (right arrow) shift according to the Nernst equation. (Park, et al., 2012)
29
1.2.3. Photoxidation of pollutants
The photodegradation kinetics of many organic compounds in TiO2 suspensions under
UV illumination has often been modelled to the Langmuir-Hinshelwood mechanism confirming the heterogeneous catalytic character of the system. The Langmuir-Hinshelwood kinetics equation (Equation 1.8) can be expressed as follows (Li et al., 2006) (Kasanen et al., 2011)(Sauer et al., 2002) (Senthilkumaar et al., 2006):
Equation 1.3
Integration of this equation will lead to the expected relation of (Pseudo first order reaction equation 1.9):
ln Ci/C = Kapp.t Equation 1.4
Wherein:
r = pseudo first order rate
Ci = initial concentration of the reactant (mg/L)
Kapp - apparent-first-order rate constant (min-1
)
C = concentration of the reactant at time t (mg/L) t = time (min)
The half-life time (minutes) is the amount of time required to reduce a reactant to half of its initial value and is calculated by equation 1.5 (Bekbolet et al., 2002)
t 1/2=0.693/Kapp Equation 1.5
The titanium dioxide acts as a photocatalyst agent who combines the two reactants (oxygen and light) to promote the degradation of the pollutant. As a definition, photocatalysis is a process in which a chemical reaction is initiated by ultraviolet, visible or infrared light being absorbed by a photocatalyst, promoting a chemical change in the reactants. (Banerjee, Dasgupta, and De 2007);(Bizani et al. 2006);(Q. Li et al. 2011)(Páez et al. 2011). During this process it is important to consider the following steps:
30 a) Diffusion of reactants dispersed in the solution to the surface of the catalyst;
b) Adsorption of at least one of the reagents; c) Reaction in the adsorption phase;
d) Removal of products from the interface;
Therefore adsorption and photocatalysis are highly interrelated because both occur on the surface of the particles (Silva, 2008)
1.3. Adsorption
Adsorption is a phase transfer process which is widely used to remove substances from a fluid (either gas or liquid). The definition includes deposition adsorption / enrichment of a chemical species from a fluid phase to the surface of a liquid or solid. In water treatment, adsorption is widely used as a process for removing a variety of solutes. Molecules or ions are removed from an aqueous phase by adsorption on solid surfaces. These surfaces are characterized by strong active sites capable of interacting with solutes in the aqueous phase due to their specific electronic and spatial properties (El-Sharkawy et al., 2007).
According to the adsorption theory, the solid material that provides the surface for adsorption is referred to as adsorbent; the species that will be adsorbed is named adsorbate (Figure 1.3). By changing the conditions of the liquid phase (e.g. concentration, temperature, pH) the adsorbed species can be released from the surface and transferred back into the liquid phase. This reverse process is referred to as desorption (Kaewprasit et al., 1998).
Figure 1.3 – Adsorption mechanism (Worch 2012)
There are different models to describe the adsorption mechanism. In the present work two methods were used to describe the experimental data: Freundlich and Langmuir (Valente et al., 2006); (Xue et al., 2011)
31 The amount of adsorbed substance (qe) is calculated using Equation 1.6 as described below:
Equation 1.6
qe = mass of solute adsorbed per mass of adsorbent (mg / g) – adsorption capacity
C0 = adsorbate initial concentration (mg/L)
Ce = adsorbate equilibrium concentration (mg/L) V =solution volume (L)
m = adsorbent mass (g)
The Langmuir isotherm (Equation 1.7) and Freundlich isotherm models (Equation 1.8) can be used to describe the experimental data obtained from the adsorption curve.
1.3.1. Langmuir isotherm
The Langmuir isotherm assumes monolayer adsorption onto a surface containing a finite number of adsorption sites of uniform strategies with no transmigration of adsorbate in the plane surface. Once a site is filled, no further sorption can take place at that site. This indicates that the surface reaches a saturation point where the maximum adsorption of the surface will be achieved (Khezrianjoo & Revanasiddappa, 2012);(Wan Ngah et al., 2008)
The nonlinear form of the Langmuir is represented by Equation 1.7:
Equation 1.7
The linear plot of specific adsorption (Ce/qe) against the equilibrium concentration (Ce) is represented by Equation 1.8:
Equation 1.8
Wherein:
qe = mass of solute adsorbed per mass of adsorbent (mg / g);
Ce = adsorbate equilibrium concentration (mg/L)
32 qmax = constant that represents the monolayer deposited per g adsorbent (mg of adsorbate per
gram of adsorbent) – Adsorption capacity
b = Ka = adsorption equilibrium constant (known as the Langmuir adsorption constant) related to the affinity of the binding sites (L/mg)
Using Langmuir constant (b), a dimensionless constant termed as separation factor RL
could be calculated according to Equation 1.9:
RL = 1/ (1 + b.C0) Equation 1.9
Where C0 is the initial concentration of adsorbate in water (mg/L). Depending on the
values of RL, the adsorption can be favorable, unfavorable or irreversible. The values of RL
from 0 to 1 are favorable. When a value is greater than 1 the adsorption is unfavorable and zero signifies an irreversible adsorption. (Dutta et al., 2009)
1.3.2. Freundlich isotherm
The Freundlich isotherm assumes the existence of a multilayer structure and provides an exponential distribution of various adsorption sites with different energies. It is used to describe the equilibrium in heterogeneous surfaces and does not assume monolayer adsorption. (Chen et al., 2012);(Tahiri Alaoui et al., 2009);(Xue et al., 2011)
The nonlinear form of the Freundlich model is represented by Equation 1.6:
Equation 1.10
The linear plot of specific adsorption (log qe) against the equilibrium concentration (log
Ce) is represented by Equation 1.7:
Equation 1.11
Representing graphically log qe vs. log Ce, we obtain a straight line where 1/n is the
slope and log Kf is the intercept.
f
33 Wherein:
qe = mass of solute adsorbed per mass of adsorbent (mg / g);
Ce = adsorbate equilibrium concentration (mg/L)
Kf = Freundlich isotherm constant for adsorption capacity (L/mg)
n = Freundlich isotherm constant for adsorption intensity
Freundlich constants, Kf and n correspond to the adsorption capacity and the adsorption
intensity, respectively. The higher the value of K f is the higher is the adsorbent loading that
can be achieved. The n value indicates the degree of nonlinearity between the solution concentration and the adsorption, as follows: if n=1, then adsorption is linear; if n<1, then adsorption is a chemical process; if n>1, then adsorption is a physical process (Doulia et al. 2009);(Dutta et al. 2009); (Gürboğa and Tel., 2005); (Tahiri Alaoui et al. 2009).
1.3.3. Humic acid removal by adsorption
Among processes employed in water treatment, adsorption is an important method with high removal efficiency and no harmful by-products. Many kinds of adsorbents have been developed for the removal of humic acid from water. Previous research has suggested that activated carbon (Goetz et al., 2009), as well as resins (Humbert et al., 2008) and biopolymers (chitosan) (Matilainen et al., 2011), can be reasonably used in order to remove humic acid from water. Activated carbon exhibits a high surface area and a high adsorption capacity but it is very expensive, has high operation costs, and requires frequent regeneration. Recently the usage of natural mineral sorbents for wastewater treatment is increasing because of their abundance and low price (Matilainen et al., 2011)(Humbert et al. 2008)(Qi et al., 2008).
Among these adsorbents, nano scaled TiO2 appears to be a more prominent adsorbent,
due its regenerative characteristics. The TiO2 could be simply regenerated by UV light
irradiation via photocatalytic oxidation process for reuse. However, it is very difficult to recover the nano scaled TiO2 from treated water, due the size limitation. Some researchers
have reported the use of nano structured TiO2 microsphere to be incorporated with membrane
filtration for drinking water production. This hybrid process could provide the drinking water with high quality to meet the stringent drinking water standards and lower the overall water treatment costs. Such hybrid membrane is able to retain the saturate TiO2 microsphere
adsorbent which prevents fouling caused by HA and at the same time, upon UV irradiation, the photocatalytic TiO2 microsphere is able to oxidize HA and thus be regenerated for further
34 This thesis follows the same principle but uses TiO2 immobilized by photocatalysis in
fluoropolymers.
1.4. Immobilization of Titanium dioxide
The limitations of applying titanium dioxide in water treatment processes lies essentially in the post-treatment, particularly in the separation of highly dispersed TiO2
nanoparticles. To address these limitations, many studies have been conducted to immobilize the TiO2 into various solid matrices by different methods (Mazille et al., 2009 b).
Matrices such as polymers, fibers, glass beads and ceramic materials are used to immobilize the TiO2 using the sol-gel method. (Hwang et al., 2012)(Mazille et al., 2009
a);(Mori et al., 2013);(Shen et al., 2012)
Mazille et al, 2009 a), report the immobilization TiO2 in PVF films by photocatalytic
surface functionalization deposition (PSFD). In this work it is intended to immobilize the TiO2 by PSFD into different fluoropolymers beads rather on films, to increase the surface
area for HA adsorption. The fluoropolymers used were the Polyvinylidene fluoride (PVDF) and Polytetrafluoroethylene (PTFE).
The immobilization of TiO2 into fluoropolymers can be evaluated by Scanning
electron microscope (SEM) and by the photocatalytic and adsorption capacity with the reaction rate varying proportionally with the coverage (Chen et al., 2007)(Li et al., 2006)(Xue et al., 2011).
1.4.1. Polyvinylidene fluoride
Polyvinylidene fluoride or polyvinylidene difluoride (PVDF) is a partially fluorinated homopolymer which is made by polymerizing vinylidene monomer. The repeat unit is shown below in figure 1.4:
Figure 1.4 –Chemical structure of PVDF (Polymers database, Polymers 2013 Copyright) PVDF is a specialty plastic material in the fluoropolymer family; it is used generally in applications requiring the highest purity, strength, and resistance to solvents, acids, bases and heat and low smoke generation during a fire event. Compared to other fluoropolymers, it has an easier melt process because, of its relatively low melting point of around 177 °C.
35 (Polymers database, Polymers 2013 Copyright, Available in: www. Polymersdatabase.com)
1.4.2. Polytetrafluoroethylene
PTFE which is also known as Teflon is a thermoplastic polymer. It is formed by the radical polymerization of tetrafluoroethyelene. The outside of the polymer consists of a layer of fluorine atoms which repel all other molecules. It is used as the coating in nonstick pans and as a bearing that needs no lubrication. (Polymers database, Polymers 2013 Copyright, Available in: www. Polymersdatabase.com)
Figure 1.5 - Chemical structure of PTFE (Polymers database, Polymers 2013 Copyright)
1.5. Scanning electronic microscopy (SEM)
An SEM micrograph is obtained by scanning a focused electron beam over an electrically conductive sample in vacuum. The interactions of these so-called primary electrons with the sample result in the generation of emitted electrons and photons that can be collected by appropriate detectors to give information on the composition and topography of the sample surface (C. Chen et al. 2007).
SEM (FEI XL 30 SFEG) was applied to analyse the surface morphology PVDF, PTFE, PVDFf-TiO2 and PTFEf-TiO2.
36
1.6. Fixed - bed Adsorption column
The specific mechanisms of adsorption in batch and continuous time systems rely on the diffusive characteristics of the solution and the adsorbent. Although macro transport is responsible for movement through the bed length, micro transport actually controls sorption by movement through the pores of the adsorbent (Hristovski et al., 2007).
The advantages of a fixed bed system include little operator attention, few concentration fines, easy inspection and cleaning for regeneration of adsorbent, and fewer instances of adsorbent particles in the effluent (Hristovski et al., 2007);(Peng et al., 2012).
Disadvantages include the large physical area needed to operate the fixed bed and the higher capital investment (Gürboğa & Tel, 2005).
For the purposes of this research, the fixed bed column was the design chosen.
The adsorption column, or contactor, removes impurities in the feed stream provided there is sufficient contact time between the impurity and the adsorbent (Gupta et al., 2009).
However, the end of the adsorption process is determined by the degree of high purification achieved and depends on the saturation of the adsorbent, the cost, and the environmental evaluation of purity (Uyguner et al., 2011).
The purity of a substance is monitored using a breakthrough curve, which estimates the time required before the sorptive capacity of the sorbent bed is reached, i.e. the bed life of an adsorbent (He et al. 2010).
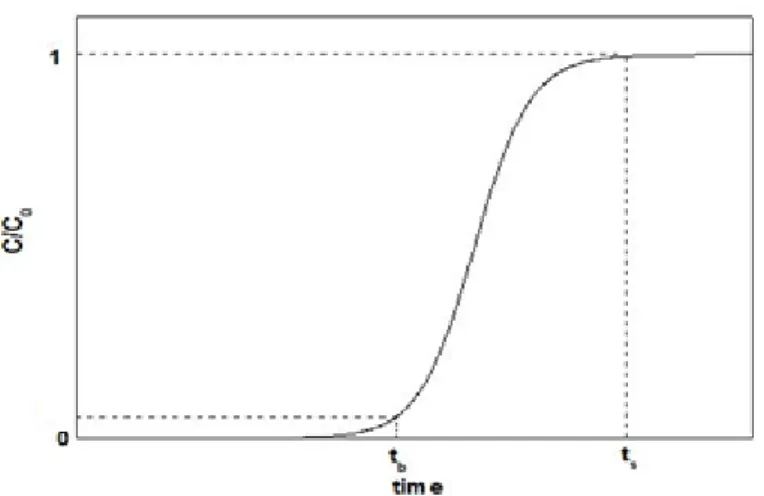
The actual breakthrough curve appears after the breakpoint has been reached and monitors how quickly the exit concentration increases to the feed concentration, indicating little adsorption because the adsorption bed is at equilibrium with the feed concentration. An ideal breakthrough curve, the S-shape, is shown in Figure 1.6. The most important aspect of the breakthrough curve, as idealized in Figure 1.6, is the shape of the breakthrough because it determines the operating life-span of the adsorbent bed and the regeneration time needed for the bed length (He et al., 2010);(Mascolo et al., 2007);(Yu et al., 2012).
The shape of the breakthrough curve is dependent on several parameters, including the feed concentration, the feed flow rate, the size, shape, and type of adsorbent, and the temperature or pressure of the system (Mascolo et al., 2007);(Yu et al., 2012).
37
1.6.1. Analysis of column data
Figure 1.6 – Example of a breakthrough curve (Qi &Schideman, 2008)
From the breaktrough curves it is possible to calculate the breakthrough and saturation times (tb and ts respectively). The breakthrough time indicates the instant in which the
adsorbate is effectively discharged on eluate, and the saturation time corresponds to the instant of adsorbate saturation point. The variation between the breakthrough and saturation times depends on the capacity of the column toward the quantity of applied adsorbate. A more efficient adsorption performance will be obtained as greater is the curve slope, i.e. as smaller is the gap between the breakthrough and saturation times (Qi & Schideman, 2008).
The uptake capacity (Qe) of the adsorbent can be calculated by equation 1.12 (Gürboğa and Tel 2005); (Hristovski, et al., 2007):
Qe = mad/M Equation 1.12
Where Qe is the HA uptake capacity, mad is the mass adsorbed (mg) and M is the
adsorbent mass (g) (Hristovski, et al., 2007); (Gürboğa and Tel 2005).
The total amount of adsorbate (mtotal (g)) sent through the column is calculated by
equation 1.13 (Hristovski, et al., 2007); (Gürboğa and Tel 2005)
mtotal = (C0 . F . ts) /1000 Equation1.13
Where C0 is the inlet concentration of adsorbate (mg/L), F is the flow of adsorbate
(mL/min) and ts is the saturation time (minutes) (Hristovski, et al., 2007);(Gürboğa and Tel
2005). The total removal percent of adsorbate (column performance) is calculated by equation 1.14 (Hristovski, et al., 2007);(Gürboğa and Tel 2005):
38
2. Aims of the present work
The main aims of this project are:
To immobilize TiO2 into fluoropolymers (PVDF and PTFE) pellets by photocatalysis;
To optimize the preparation conditions to obtained maximum surface coverage;
To investigate the photodegradation capacity and immobilization stability characteristics of the media;
To investigate the adsorption capacity and stability of the media for humic acid;
Develop a lab scale fixed bed adsorption column to assess the performance of the media;
39
3. Materials and Methods
3.1. Materials
3.1.1. Polymers
Polymers PVDF and PTFE were purchased in Sigma-Aldrich;
3.2.2. Chemicals reagents
Buffer solutions (pH 1, 3, 5, 7 and 10), Methylene Blue and Humic Acid AnalaR grade were Fisher Scientific, UK, reagents and used as received;
TiO2 P25 (anastase to rutile ratio between 70:30 and 80:20) by Degussa AEROXIDE®; 3.2.3. Instrumentation
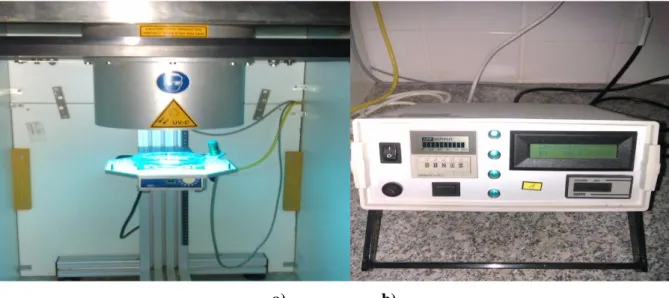
UV collimated beam reactor (Figure 3.1) design by Cranfield University, UK. The reactor consists of a collimated beam UV light, an UV irradiation controller time and a bottle of compressed air. The reactor has the following characteristics:
a) Dimension: 915 mm X 610 mm b) Thickness: 3,0 mm
c) Intensity ( I= 26 W/m2) d) UVC light (280-100 nm) e) Irradiation time = 2 hours
Figure 3.1 – Collimated beam UV light reactor a) and associated controller b)
40
Scanning Electron Microscope – Philips/ FEI SFEG XL30 SEM, UK; (Figure 2.2) The magnification was chosen between 1000 and 70 000 , the accelerating voltage was set to 20.0 kV and the working distance was in the range of 5.0–8.0mm. The resolution for this SEM instrument is 1.7 nm at 1 kV. Equipped with: standard Everhart-Thornley secondary-electron (SE) detector; ultra-high resolution (UHR) lens and in-lens SE detector; 4 quadrant backscattered electron (BSE) detector;
Figure 3.2 –Scanning electron microscope (SEM) – Philips/FEI XL 30 SFEG
Spectrophotometer UV-V Jenway 6715, Bibby Scientific Limited (Group HQ), UK.
Stir CB 161 shaker, Stuart®, UK.
Pump Watson Marlow, model 520S, UK
Plastic column, tubes and fittings purchased at Cranfield University;
Philips & Bird Jar test equipment;
41
3.2. Methods
This work was performed at the Cranfield Water Institute, UK, from 12/09/12 to 26/06/13 and is divided into three distinct phases: Media preparation; Media performance and Adsorption Experiments.
3.2.1. Media preparation
3.2.1.1. Photocatalytic surface functionalization deposition (PSFD) of TiO2 into PVDF and PTFE
Modification of the method described by Mazille, et al., 2009 a, as follows:
PVDF and PTFE pellets were washed with a solution of ethanol and water (1:1, v/v) to remove impurities.
TiO2 solutions were prepared (Degussa P25) with different concentrations 0.5, 1.5 and
2.5 g / L at different pH values (1, 3, 5, 7 and 10).
Then PTFE or PVDF was added to a Petri dish and TiO2 solutions to a thickness of 6
mm to allow the penetration of UV light. Different UV light distances were used, 230 mm and 100 mm.
The Petri dishes were inserted into the UV collimated beam reactor for 2 hours with magnetic stirring.
Scanning Electron Microscope – Philips/ FEI SFEG XL30 SEM, UK (figure 3.2) was used to evaluate fluoropolymers surface morphology.
42
3.2.2. Media performance
3.2.2.1. Evaluation of the photocatalytic activity of PVDFf-TiO2
In a Petri dish with PVDFf-TiO2 (3.0 g) prepared in different solutions of TiO2 was
added 30 mL of methylene blue (MB) with a concentration of 1 mg/L (figure 3.3). Petri dish was inserted in the collimated beam for 70 minutes. Aliquots of 1 mL were taken to evaluate photodegradation over time and MB was monitored by detecting UV absorbance intensity at 660 nm with Spectrophotometer UV-V Jenway 6715, Bibby Scientific Limited (Group HQ), UK. This test was done in triplicate.
Figure 3.3–Photodegradation of Methylene Blue
3.2.2.2. Evaluation of photocatalytic stability after centrifugations in Jar test apparatus
Photocatalytic surface functionalization deposition (PSFD) of PVDF with a 1.5 g/L TiO2
solution at pH 3 (PVDFf-TiO2) was prepared in the collimated beam.
Then the media PVDFf-TiO2 was submitted to 300 rpm centrifugations for 10 minutes in
Philip & Bird Jar test equipment. Then PVDFf-TiO2 was further evaluated according to the
photocatalytic capacity to degrade methylene blue (1 mg/L) during 70 minutes. The experiment was performed in triplicate and Scanning Electron Microscope – Philips/ FEI SFEG XL30 SEM, UK was used to evaluate the surface morphology.
43
3.2.2.3. Blanks
Different blanks were performed:
a) PVDF and MB (1 mg/L) expose to UV light, for 70 minutes.
b) PVDF and MB (1 mg/L) in the dark, for 70 minutes.
c) PVDFf- TiO2 (1.5g/L pH 3) and MB (1 mg/L) in the dark, for 70 minutes;
d) (PVDF + TiO2 1.5 g/L pH =3) prepared in the dark. Following three centrifugations in a
stirrer Jar test apparatus in between photodegradation of methylene blue.
3.2.3. Adsorption experiments
Adsorption experiments were based OECD Guidelines for testing of chemicals, Test No. 106: Adsorption – Desorption using a batch equilibrium Method
3.2.3.1. Adsorption isotherm of HA on TiO2 powder 3.2.3.1.1. Calibration curve
From a stock solution of humic acid (500 mg/L) different solutions were prepared by dilution. A Spectrophotometer UV-V Jenway 6715, Bibby Scientific Limited (Group HQ), UK, was used to construct the calibration curve at wavelength of 254 nm. (Figure 8.1 – Annex I)
3.2.3.1.2. Adsorption of humic acid on TiO2 powder
The affinity of HA to TiO2 was determined by the batch equilibrium experiments
performed in the dark. Research was carried out on a suspension, by mixing 100 mL of various HA concentrations (1.0; 2.0; 4.0; 8.0; 10.0; 15.0; 30.0; 40.0 and 50.0 mg/L) at pH 5 and a fixed amount of TiO2 (0.02g). To determine the isotherm of adsorption, the solutions were kept in a
Stir CB 161 shaker, Stuart®, UK, at 160 rpm and 20ºC. After 24 hours of the samples were removed and filtered using a Millex-GP Filter Unit 0.22 μm. The concentrations were measured by Spectrophotometer UV-V Jenway 6715, Bibby Scientific Limited (Group HQ), UK, at 254 nm.
44
3.2.3.2. Adsorption isotherm of HA on PVDFf-TiO2
The affinity of HA to PVDFf-TiO2 was determined by the batch equilibrium experiments
performed in the dark. Research was carried out on a suspension by mixing 50 mL of various HA concentrations (0.5; 1.0; 2.0; 4.0; 8.0; 10.0; 12.0 and 20.0 mg/L) at pH 5 and a fixed amount of PVDFf-TiO2 (10.0g). To determine the isotherm of adsorption, the solutions were
kept in a Stir CB 161 shaker, Stuart®, UK, at 160 rpm and 20ºC. After 24 hours of the samples were removed and filtered using a Millex-GP Filter Unit 0.22 μm. The concentrations were measured by Spectrophotometer UV-V Jenway 6715, Bibby Scientific Limited (Group HQ), UK, at 254 nm.
3.2.3.3. Photocatalytic degradation of humic acid using PVDFf-TiO2 – Regeneration
time
Humic acid with a concentration of 5mg/L was added to a Petri dish with PVDFf-TiO2. The
petri dish was inserted in the collimated beam for 250 minutes. Aliquots of 1mL were taken to evaluate photo degradation over time and the equilibrium absorbance determined by Spectrophotometer UV-V Jenway 6715, Bibby Scientific Limited (Group HQ), UK, at 254 nm. This test was performed in triplicate.
3.2.3.4. Adsorption stability/Regeneration of PVDFf-TiO2
3.2.3.4.1. Adsorption/ regeneration cicles
The process described in 3.2.3.2 was repeated eight times with a regeneration of 2 hours using the UV reactor.
Adsorption isotherms after 8 adsorption/ regeneration cycles were plotted to evaluate adsorption stability
3.2.3.5. Blanks
Different adsorption blanks were performed to evaluate the adsorption capacity of PVDF and 0.22 µm filter units:
a) Humic acid adsorption on PVDF;
b) Filtration humic acid samples at different concentrations through the filter 0.22µm. Aliquots of 1mL were taken to evaluate photodegradation over time and a Spectrophotometer UV-V Jenway 6715, Bibby Scientific Limited (Group HQ), UK, was used to determine the equilibrium absorbance. This test was performed in triplicate.
45
3.2.3.6. Fixed- bed adsorption column
An adsorption column was developed in order to evaluate the new media (PVDFf-TiO2) for
further application in industry.
PVDFf-TiO2 (mass =1000 g) was packed into a transparent plastic column of 7 cm inner
diameter and 30 cm of height, corresponding to a bed volume of 654.24 cm3 (Figure 3.4). In order to evaluate the adsorption capacity, a solution of HA (5 mg/L) was allowed to percolate through the column from the bottom (up stream flow) at flow rates of 10.4; 5.19; 3.25; 2.60 and 1.30 mL/min, using a Watson Marlow 520S pump, UK (Figure 3.5).
Samples were collected from the exit of the bed column at 10 minutes time intervals and analyzed for HA using a Spectrophotometer UV-V Jenway 6715, Bibby Scientific Limited (Group HQ), UK, to determine the equilibrium absorbance at a wavelength of maximum absorbance of 254 nm. Operation of the column was stopped when the effluent HA concentration exceeded 99.5% of its initial concentration
46 Figure 3.5 – Schematic overview of the adsorption column – A) Fixed-bed adsorption column B) Outlet container C) Watson Marlow 520S pump, UK D) Inlet container (Feed concentration of HA = 5 mg/L)
A B
47
4. Results and discussion
4.1 Media preparation
4.1.1. Observation of PVDF and PTFE surfaces under SEM
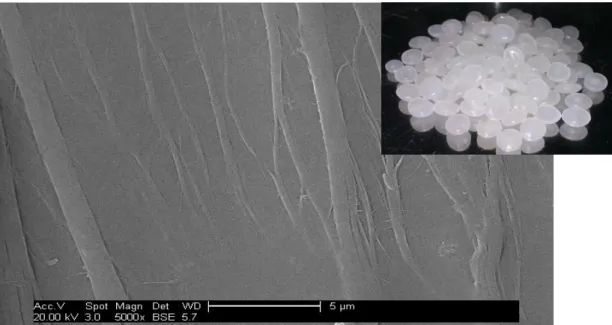
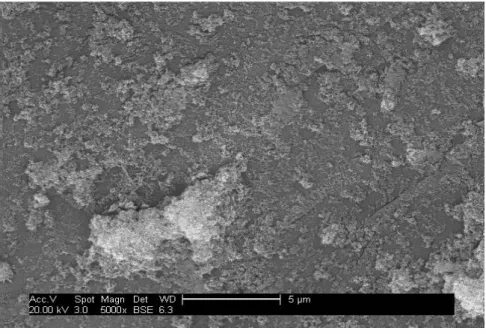
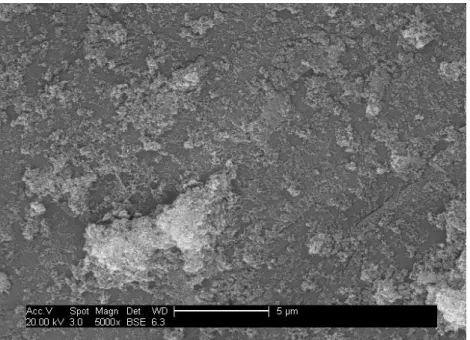
The figures 4.1 and 4.2 show the SEM micrograph of the fluoropolymers surface before the polymer surface functionalization deposition of TiO2. The surfaces are both predominately
smooth, with a spherical shape.
Figure 4.1 –PVDF surface (x5000)
48
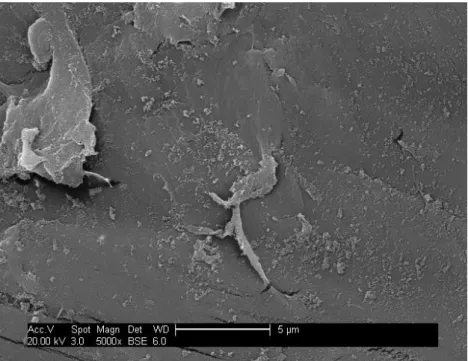
4.1.2. Photocatalytic surface functionalization deposition of TiO2 into PVDF and PTFE
surfaces
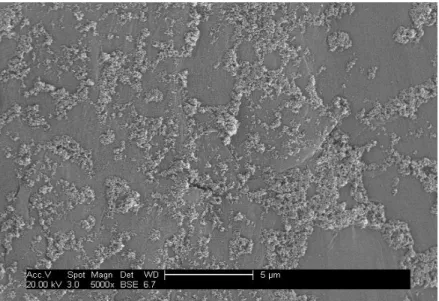
After a TiO2 PSFD treatment at pH 3, the aggregated TiO2 nanoparticles cover
significantly the surface of PVDF (figure 4.3) when compare to PTFE (figure 4.4). The main reason for such coverage, might be the chemical structure of the polymers, explained by the mechanistic suggestion for TiO2 photocatalytic surface functionalization deposition as a
function of pH shown figure 4.13
Figure 4.3 –Scanning electron microscopic image of PVDFf-TiO2 prepared with a 1.5 g/L
TiO2 solution at pH 3 (UV time = 2h, light distance= 100mm) (x5000)
Figure 4.4 - Scanning electron microscopic image of PTFEf-TiO2 prepared with a 1.5 g/L
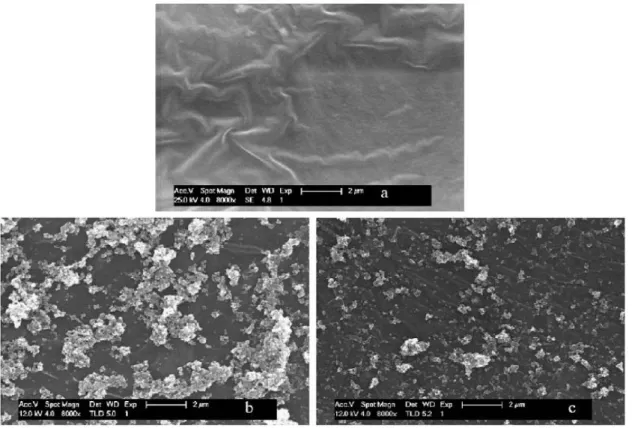
49 Mazille et al.,(2009 a) (figure 4.5) obtained similar results for TiO2 PSFD treatment at
pH 5 to cover PVF.
Figure 4.5 - Scanning electron microscopic images of a) PVF b) PVFf-TiO2 prepared at pH
5 (external side) and c) PVFf-TiO2 prepared at pH 5 (internal side) (Mazille et al., 2009, a)
According to the scanning electron microscopic images, the fluoropolymer PVDF shows a better ability for the photocatalytic functionalization surface deposition of TiO2 when
50
4.1.3. Influence of UV light distance (100 mm e 230 mm)
After the evaluation of different distances from UV light beam, the distance 100 mm (figure 4.6) shows significant coverage of PVDF surface compare with the distance 230 mm (figure 4.7). Therefore the distance 100 mm was used as a fixed parameter in further experimental work.
Figure 4.6 - Scanning electron microscopic image of PVDFf-TiO2 prepared with a 1.5 g/L
TiO2 solution at pH 3 (UV time = 2h, light distance= 100 mm) (x5000)
Figure 4.7- Scanning electron microscopic images of PVDFf-TiO2 prepared with a 1.5 g/L
51
4.1.4. Scanning electron microscopic images of PVDFf-TiO2 at different pH
The following results shows the PVDF surface after functionalization surface deposition with different pH solutions of TiO2 (1.5 g/L) (2h UV d=100 mm).
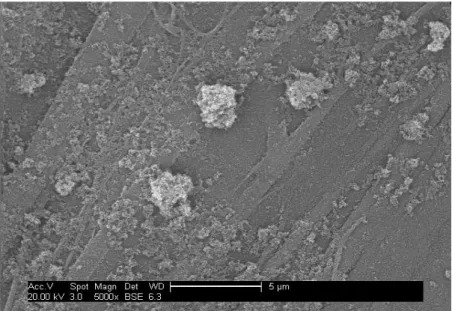
According to the experimental results, (figures 4.8; 4.9; 4.10; 4.11; 4.12) there is a decrease surface coverage at higher pH. When submitting PVDF to a TiO2 PSFD treatment,
the immobilization of the TiO2 assisted by polymer surface functionalization occurs. Thus, after
the treatment performed at pH 3 (figure 4.9), the polymer is fully covered with TiO2, whereas
after the treatment at pH 10 (figure 4.12), TiO2 was hardly detected. These results show that it
is possible to control the extent of TiO2 deposition by varying the pH.
Under acidic conditons, (figures 4.8 (pH 1) and 4.9 (pH 3)) there is a minimal difference in surface coverage, with an optimal coverage apparent at pH 3.
However at neutral and basic pH there is significantly less coverage due the mechanism suggested in figure 4.13.
52 Figure 4.9 – PVDF surface after PSFD with TiO2 (1.5 g / L at pH =3 solution) (x5000)
53 Figure 4.11 – PVDF surface after PSFD with TiO2 (1.5 g / L at pH =7 solution) (x5000)
Figure 4.12 – PVDF surface after PSFD with TiO2 (1.5 g / L at pH =10 solution) (x5000)
Mazille et al.,(2009 a) refer that under irradiation in aqueous TiO2 suspension in
equilibrium with air, PVF films suffer photocatalytic attacks leading to C=O, COOH groups and to the elimination of fluorine. When the pH of the aqueous solution is acidic the polymer surface is negatively charged since the TiO2 PSFD treatment induced the formation of
functional groups like COO- and the superficial charge of TiO2 P25 is positive (its isoelectric
54 polymer surface (Figure 4.13). The mechanism suggested by Mazille et al, (2009 a) was considered to explain the binding mechanism of TiO2 nanoparticles onto PVDF surface.
Figure 4.13 – Mechanistic suggestion for TiO2 photocatalytic surface
55
4.2. Media Performance
4.2.1. Photodegradation of methylene blue using PVDFf - TiO2 prepared at different
concentrations and pH of TiO2 solutions
Methylene blue (MB) is a typical azo dye. It can be efficiently degraded by TiO2
nanoparticles and the concentration of MB in solution is easily detected by UV-vis spectroscopy (Hwang et al., 2012) (Kuo & Ho, 2001).
The PVDFf-TiO2 prepared at different pH and concentration of TiO2 solutions was used
to obtain kinetic data for degradation of aqueous solution of MB dye in the photo-reactor. The aims were to analyze kinetic data and obtain kinetic parameters, to determine the optimum TiO2 concentration and pH conditions to prepare the media for further adsorption studies of
humic acid.
The photodegradation of MB (C16H18N3SCl) in the presence of UV light and oxygen
occurred over the TiO2 photocatalyst surface (Carvalho et al., 2010) (Chang et al.,
2004)(Shimizu et al., 2007).
Houas et al., (2001) reported that the reaction mechanism for the photocatalytic degradation of methylene blue over TiO2 catalyst is treated as heterogeneous reaction
following a Langmuir-Hinshelwood mechanism. It consists of three steps which are described by equations 4.1 to 4.3:
1) Adsorption:
C16H18N3SCl + S° ↔ C16H18N3SCl● S° Equation 4.1
O2 + S°↔ O2 ● S°
2) Surface reaction (MB mineralization)
C16H18N3SCl● S° + 25.5 O2 ● S°↔ 16CO2● S° + 6H2O● S° + 3HNO3● S° + H2SO4● S° + HCl●
S° Equation 4.2 3) Desorption CO2● S°↔ CO2+ S° Equation 4.3 H2O● S°↔ H2O + S° HNO3● S°↔ HNO3 + S° H2SO4● S°↔ H2SO4 + S° HCl● S°↔ HCl + S°
56 Where S° represents the active site on the catalyst surface.
The below graphs (Figure 4.14 to 4.17) shows the photodegradation of methylene blue by PVDFf-TiO2 prepared at different pH and concentrations.
The photocatalytic activity of TiO2 in the degradation process is influenced by several
parameters such as the phase composition, band-gap energy, surface area, particle size, crystallinity, electron-hole recombination rate and the existence of several dopants ions (Goetz et al., 2009); (Mascolo et al., 2007);(Ngang et al., 2012);(Prieto et al., 2005).
Effect of pH in the preparation of the PVDFf-TiO2 media
The disappearance of the colour of methylene blue as a function of the irradiation time followed an exponential decay. It was observed, Figure (4.14 to 4.16) that the degradation decay curve of methylene blue is higher in PVDFf- TiO2 prepared under acidic conditions,
compared to the decay curve of methylene blue when PVDFf-TiO2 is prepared under pH 7
(Figure 4.17).
These results are interesting because they correlate well with the surface coverage of the media shown in figures 4.8 to 4.11. When the media is prepared under acidic conditions the photodegradation activity of PVDFf-TiO2 is higher, due to the higher surface coverage, when
compared to the lower photodegradation activity of the media prepared under neutral and basic pH conditions (Table 4.1).
The PVDFf-TiO2 prepared with a TiO2 solution 1.5g/L at pH 3 shows the
photodegradation of 97.58% of methylene blue after 70 minutes (Figure 4.15 and Table 4.1).
Effect of concentration in the preparation of the PVDFf-TiO2 media
Figures 4.14 to 4.17 show the slight difference in photodegradation percentage of PVDFf-TiO2 prepared under different concentrations of TiO2 solutions. Apparently there is no
significant effect of the concentration of TiO2 solutions on the preparation of PVDFf-TiO2.
These outcomes might be due the turbid appearance of TiO2 solutions and the resulting
effect on light penetration which is responsible for the activation of catalyst (Mazille, et al. 2009 a)(Páez et al. 2011)(J. Yu et al. 2006)(Zhang et al. 2008).