Journal of Environmental
Analysis and Progress
Journal homepage: www.jeap.ufrpe.br/10.24221/jeap.5.1.2020.2675.088-097 ISSN: 2525-815X
Land-use and coverage in the structure of the landscape in a Tropical Dry
Forest in northeast Brazil
Jessé Moura dos Santosa, Mayara Maria de Lima Pessoaa, Rinaldo Luiz Caraciolo Ferreiraa, Emanuel Araújo Silvaa
a Universidade Federal Rural de Pernambuco-UFRPE. Rua Dom Manuel de Medeiros, s/n, Dois Irmãos, Recife,
Pernambuco, Brasil. CEP: 52.171-900. E-mail: [email protected], [email protected],
[email protected], [email protected]. A R T I C L E I N F O Received 14 Aug 2019 Accepted 08 Nov 2019 Published 18 Feb 2020 A B S T R A C T
Landscape Ecology using GIS is applied to understand the effects of forest fragmentation and makes it feasible mainly for extensive areas, through the possibility of analyzing both the variety of units that compose it in time.This study aims to analyze the land use and coverage of tropical dry forests and to characterize their landscape structure in an area of the municipality of Floresta, Pernambuco, Brazil, in order to understand how the landscape configuration can influence the conservation. Orbital images were used from LANDSAT, and the classification was performed in the QGIS 2.18 software using the Maximum Likelihood methodification, for the years of 2007 and 2017. A circular buffer was incorporated around the area of study to analyze the structural patterns in the context of the landscape. Five thematic classes were used: dense vegetation, sparse vegetation, exposed soil, grassland, and water. The metrics were obtained through the Patch Analyst tool only to the class of dense vegetation. It is noted that much of the dense vegetation has become sparse. There was a reduction of exposed soil and an increase in grassland areas, which may indicate a regeneration process of the vegetation. The fragments of dense vegetation with more substantial dimensions are on constant exploratory actions and are the most affected with the reduction of size. Furthermore, climatic factors, periods of drought, and the presence of livestock may also affect the fragmentation of dense vegetation patches. Therefore, the landscape became heterogeneous, and a tendency was observed to increase the fragmentation, mainly in the more significant spots.
Keywords: Caatinga, conservation, landscape ecology, forest management.
Introduction
In dry forests, impacts on land use occur due to anthropogenic pressure that poses threats to biodiversity (Schulz et al., 2017). The tools needed to minimize the effects require management at spatial and temporal scales (Stephens et al., 2013; Nocentini et al., 2017; Fischer, 2018).
In Brazil, the most significant expression of tropical dry forest is in the northeastern backwoods, which due to the disorderly exploitation, aims to supply a large part of the demand for forest resources (Meunier et al., 2018). As a result, although there is a growing concern for its biodiversity (Albuquerque et al., 2012; Schulz et al., 2017), the knowledge about the landscape modified by man is still incipient, and it often houses numerous forest remnants that deserve a closer look (Farah et al., 2017); mainly regarding
the impacts of land use and cover, as well as the understanding of fragmentation, at different scales of analysis (Schulz et al., 2017; Fischer, 2018).
In this regard, Landscape Ecology, using Geographic Information Systems (GIS) tools, has been consolidated as an essential approach. The method, which is applied to understand the effects of forest fragmentation (Fischer & Lindenmayer, 2007; Reyers et al., 2012), makes it feasible mainly for very large areas (Fahrig, 2015), through the possibility of analyzing both the variety of units that compose it in time (or classes of land use and cover) (Nocentini et al., 2017) and the spatial arrangement between them (structure), which characterizes the landscape (Fahrig, 2015).
Several studies on this theme have been developed in tropical dry forests by applying landscape metrics to quantify their fragmentation
(Pang et al., 2010; Pham et al., 2011; Silva et al., 2013; Coelho et al., 2014; Schulz et al., 2017; Fernandes et al., 2017; Fischer, 2018), and the results have shown that along with the rapid growth of the pasture/agriculture class, the predominant landscape of natural vegetation is being replaced by an increasingly heterogeneous, less diverse and fragmented vegetation (Fernandes et al., 2017).
Therefore, with the premise that over the years, land-use has promoted forest fragmentation, which compromises the conservation of biodiversity. This study aims to analyze the use and cover of the soil and the change of the landscape, in time and space, in a dry forest area. Moreover, this study also attempts to characterize their landscape structure in order to understand these changes and configurations and how they can influence the conservation of the tropical dry forests of the municipality of Floresta, Pernambuco.
Above all, it was intended to answer: 1. How did land use and land cover change during the period of analysis in the tropical dry forests? 2. What are the diversity and fragmentation of the landscape in the present period? 3. What are the main threats that can contribute to the conservation of the area of study in the context of the landscape?
Material and Methods
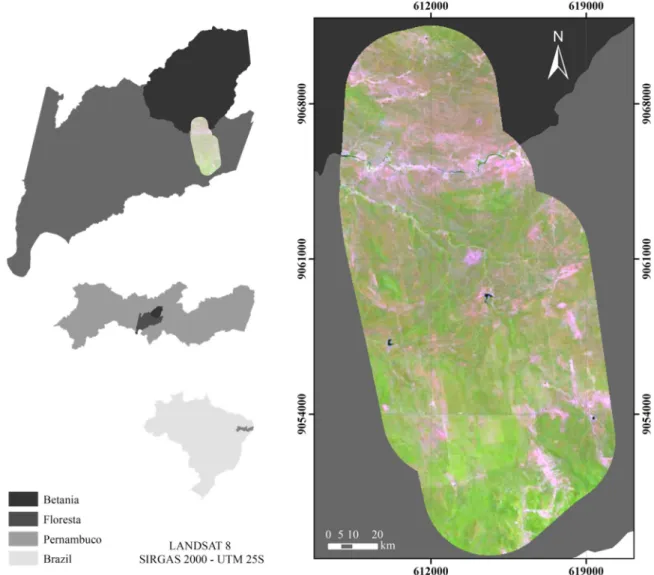
The area of study is in the municipality of Floresta, Pernambuco, with 5,695.65 ha, at 8°30’49’’ South latitude and 37°57’44’’ West latitude (Figure 1). Floresta, with 3675 km², is inserted in the mesoregion of the São Francisco Pernambucano and microregion of Itaparica. The climate of the region is classified as BS’h by Köppen climate classification, which reports as a hot semiarid climate. Rainy periods are concentrated from January to May, being March and April the rainiest months, and the average annual precipitation is between 380 and 760 mm.
Figure 1. Location of the study area, in the municipality of Floresta, Pernambuco, Brazil. The vegetation is classified as Wooded
Savannah-steppe (IBGE, 2012). The soil of the
region is classified as luvisolic, which is characterized by being shallow and usually exhibits
an abrupt change in texture (EMBRAPA, 2011). The study area is in the southern sertaneja depression ecoregion, one of the places with few protected areas and as a result, most impacted by human action. However, the region still possesses reasonably extensive areas with the possibility of recovery (Velloso et al., 2002).
In the study of land use and coverage, thematic maps were prepared for the years of 2007 and 2017, and a circular buffer with a radius of 3 km was incorporated around the study area to understand the structural patterns in the context of the landscape.
In the mapping process, orbital images were available and used in the INPE image catalog. Considering the year 2007 images from LANDSAT 5 satellites, TM sensor was used and for 2017 from LANDSAT 8, OLI 5 sensor, orbit 216 and point 65, both with a resolution of 30 meters. The color composition 5R 4G 3B (LANDSAT 5) and 6R 5G 4B (LANDSAT 8) were used for both processes. After the acquisition of the images, the preprocessing step was started, as well as the initial treatment of the images, to remove undesirable characteristics produced in the image.
Subsequently, the image processing step was performed, with the area of interest cut and the Maximum Likelihood methodification. To determine the land use and land cover classes, four thematic classes were used: Dense vegetation - areas covered with dense shrubby tree; Sparse vegetation - land areas with shrub, herbaceous or arboreal cover spaced; Grassland - areas covered with shrub and agriculture; Exposed soil - areas with imperceptible presence of vegetation and rocky outcrops; Water - areas with presence of natural or artificial water bodies. The classification was performed in the QGIS 2.18 software, and the location map and the land use and cover maps were made in the ArcGIS 10.2 software.
The characterization of the landscape structure was performed through the file in shapefile format, referring to the Dense vegetation class, which was extracted for both 2007 and 2017. The following landscape metrics were obtained: Mean Shape Index (MSI), Mean Patch Fractal
Dimension (MPFD), Total Edges (TE), Edge Density (ED), Number of Patches (NumP), Class Area (CA), Mean Central Area (MCA), Shannon Diversity Index (SDI) and the wealth index. The metrics were obtained through the Patch Analyst tool, an extension of ArcGIS 10.2, which provides spatial statistical estimates using the vector and matrix files, based on the principles of Landscape Ecology.
To analyze the clustering or dispersion of vegetation patches and to characterize the fragility and vulnerability of the fragments were obtained: the size of fragments, classified as small ≤ 10 ha; 10 ha <medium ≤ 50 ha; and large> 50 ha, the mean distance between fragments, called Observed Average Distance (OAD) and Nearest Neighbor Relationship (NNR), using the "Average Nearest Neighbor" tool in ArcGIS 10.2.
When the value of the NNR is close to 1, the fragments in the landscape appear in greater quantity and more distributed, and when smaller than 1, the fragments appear in smaller quantities and grouped, being able to form higher spots/fragments.
The NNR calculations were performed based on Manhattan distance, which is the distance between two points measured along the axes at right angles, calculated by the sum of the difference between the X and Y coordinates (ESRI, 2009). To classify the isolation between fragments was used the values proposed by Almeida (2008), which ranks the isolations in low, medium, high, and very high, with arbitrary values of 60, 120, 200, and > 200 meters, respectively.
Results and Discussion
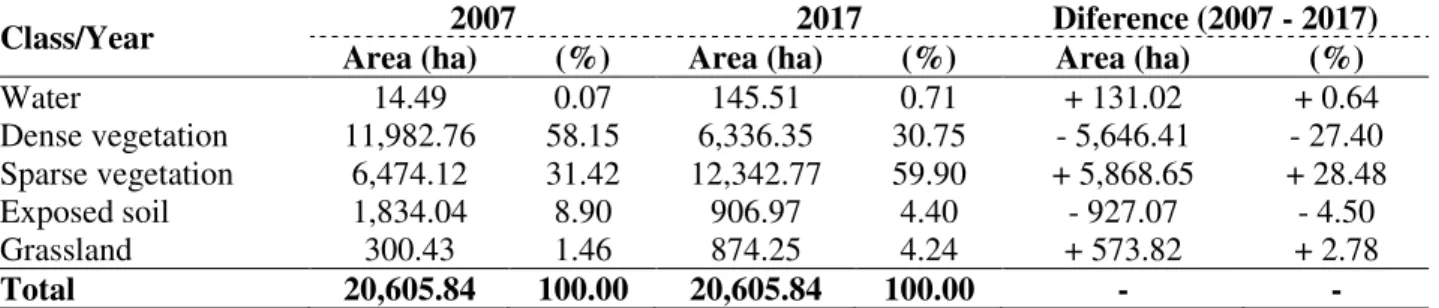
During the period from 2007 to 2017, dense vegetation class decreased by 27.40%, and, in contrast, sparse vegetation increased by 28.28% (Table 1), showing that during the ten years analyzes, there were changes in the forest cover and its surrounds. Overall, the accuracy of the maps by the Kappa index was considered very good, showing the values of 0.89 in 2007 and 0.87 in 2017.
Table 1. Classes of land use, land cover, respective real, and relative occupied areas in the years 2007 and 2017 in Caatinga, Floresta, Pernambuco, Brazil. ha = hectare.
Class/Year 2007 2017 Diference (2007 - 2017)
Area (ha) (%) Area (ha) (%) Area (ha) (%)
Water 14.49 0.07 145.51 0.71 + 131.02 + 0.64 Dense vegetation 11,982.76 58.15 6,336.35 30.75 - 5,646.41 - 27.40 Sparse vegetation 6,474.12 31.42 12,342.77 59.90 + 5,868.65 + 28.48 Exposed soil 1,834.04 8.90 906.97 4.40 - 927.07 - 4.50 Grassland 300.43 1.46 874.25 4.24 + 573.82 + 2.78 Total 20,605.84 100.00 20,605.84 100.00 - -
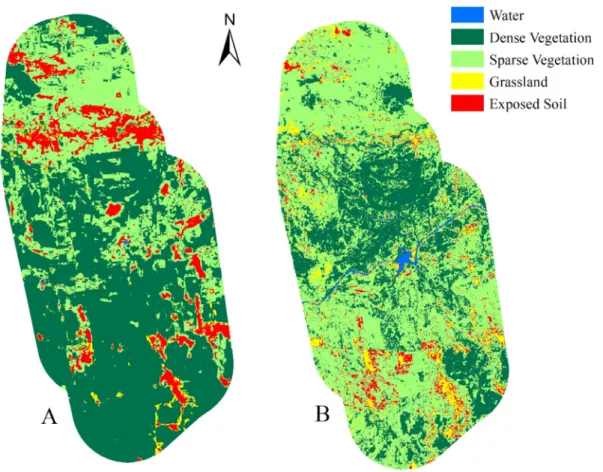
Analyzing the thematic maps generated for the area (Figure 2), it is noted that much of the dense vegetation has become sparse. However, it cannot be stated that the modification was in its entirety since, in some areas, dense vegetation was possibly suppressed and became exposed soil or grassland. Barbosa et al. (2019) stated that this change occurs mainly due to inadequate soil management practices, which are often in combination with recurrent droughts. According to
the same authors, when studying the relationship
between NDVI (Normalized Differential
Vegetation Index) using time series and meteorological stations, they verified that the impact of the drought in the period from 2012 to 2015 influenced the vegetation dynamics. The area was affected by 26%, and the drought was considered the most extended and continuous of the historical past, since the year of 1901.
Figure 2. Land-use and coverage maps of Itapemirim farm and its landscape in the years 2007 (A) and 2017 (B).
Besides, the presence of livestock in this region, evidenced by the high incidence of goats and cattle in the research area, also reported by Ferraz et al. (2014), can interfere in the reduction
of dense vegetation, compromising the
conservation of the studied sites (Ferreira et al., 2010).
Other factors related to the reduction of dense vegetation class in the period of analysis are associated to the intense drought, as observed by Barbosa et al. (2019), as well as to logging (Meunier et al., 2018), which is a way to supply the industrial demand for coal in the region. This pattern of behavior can also be observed in other studies in the semiarid region (Guedes, 2016; Arsanjani et al., 2016), which may indicate a trend
of expansion and land use. Besides, there is still a significant dependence on the neediest populations regarding the use of wood as a source of energy, for both domestic consumptions, and commercial purposes (Travassos & Souza, 2014).
The reduction of exposed soil (-4.7%) and grassland growth (2.78%), evidenced in the use and cover maps, may indicate a regeneration process of the vegetation due to the resilience of Caatinga areas. Álvarez-Yépiz et al. (2018) suggests that dryland ecosystems, characterized mainly by the seasonal regime, could be highly adapted or resilient to recurrent climatic or anthropogenic disturbances, such as the regrowth capacity of many woody species in response to physical damages, plant phenological adaptations or
dominance of leguminous species capable of fixing
symbiotic nitrogen. Species with these
characteristics may dominate abandoned degraded areas, which may explain the replacement of these sites by vegetation in some points of the area of study (Figure 2).
In 2017, the water class significantly increased its territory due to the artificial water body implanted through the transposition of the São Francisco River from the eastern axis, from
Floresta (PE) to Monteiro (PB). The increase also favored the expansion of local farming.
In the landscape structure of the area of study, there was a significant change in the period of analysis. The number of fragments (NumP) varied in 1456, ranging from 0.058 to 10322.55 ha in 2007 and 4803 fragments, ranging from 0.058 to 2397.33 ha in 2017 (Tables 2 and 3). The increase in NumP is related to the increase in the number of small fragments (<10 ha).
Table 2. Dynamics of the distribution of the fragments and size classes, in a Caatinga area in the semiarid region of Pernambuco, Brazil. ha = hectare; QF = Quantity of Fragments.
Class/Year 2007 2017 Diference (2007 - 2017)
QF Area (ha) (%) QF Area (ha) (%) Area (ha) (%)
Small 1,439.00 534.55 4.46 4,749.00 1,541.98 24.34 1,007.43 + 19,87
Medium 0.00 0.00 0.00 42.00 870.15 13.73 870.15 + 13,73
Large 17.00 11,448.21 95.54 12.00 3,924.22 61.93 -7,523.99 -33.61
Total 1,456.00 11,982.76 100.00 4,803.00 6,336.35 100.00 - -
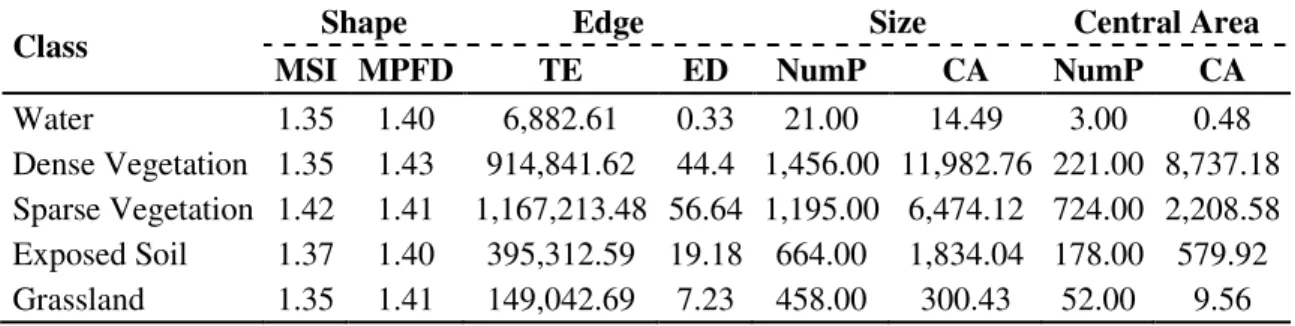
Table 3. Values of the metrics referring to the landscape in the year 2007, in Caatinga, Floresta, Pernambuco, Brazil. MSI = mean shape index; MPFD = mean patch fractal dimension; TE = total edge; ED = edge density; Nump = numbers of patches; CA = class area.
Class Shape Edge Size Central Area
MSI MPFD TE ED NumP CA NumP CA
Water 1.35 1.40 6,882.61 0.33 21.00 14.49 3.00 0.48
Dense Vegetation 1.35 1.43 914,841.62 44.4 1,456.00 11,982.76 221.00 8,737.18
Sparse Vegetation 1.42 1.41 1,167,213.48 56.64 1,195.00 6,474.12 724.00 2,208.58
Exposed Soil 1.37 1.40 395,312.59 19.18 664.00 1,834.04 178.00 579.92
Grassland 1.35 1.41 149,042.69 7.23 458.00 300.43 52.00 9.56
In 2017, the percentage of the area represented by small fragments increased, rising to 24.34% of the area, while the area of large fragments decreased to 61.93% (Table 2). This difference denotes a more significant amount of area occupied by the sum of the small fragments. When compared to 2007, the area occupied by large fragments reduced by 31%, while the medium and small ones increased by 11% and 20% respectively, demonstrating that during this period, there was an intensification in the fragmentation of dense vegetation. This indicative suggests that the fragments of dense vegetation with more substantial dimensions are the most affected with the reduction of size and are on constant exploratory actions.
This tendency of the appearance of smaller fragments and, consequently, to the increase of the percentage of small areas is worrisome since even if some are in the process of regeneration, perhaps it is not enough to diminish the effects of the
fragmentation. Habitat fragmentation and
suppression of native vegetation are among the
greatest threats to global biodiversity (Myers et al. 2000).
This change interferes with the
demographic parameters of different species and, consequently, in the structure of forest composition and function, especially from the ecological point of view (Foster et al., 2003; Nowacki & Abrams, 2015; Pilon et al., 2018). As a result, the fragments become islands of diversity surrounded by a matrix of low complexity (Debinsk & Holt, 2000; Silva et al., 2013).
According to the fractal dimension value (MPFD) for dense vegetation, the fragments formats in the two years of analysis were similar and did not present as much irregularity. However, McGarigal & Marks (1995) corroborate that the fractal dimension is not indicated for forest fragments in very fragmented landscapes, and for this reason, the shape index (MSI) should be used. When analyzing the shape index, similar behavior is observed since the values were close to 1.3, denoting a more circular shape of the fragments (Tables 3 and 4).
Table 4. Values of the metrics referring to the landscape in the year 2017, in Caatinga, Floresta, Pernambuco, Brazil.
Class Shape Edge Size Central Area
MSI MPFD TE ED NumP MCA NumP MCA
Water 1.34 1.41 64,689.16 3.14 191.00 145.51 5.00 22.78
Dense Vegetation 1.36 1.43 1,890,148.09 91.88 4,803.00 6,336.35 666.00 1,505.81
Sparse Vegetation 1.38 1.43 3,381,370.04 164.36 4,725.00 12,309.35 2,036.00 1,808.64
Exposed Soil 1.30 1.43 535,985.89 26.05 2,284.00 906.97 92.00 51.17
Grassland 1.30 1.43 704,009.98 34.22 3,575.00 874.25 48.00 7.85
MSI = mean shape index; MPFD = mean patch fractal dimension; TE = total edge; ED = edge density; NumP = numbers of patches; CA = class area.
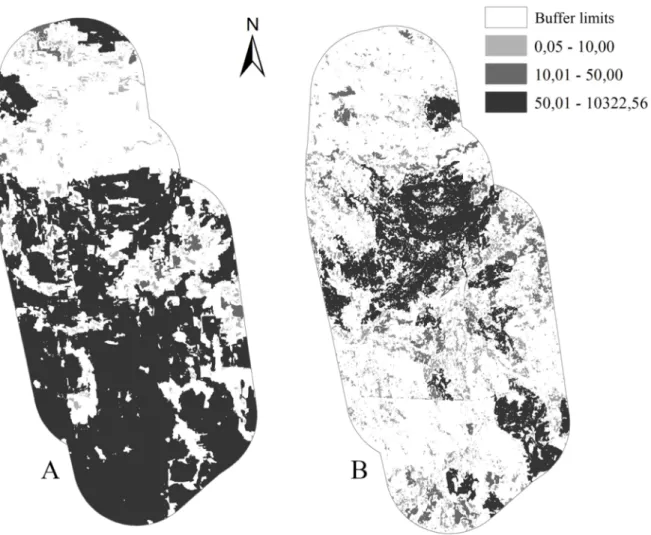
In the division of size classes, a tendency was observed for a percentage increase of small fragments (Table 4) (Figure 3). However, the percentage area ratio that these fragments occupy presented a different trend during the ten years studied. In 2007, small fragments presented
98.83% of the number of fragments, but this percentage represented only 4.46% of the vegetation area. The large fragments presented 0.34% of the amount, which represents 93.34% of the area of dense vegetation.
Figure 3. Structure of the landscape concerning the size of the fragments in the years of 2007 (A) and 2017 (B).
Fragments with more circular shapes are less susceptible to edge effects, but smaller fragments are more influenced by external factors because of vulnerability to physical changes in the environment caused by fragmentation that may
decrease biological diversity (Silva & Souza, 2014). Even if the fragments have characteristics of a circle that can decrease the intensity of the edge effects, their size and heterogeneity directly influence these fragments. Thus, the smallest
fragments may be the least conserved and the ones with a higher risk of disappearance.
The number of edges of the fragments (TE), based on the total area of dense vegetation, almost quadrupled. In 2007, there were 76.35 meters per hectare of edge for each hectare of dense forest, and this value increased to 298.30 meters per hectare in 2017. That indicates, once again, the fragmentation of the landscape in ten years. Besides, the common central area of the dense vegetation decreased, which may have occurred due to the fragmentation of the larger spots (Table 4).
In the fragmentation process, the areas affected by the edges increased, which may have caused the reduction of the central areas. However, Santos & Santos (2008) corroborate that the vegetation of the Caatinga does not suffer direct biological influenced by the edge effect since the limiting factor in this region is water, not light. On the other hand, some results have shown that the edge effect in the semiarid region interferes in the diameter of the shrub-tree species (Blumenfeld et al. 2016), as well as in the production of forest biomass (Chaplin-Kramer et al., 2015) and the plant mortality (Rabelo et al., 2015).
In the analysis of the Average Distance of the Nearest Neighbor, a Mean Observed Distance (OAD) of 152.61 m was obtained for 2007 and 114.69 m for 2017. The landscape in 2007 presented a Neighborly Neighbor Relationship (NNR) of 0.73, indicating a clustering of the fragments as well as a smaller variation in the distances between them, which was explained by the predominance of dense vegetation in the landscape. Considering the year 2017, the value of the NNR was 0.99, reaffirming the fragmentation of the forest patches as it indicates a random pattern of the fragments.
The fragmentation process also explains the fact that OAD was lower in 2017. In 2007, the average distance occurred, representatively, between large spots, which over time, fragmented into smaller units. Because they previously belonged to a single large fragment, the distances between these small spots are smaller compared to the distances of the larger fragments observed in 2007. Thus, when these smaller distances are added on average, the OAD value decreases, which based on the values determined by Almeida (2008), the isolation of vegetation patches in the landscape is considered medium.
This type of isolation and with a lower OAD in the year 2017, it can be said that even with a more fragmented landscape, the smaller spots from fragmentation demonstrate their ecological importance and can serve as ecological
trampolines. Besides, if there is management in these areas, the connectivity through the thickening, between the small spots, can be a reality.
Ecological trampolines potentiate the flow of the organism and increase the connectivity of the landscape (Ribas et al., 2016). Considering that the increase in the connectivity between the fragments depends not only on the vegetation but also on other factors (biotic and abiotic) in the tropical dry forest area, the increase of this connectivity of the landscape may have a greater difficulty.
Therefore, since there are conditions favorable to the development of these species, together with the fact that in the tropical dry forest is in question, the dispersion of tree species depends mainly on abiotic factors (Silva & Rodal, 2009). As a result, the connection between the fragments of the area studied would happen quickly. However, because of the characteristics of the region, the development of the individual occurs very slowly and is directly affected by climatic and anthropogenic factors. Besides, the ecological characteristics mentioned above may be unusual for the connection of the fragments, but not as attractive in terms of species’ richness and dominance.
The dispersal of the species found in the areas favor the connectivity of the fragments, but even if the individuals can survive and develop, the floristic diversity may not vary since in these regions the vegetation often presents itself in the initial stage of succession and has great difficulty in achieving an advanced stage of ecological development. However, Metzger (2001) reports significant relationships between landscape metrics and species diversity, and Cabacinha & Castro (2009) reaffirm the relationship between landscape metrics and floristic diversity.
In the analysis of both use and cover as well as the structure of the landscape, there is a tendency to fragmentation, which is explained by the difficulty of the development of the species present in the tropical dry forest and mainly by the regeneration of these species (Alves Junior et al., 2013). These authors add that without silvicultural monitoring of some species that have difficulty regenerating, species richness may decrease, and species with high densities may establish themselves as dominant.
Therefore, the difficulty of increasing the connectivity of the fragments is explained by the difficulty of vegetation growth, which is caused by climatic factors and can be intensified by anthropization. Thus, in order to provide and ensure the reconnection of the fragments, silvicultural treatments should be applied to
stimulate natural regeneration or facilitate regeneration by artificial means.
Conclusion
There was a decrease in dense vegetation over the past ten years, which made the landscape heterogeneous. The heterogeneity of the spots of dense vegetation occurred through the process of fragmentation, caused by climatic factors which were allied to anthropization and severe drought.
Small fragments, even with more circular forms, presented a higher risk of disappearance of the landscape and possibly less ecological diversity. The medium and large ones presented more conserved areas; however, they are more susceptible to fragmentation due to its irregular shapes and large amounts of edges.
Acknowledgements
The authors thank Maria Nazareth Araújo, from the University of New Brunswick, for English corrections and the Conselho Nacional de Desenvolvimento Científico e Tecnológico (CNPq).
References
Albuquerque, U. P.; Araújo, E.; El-Deir, A. C. A.; Lima, A. L. A.; Souto, A.; Bezerra, B. M.; Ferraz, E. M. N.; Freire, E. M. X.; Sampaio, E. V.; Las-Casas, F. M. G.; Moura, G. J. B.; Pereira, G. A.; Melo, J. G.; Ramos, M. A.; Rodal, M. J. N.; Schiel, N.; Lyra-Neves, R. M.; Alves, R. R. N.; Azevedo-Júnior, S. M.; Telino, W. R.; Severi, W. 2012. Caatinga Revisited: Ecology and Conservation of an Important Seasonal Dry Forest. The Scientific
World Journal, 21, 1-18.
http://dx.doi.org/10.1100/2012/205182. Almeida, C. G. 2008. Análise espacial dos
fragmentos florestais na área do parque nacional dos Campos Gerais, Paraná. Thesis, Universidade Estadual de Ponta Grossa, Ponta Grossa, PR. 71p.
Álvarez-Yépiz, J. C.; Martínez-Yrízar, A.; Fredericksen, T. S. 2018. Special Issue: Resilience of tropical dry forests to extreme disturbance events. Forest Ecology and Management, 426, 1-6.
Alves Junior, F. T.; Ferreira, R. L. C.; Silva, J. A. A.; Marangon, L. C.; Cespedes, G. H. G. 2013. Regeneração natural de uma área de caatinga no sertão Pernambucano, nordeste do Brasil. Cerne, 19, 229-235.
Arsanjani, J. J.; Tayyebi, A.; Vaz, E. 2016. GlobeLand30 as an alternative fine-scale global land cover map: Challenges,
possibilities, and implications for developing countries. Habitat International, 55, 25–31. Barbosa, H. A.; Kumar, T. V. L.; Paredes, F.;
Elliott, S.; Ayuga, J. G. 2014. Assessment of Caatinga response to drought using Meteosat-SEVIRI Normalized Difference Vegetation Index (2008–2016). ISPRS Journal of Photogrammetry and Remote Sensing, 148, 235-252.
Blumenfeld, E. C.; Santos, R. F.; Thomaziello, S. A. A.; Ragazzi, S. 2018. Relações entre tipo de vizinhança e efeitos de borda em fragmento florestal. Ciência Florestal, 26, (4), 1301-1316.
Cabacinha, C. D.; Castro, S. S. 2009. Relationships between floristic diversity and vegetation indices, forest structure and landscape metrics of fragments in Brazilian Cerrado. Forest Ecology And Management, 257, (10), 2157-2165.
Chaplin-Kramer, R.; Ramler, I.; Sharp, R.; Haddad, N. M.; Gerber, J. S.; West, P. C.; Mandle, L.; Engstrom, P.; Baccini, A.; Sim, S.; Mueller, C.; King, H. 2015. Degradation in carbon stocks near tropical forest edges. Nature Communications. Springer Nature, 6, (1), 1-6.
Coelho, V. H. R.; Montenegro, S. M. G. L.; Almeida, C. N.; Lima, E. R. V.; Neto, A. R.; Moura, G. S. S. 2014. Dinâmica do uso e ocupação do solo em uma bacia hidrográfica do semiárido brasileiro. Revista Brasileira de Engenharia Agrícola e Ambiental, 18, (1), 64-72.
Debinski, D. M.; Holt, R. D. 2000. A survey and
overview of habitat fragmentation
experiments. Conservation Biology, 14, (2), 342-355.
Empresa Brasileira de Pesquisa Agropecuária - EMBRAPA. Centro Nacional de Pesquisas de Solos. 2011. Manual de métodos de análises de solos, 2, 230p.
Esri. 2009. Average Nearest Neighbor (Spatial Statistics). ArcGIS Desktop. Disponivel em : http://webhelp.esri.com/arcgisdesktop/9.3/in dex.cfm?TopicName=Average_Nearest_Nei ghbor_%28Spatial_Statistics%29. Acesso em : 22 outubro de 2018.
Fahrig, L. 2015. Just a hypothesis: a reply to Hanski. Journal Of Biogeography, 42, (5), 993-994.
Farah, F. T.; Muylaert, R. L.; Ribeiro, M. C.; Ribeiro, J. W.; Mangueira, J. R. S. A.; Souza, V. C.; Rodrigues, R. R. 2017. Integrating plant richness in forest patches can rescue overall biodiversity in human-modified
landscapes. Forest Ecology And Management, 397, 78-88.
Fernandes, M.; Fernandes, M.; Almeida, A.; Gonzaga, M. I. S.; Gonçaves, F. 2017. Ecologia da Paisagem de uma Baica Hidrográfica dos Tabuleiros Costeiros do Brasil. Floresta e Ambiente, 24, 1-9.
Ferraz, J. S. F.; Ferreira, R. L. C.; Silva, J. A. A.; Meunier, I. M. J.; Santos, M. V. F. 2014. Estrutura do componente arbustívo-arbóreo da vegetação em duas áreas de caatinga, no município de floresta, Pernambuco. Revista Árvore, 38, (6), 1055-1064.
Ferreira, R. R. M.; Tavares Filho, J.; Ferreira, V. M. 2010. Efeitos de sistemas de manejo de pastagens nas propriedades físicas do solo. Semina: Ciências Agrárias, 31, 913-932. Fischer, A. P. 2019. Characterizing behavioral
adaptation to climate change in temperate forests. Landscape and Urban Planning, 188, 72-79.
Fischer, J.; Lindenmayer, D. B. 2007. Landscape modification and habitat fragmentation: a
synthesis. Global Ecology And
Biogeography, 16, (3), 265-280.
Foster, D.; Swanson, F.; Aber, J.; Burke, I.; Brokaw, N.; Tilman, D.; Knapp, A. 2003. The importance of land-use legacies to ecology and conservation. Bioscience, 53, 77–88. Guedes, J. C. F. 2016. Estratégia de Zoneamento
Ambiental Aplicada a Caracterização Ambiental de Bacias Hidrográficas do Semiárido Brasileiro: Estudo de Caso na Microbacia do Rio Barra Nova-RN/PB. Revista de Geociências do Nordeste, 2, 1012-1024.
Instituto Brasileiro de Geografia e Estatística – IBGE. 2012. Manual técnico da vegetação brasileira, 2, 271p.
Mcgarigal, K.; Marks, B. J. 1995. Fragstats: spatial pattern analysis program for quantifying landscape structure. Portland (OR, USA), Department of Agriculture, Forest Service, Pacific Northwest Research Station, 122p. Metzger, J. P. 2001. O que é ecologia de paisagens?
Biota Neotropica, 1, (12), 1-9.
Meunier, I. M. J; Ferreira, R. L. C.; Silva, J. A. A. 2018. O licenciamento de Planos de Manejo Florestal da Caatinga assegura sua
sustentabilidade? Pesquisa Florestal
Brasileira, 38, (17), 1-7.
Myers, N.; Mittermeier, R. A.; Mittermeier, C. G.; Fonseca, G. A. B.; Kent, J. 2000. Biodiversity hotspots for conservation priorities. Nature, 403, (6772), 853-858.
NOCENTINI, S.; BUTTOUD, G.; CIANCIO, O.; CORONA, P. 2017. Managing forests in a
changing world: the need for a systemic approach. Forest Systems, 26, (1), 24-32. Nowacki, G. J.; Abrams, M. D. 2015. Is climate an
important driver of post-European vegetation change in the Eastern United States? Global Change Biology, 21, 314-334.
Pang, A.; Li, C.; Wang, X.; Hu, J. 2010. Land use/cover change in response to driving forces of Zoige County, China. Procedia Environmental Sciences, 2, (1), 1074-1082. Pham, H. M.; Yamaguchi, Y.; BUI, T. Q. 2011. A
case study on the relation between city planning and urban growth using remote sensing and spatial metrics. Landscape and Urban Planning, 100, (1), 223-230.
Pilon, V.; Payette, S.; Couillard, P.; Laflamme, J. 2018. Surface analysis as a method to reconstruct past and recent dynamics of forest
ecosystems. Forest Ecology and
Management, 407, 84-94.
Rabelo, F. R. C.; Rodal, M. J. N.; Silva, A. C. L.; Lima, A. L. A. 2015. Dinâmica da vegetação em um fragmento de Mata Atlântica no nordeste do Brasil. Ciência Florestal, 25, (1), 23-36.
Reyers, B.; Polasky, S.; Tallis, H.; Mooney, H. A.; Larigauderie, A. 2012. Finding Common Ground for Biodiversity and Ecosystem Services. Bioscience, 62, (5), 503-507. Ribas, R. P.; Gontijo, B. M.; Moura, A. C. M. 2016.
Análise da conectividade entre fragmentos de vegetação na paisagem: estudo na região da Serra do Espinhaço em Minas Gerais. Revista Brasileira de Cartografia, 2, (68), 301-312. Santos, A. M. M.; Santos, B. A. 2008. Are the
vegetation structure and composition of the shrubby Caatinga free from edge influence? Acta Botanica Brasilica, 22, (4), 1077-1084. Schulz, C.; Koch, R.; Cierjacks, A.; Kleinschmit,
B. 2017. Land change and loss of landscape diversity at the Caatinga phytogeographical domain – Analysis of pattern-process relationships with MODIS land cover products (2001–2012). Journal of Arid Environments, 136, 54-74.
Silva, A. C. C.; Prata, A. P. N.; Souto, L. S.; Mello, A. A. 2013. Aspectos de ecologia de paisagem e ameaças à biodiversidade em uma unidade de conservação na caatinga, em Sergipe. Revista Árvore, 37, (1), 479-490. Silva, E. A.; Ferreira, R. L. C.; Silva, J. A. A.; SÁ,
B. I.; Duarte, S. M. A. 2013. Dinâmica do uso e cobertura da terra do município de Floresta, PE. Floresta, 43, (4), 611-620.
Silva, M. C. N. A.; Rodal, M. J. N. 2009. Padrões das síndromes de dispersão de plantas em áreas com diferentes graus de pluviosidade,
PE, Brasil. Acta Botanica Brasilica, 24, (4), 1040-1047.
Silva, M. S. F.; Souza, R. M. 2014. Spatial patterns of forest fragmentation in the Flona Ibura – Sergipe. Mercator, 13, (3), 121-137.
Stephens, S. L.; Agee, J. K.; Fulé, P. Z.; North, M. P.; Romme, W. H.; Swetnam, T. W.; Turner, M.G. 2013. Managing Forests and Fire in Changing Climates. Science, 342, (6154), 41-44.
Travassos, I. S.; Souza, B. I. 2014. Os negócios da
lenha: indústria, desmatamento e
desertificação no Cariri paraibano. GEOUSP – Espaço e Tempo, 18, (2), 329-340.
Velloso, A.L.; Sampaio, E. V. S. B.; Pareyn, F. G. C. 2002. Ecorregiões: Propostas para o bioma Caatinga. The Nature Conservancy do Brasil, 76 p.