Universidade do Minho
Escola de Engenharia
Zacarias Benta
Leveraging Cloud Computing for IPTV:
Moving the Set-Top Box to the Cloud
Universidade do Minho
Dissertação de Mestrado
Escola de Engenharia
Departamento de Informática
Zacarias Benta
Leveraging Cloud Computing for IPTV:
Moving the Set-Top Box to the Cloud
Mestrado em Redes de Comunicações e Serviços
Trabalho realizado sob orientação de
Imagination
Imagination is more important than knowledge.
For knowledge is limited to all we now know and understand, while imagination embraces the entire world,
and all there ever will be to know and understand.
Thanks To...
I would like to take the time to thank my travel companion Professor Joaquim Macedo for his support and guidance across this adventure. I would also like to thank my family for all their support and comprehension, to Armin Van Buuren for his music that kept me going though the long nights of study and last but no the least to my lovely wife Susana for always believing in me and making me believe in myself.
Leveraging Cloud Computing for IPTV:Moving Set-Top Box to the Cloud
Abstract
IP Television (IPTV) has changed the way we perceive our TV sets. It has given us the ability to take control of our TV viewing activities.
We can now interact with our TV set in a way we might have thought impossible a few decades ago.
With the push of a button we can schedule TV recordings, stop and even rewind the broadcast. Users are now able to control what they want to view, when they want to view it.
TV sets have also evolved and gained a new set of functionalities, they have become smart, allowing us to connect o the Internet and decode media files that are inputed through usb ports and streamed through the network or the Internet.
But the TV is no longer the center of our multimedia experience, now we have new ways to access the TV content we have subscribed. Viewing TV on a laptop, a smartphone or even a tablet is now more and more common.
Cloud Computing (CC) has also brought us some revolutions, we can now have systems that grow and adapt on-the-fly to the conditions presented to them.
An application can extend it’s storage capacity in a matter of minutes, and the same can be said of the processing power of the underlying platform.
Our objective in this work is to discuss the possibility of creating a synergy between both services.
By creating a system where IPTV and CC would interact, we could create a service that would provide IPTV anytime and anywhere.
With the possibilities CC brings we can move the Set-top Box (STB) to the cloud and create new service functionalities and reduce the cost of having to install a STB in every client. We have focussed our work in the simulation of a CC infrastructure that would host Virtual STB’s that would be accessible from wherever there would be a network connection.
Potencia¸c˜ao da Computa¸c˜ao em Cloud Computing para IPTV:
Coloca¸c˜ao da Set-Top Box na Cloud
Resumo
O IPTV mudou a maneira como vemos os nossos aparelhos de TV, esta tecnologia permitiu-nos assumir o controle das permitiu-nossas actividades de visualiza¸c˜ao de TV. Agora podemos interagir com a nossa TV de uma maneira que se pensaria ser imposs´ıvel h´a algumas d´ecadas atr´as.
Com o toque de um bot˜ao ´e poss´ıvel agendar grava¸c˜oes de TV, parar e at´e mesmo voltar atr´as na emiss˜ao. Actualmente, os utilizadores s˜ao capazes de controlar o que querem ver e quando o querem ver.
As TVs tamb´em tˆem evolu´ıdo e ganharam um novo conjunto de fun¸c˜oes / ferramentas, tornaram-se inteligentes, o que lhes permitiu efectuar liga¸c˜oes ´a Internet e descodificar ficheiros multim´edia que s˜ao introduzidos atrav´es das portas USB que tamb´em ganharam. A TV deixou de ser o centro de aten¸c˜oes no que concerne ao nosso consumo de multim´edia, agora temos novas maneiras de aceder aos conte´udos de TV que subscrevemos. Visualizar TV num port´atil, smartphone ou at´e mesmo num tablet ´e cada vez mais comum.
O CC tamb´em nos proporcionou algumas evolu¸c˜oes, agora podemos ter sistemas que podem crescer e adaptar-se em tempo real, dependendo das necessidades. Uma aplica¸c˜ao pode aumen-tar o tamanho do seu sistema armazenamento numa quest˜ao de minutos, e o mesmo pode ser dito da capacidade de processamento da plataforma subjacente.
O objectivo deste trabalho ´e discutir a possibilidade de criar uma sinergia entre ambos os servi¸cos. Ao criar um sistema onde o IPTV e o CC interagissem, poder´ıamos criar um servi¸co que poderia fornecer IPTV a qualquer hora e em qualquer lugar. Com o CC temos a possibilidade de passar a STB para a nuvem, criar novas funcionalidades, servi¸cos e ao mesmo tempo reduzir o custo de ter que instalar uma STB em cada cliente. O foco do nosso trabalho foi na simula¸c˜ao de uma infra-estrutura CC que permitisse a cria¸c˜ao de uma STB Virtual, podendo esta estar acess´ıvel a partir de qualquer lugar onde quer que existisse uma liga¸c˜ao `a rede.
Contents
List of Figures . . . xii
List of Tables . . . xv Acronyms . . . xvi 1 Introduction 1 1.1 Introduction . . . 1 1.2 Motivation . . . 2 1.3 Objectives . . . 3 1.4 Document Structure . . . 5 2 Television over IP 6 2.1 Next Generation Networks . . . 7
2.1.1 IP Multimedia Subsystem . . . 8
2.2 IPTV Architecture . . . 9
2.2.1 Video Head-End . . . 12
2.2.2 ISP Core Network . . . 12
2.2.3 ISP Access Network . . . 13
2.2.4 Costumer Premises . . . 14
2.3 IPTV Service Quality . . . 15
2.4 Summary . . . 16
3 IPTV User Behavior 18 3.1 Active Users . . . 19
3.2 Session Length . . . 20
3.3 Channel Zapping . . . 21
3.4 Modeling User Behavior . . . 23
3.4.1 STB logs to the rescue . . . 23
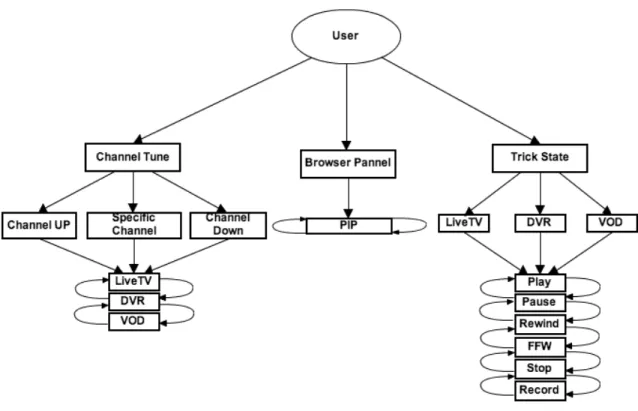
3.4.2 User Activities . . . 23
3.4.3 Chanel Tune . . . 24
3.6 Trick State . . . 26
3.6.1 Stream Management Stream Request (SMSR) . . . 27
3.6.2 On and Off Sessions . . . 27
3.7 Channel Switch . . . 29
3.8 Channel Popularity . . . 29
3.9 Summary . . . 30
4 Cloud Computing 32 4.1 Cloud Computing Origins . . . 33
4.2 Cloud Computing vs Grid Computing . . . 33
4.3 Characteristics . . . 35
4.4 Service Models . . . 37
4.5 Deployment Models . . . 38
4.6 Cloud Computing Standards . . . 38
4.7 Cloud Computing Development Platforms . . . 39
4.8 Summary . . . 40
5 IPTV and the Cloud 41 5.1 Cloud Computing, the future of television. . . 41
5.2 IPTV and Cloud Computing content delivery. . . 42
5.2.1 Video On Demand and Cloud Computing . . . 43
5.2.2 Why Use Cloud Computing Simulation Tools . . . 44
5.3 Cloud Computing Simulation Tools . . . 44
5.3.1 CloudComputing Simulation Tools Comparison . . . 45
5.4 IPTV in the Clouds . . . 47
5.4.1 Architecture . . . 48 5.4.2 The User . . . 48 5.4.3 The content . . . 49 5.4.4 The Cloud . . . 50 5.5 Summary . . . 52 6 STB Modelling 53 6.1 User Actions . . . 53 6.2 Channel Tune . . . 55 6.3 Browser Panel . . . 55 6.4 Trick State . . . 57 6.4.1 Play . . . 57 6.4.2 Pause/Stop . . . 58
6.4.3 Fast Froward/Rewind . . . 58
6.4.4 Record . . . 59
6.4.5 STB-Live Tv . . . 60
6.4.6 STB-Live TV Channel Tune . . . 61
6.4.7 STB-Live TV Browser Panel . . . 62
6.4.8 STB-Live TV Recording . . . 63
6.5 STB VOD/DVR . . . 64
6.5.1 STB VOD . . . 64
6.5.2 STB DVR . . . 65
6.6 User STB and Network Interactions . . . 66
6.6.1 Live TV and Browser Panel . . . 66
6.6.2 Trick State and Recording . . . 67
6.6.3 Digital Video Recording . . . 68
6.6.4 Video On Demand . . . 69
6.6.5 ON/OFF and Standby/Resume . . . 70
6.7 STB Logs . . . 71
6.8 Summary . . . 71
7 Experimental Results 73 7.1 Simulation Objectives . . . 74
7.2 Used Simulation Platform . . . 74
7.2.1 CloudSim Architecture . . . 75
7.2.2 How To Create A Simulation . . . 78
7.3 Users Behavior Mapped To Cloudlets . . . 80
7.3.1 On and Off Cloudlet . . . 81
7.3.2 Channel Tune . . . 81
7.3.3 Session Length . . . 81
7.3.4 Off State . . . 82
7.3.5 Browser Panel . . . 82
7.3.6 TrickState . . . 82
7.3.7 User Activity Map . . . 86
7.4 User Behavior Datasets . . . 87
7.5 Log Synthesizer . . . 88
7.5.1 TimeStampGenerator . . . 88
7.5.2 LogSynthesizer . . . 89
7.5.3 Log Synthesizer Finite State Machine . . . 92
7.6 Generated Log Example . . . 96
7.7.1 Datacenter Configuration and Cost . . . 97
7.7.2 User Action Processing Cost and time . . . 98
7.7.3 User Cost . . . 99
7.7.4 Active users and sessions . . . 100
7.7.5 Activity Cost . . . 102
7.7.6 Energy Usage . . . 103
7.8 Summary . . . 104
8 Conclusions and Further Work 105 8.1 Obtained results . . . 105
8.2 Discussion . . . 107
8.3 Final Remarks . . . 109
List of Figures
1.1 Our Vision of CC and IPTV . . . 4
2.1 Basic IPTV Architecture.(adapted from [1]) . . . 6
2.2 TISPAN IMS Architecture.(adapted from [2]) . . . 8
2.3 IPTV Architecture steps.(extracted from [3]) . . . 10
2.4 ITU-T FG IPTV Architecture.(extracted from [4]) . . . 11
2.5 MPEG-4 AVC vs MPEG-2.(extracted from from [5]) . . . 12
2.6 Access Network .(extracted from from [6]) . . . 14
3.1 Active Users (extracted from [7] ) . . . 19
3.2 Active Users (extracted from [8]) . . . 20
3.3 IPTV Session (extracted from [7]) . . . 21
3.4 ITPV Session (extracted from [8]) . . . 21
3.5 User Zapping (extracted from [8]) . . . 22
3.6 STB Activity (extracted from [9] ) . . . 24
3.7 Channel Tune Events (extracted from [9] ) . . . 25
3.8 Channel Tune Duration (extracted from [9] ) . . . 25
3.9 PIP viewing pattern (extracted from [9] ) . . . 26
3.10 Trick State pattern (extracted from [9] ) . . . 26
3.11 Stream Management Stream Request pattern (extracted from [9] ) . . . 27
3.12 On and Off Session Length (extracted from [10] ) . . . 28
3.13 On and Off Session Activity During The Course of a Day. (extracted from [10] ) 28 3.14 Channel Switch events (extracted from [10] ) . . . 29
3.15 Channel Popularity (extracted from [10] ) . . . 30
3.16 Channel Popularity Kids vs News vs Digital Video Recorder (DVR)(extracted from [10] ) . . . 30
4.1 Grid Architecture.(extracted from [11]) . . . 34
4.2 Cloud Architecture.(extracted from [11]) . . . 34
5.2 The User and the Virtual STB. . . 49 5.3 The Content. . . 49 5.4 The Cloud. . . 50 5.5 Multiple ISP’s. . . 51 5.6 Rewind TV. . . 51 6.1 User Actions . . . 54 6.2 STB Actions . . . 54 6.3 Channel Tune . . . 55 6.4 Browser Panel . . . 56
6.5 Trick State Play . . . 57
6.6 Trick State Pause/Stop . . . 58
6.7 Trick State Fast Forward/Rewind . . . 59
6.8 Trick State Recording . . . 60
6.9 STB Live TV Channel Tune . . . 61
6.10 STB Live TV Browser Panel . . . 62
6.11 STB Live TV Recording . . . 63
6.12 STB VOD . . . 64
6.13 STB DVR . . . 65
6.14 Live TV and Browser Panel Interactions . . . 66
6.15 Trick State and Recording . . . 67
6.16 DVR . . . 68
6.17 VOD . . . 69
6.18 ON/OFF - Standby/Resume . . . 70
6.19 STB Logs . . . 71
7.1 CloudSim Architecture(extracted from [12] ) . . . 75
7.2 CloudSim Class Diagram (adapted from [13] ) . . . 76
7.3 CloudSim Classes Definition . . . 76
7.4 Simulation Howto . . . 79
7.5 Main Activities . . . 92
7.6 Sub-Activities Chanel Tune . . . 93
7.7 Chanel Tune Time . . . 94
7.8 Chanel Tune Trick State . . . 94
7.9 Sub-Activities TrickState . . . 95
7.10 Synthesized Log Sample . . . 96
7.11 Processing Cost 25 Users . . . 98
7.13 User Cost Evolution . . . 100
7.14 Active Users . . . 101
7.15 Number of Sessions . . . 101
7.16 VOD Activity Cost . . . 102
7.17 DVR Activity Cost . . . 102
7.18 Average Power Consumption . . . 103
List of Tables
2.1 Qos/QoE Layered Model . . . 15
4.1 Service Models (adapted from Wikipedia) . . . 37
5.1 Simulation Tools Overall Comparison . . . 46
5.2 Cloud Computing Simulation Comparison . . . 46
5.3 Hardware Simulation Comparison . . . 46
5.4 Network Simulation Comparison . . . 47
7.1 Cloudlet and activity arguments . . . 86
7.2 Starting time probabilities . . . 88
7.3 Major User Actions Probabilites . . . 89
7.4 Derivated Actions and Probabilites . . . 90
7.5 Channel Tune Probabilities . . . 90
7.6 Trick State Live TV Probabilities . . . 90
7.7 Trick State VOD Probabilities . . . 91
Acronyms
3GPP 3rd Generation Partnership Project API Application Programming Interface ADSL Asynchronous Digital Subscriber Line CC Cloud Computing
COPS Common Open Policy Service CPU Central Processing Unit
DRM Digital Rights Management
DSLAM Digital Subscriber Line Access Multiplexer DVB-T Digital Video Broadcast Terrestrial
DVR Digital Video Recorder
ETSI European Telecommunications Standards Institute FG Focus Group
FTTB Fiber To The Building FTTH Fiber To The Home FTTN Fiber To The Node FTTX Fiber To The X GC Grid Computing
GUI Graphical User Interface HD High Definition
HTML Hyper Text Markup Language HTTP Hyper Text Transferences Protocol IaaS Infrastructure as a Service
ICC Instant Channel Change
IMS IP Multimedia Subsystem IP Internet Protocol
IPTV IP Television
ISP Internet Service Provider IT Information Technology
ITU International Telecommunications Union Mbps Megabit per second
NAL Network Abstraction Layer NASS Network Attachment Subsystem NGN Next Generation Network
OLT Optical Line Terminal
OVF Open Virtual Machine Format PaaS Platform as a Service
PIP Picture In Picture
PSTN Public Switched Telephone Network QoE Quality of Experience
QoS Quality of Service
RACS Resource Admission Control Subsystem RTSP Real Time Streaming Protocol
S-STB Software Set Top Box SaaS Software as a Service SD Standard Definition
SIP Session Initiation Protocol
SMSR Stream Management Stream Request STB Set-top Box
Telco Telecommunications Operator
TISPAN Telecommunications and Internet converged Services and Protocols for Advanced Networking
VO Virtual Organisation VOD Video On Demand VoIP Voice over IP
VPN Virtual Private Networks XDSL Digital Subscriber Line
Chapter 1
Introduction
1.1
Introduction
Internet Protocol (IP) networks have evolved from being the solution for data communica-tion between computers. They can now go farther and further providing greater reliability and Quality of Service (QoS). We are now witnessing the appearance of an ”All-IP” network as the evolution of this protocol suite who has allowed for the convergence of major services(Data, Voice, TV ...). This ”All-IP” network is a synonym of Next Generation Network (NGN)[14].
With the evolution of the IP protocol there has also been an rise of applications with more strict QoS requirements. Besides elastic applications, currently we are surrounded by a new set of diversified applications with special needs regarding bandwidth, packet loss, delay and jitter. Applications, with strict QoS requirements ,like Voice over IP (VoIP) and IPTV are now very common.
Infrastructure Evolution
We are evolving for that ”All IP” network that we have mentioned previously, and to be able to provide it to the home/corporate users there is a need for new infrastructures. Although the old copper wires can still support the current services, in the long run there will be a need for greater bandwidth.
The access infra-structure has also evolved, nowadays we have new technologies like Digital Subscriber Line (XDSL) and Fiber To The X (FTTX) that support high speed connections and offer greater availability. The popularity and price drop for both Internet Service Provider (ISP) and users of these kind of technologies, have turned them prone to be used as residential and corporate means of access and distribution of services/content.
Users Evolution
The engine that turned the wheels of evolution, when it comes to networking technologies, is the user. Users have a great demand for quality, reliability and speed when it comes to networking, they tend to demand for more bandwidth, more uptime and less errors.
Users are also becoming more informed, they are aware of the capabilities and some of the technologies behind networks, and claim for new types of services.
Services like VoIP and IPTV are now more common then they where 5 years ago, ISP’s are receiving more and more requests to have these kind of features available among their product offer. On the other hand, we also have ISP’s, that plan and implement more aggressive commercial campaigns with the offer of products for every user’s needs.
TV Evolution
The evolution of users has also brought an evolution of their demands regarding currently available media. The television set has been the center of our entertainment life for about 60 years, then we had a shift on users interests and the computer took over with the Internet and it’s social networks and video sharing sites.
Now we are seeing that the users are no longer passive, their request for interactive media has brought the TV to the Internet, and the junction of both gave birth to IPTV. Users can now take control of their TV anytime and anywhere. As TV runs under IP it can also be viewed in computers and cellphones, users can pause, rewind, record and even schedule recordings of their favorite shows.
1.2
Motivation
Most ISP’s offer the IPTV service as the solution to the lag between the user’s everyday life and the TV broadcast. They offer the ability to schedule recordings and stop/rewind capabilities, but they miss the anytime/anywhere option that most users desire.
The possibility of TV viewing on-the-go as we commute from home to work and vice-versa, sharing a recorded movie with a friend or relative would be much appreciated and could add to the list of extra services an ISP would be able to offer.
We believe that such a future is possible and would like to discuss possible architectures and simulate the behavior of such a system. We also believe that the ISP’s could decrease their operational costs, by taking advantage of the elastic properties of CC.
To be able to provide users with a quality service, ISP’s have the need for computational resources, data storage and bandwidth that can follow the increasing number of subscribers. Streaming video or providing a VOD session to thousands and even millions of users require a
lot of resources and it is here that CC comes in handy.
There is also the possibility of providing extra services since all the user data is concentrated in one ore more clouds that are under the management of the ISP. The new services could be for example Social TV where user’s could interact, recommending specific channels and services to each other.
With the appearance of smart TV’s that connect to the Internet we have a new way of accessing information and services in our living room. These devices have a lot of capabilities, allowing for network connection, video decoding, recording and human interaction.
We believe that the appearance of these devices have paved the way to de disappearance of the STB from our homes and the creation of virtual STB that are located in the cloud. This will lead to a decrease of the cost’s ISP’s have with purchasing and deploying these equipments, those funds will probably be channeled to the creation of new services and features.
1.3
Objectives
Our objective it to study and evaluate the possibilities that CC has to offer in terms of on demand growth and availability. We believe that these characteristics will enable CC to support the evolution of IPTV in the future. Our specific objectives for the elaboration of this work were the following:
• Survey IPTV and Cloud Computing to evaluate the possible synergies between a next generation IP based Television service and the Cloud;
• Modelling the IPTV Set-Top Box, namely the interaction with user and with the network. All the external interaction and internal processing and storage operations need to be modelled to have the complete design of all the used algorithms;
• Study the IPTV user behaviour based on existing literature to be able to synthesize user actions with an automatic log generator. As we have not access to STB logs owned by IPTV Service providers, we need to use a meta-analysis [15] of the related literature to generate our own logs;
• Design of cloudlets for each STB operation using the achieved models. These cloudlets will enable us to run our virtual STB on a cloud simulation environment;
• Based on the STB representation using cloudlets and the feed provided by the synthesized user activity, run a set of simulations on a Cloud Simulator;
• The simulation results, with a variable number of TV users, will give us an estimative of costs to support such Cloud based IPTV Service;
Smart TV’s are becoming more and more popular, they have the ability to connect to the Internet and access social networking sites and VoIP services. We believe that they will also be able to connect to the cloud and make use of it’s services. Since TV’s do not have any storage or mobility capabilities we believe that CC will be able to help us with that.
Our vision (Figure 1.1) is to send the STB to the cloud and access it through a Smart TV, Smartphone or even a tablet. We want TV to be available anytime and anywhere, wether you are at home using your smart TV, commuting and using your smartphone to catch the latest episode of your favorite series, or even when visiting a friend or relative and show them on your tablet that movie you’ve enjoyed.
Figure 1.1: Our Vision of CC and IPTV
We want to move the STB to the cloud and take advantage of the possibilities CC has to offer in terms of resource escalation and storage management. By using a CC environment we can provide the service to a whole range of devices that can connect to the Internet.
For that to be possible we have to define and model the behavior of a STB and study it. We need to study the capabilities of CC and how does it behave during load and the mechanisms it offers to prevent resource starvation. We also have to map the interactions between the user, the STB and the network and analyze how they work together.
After having mapped and studied these activities we wanted to see how would it behave in a CC environment. For the creation of a real life test environment we would need to have
access to log from ISP’s with data regarding the behavior of user, but without that information available we had to improvise and create our own log generator. With the information about the activities a STB operates and the creation of logs to simulate a real life environment we did a simulation of how would a virtual STB behave in a cloud computing environment.
We have come to the conclusion that it would be possible to move the STB to the cloud but it would be expensive for a small amount of users. We believe that it would be less expensive if we took advantage of economies of scale for the procurement of a CC environment to deploy our solution.
1.4
Document Structure
Our objective is to uncover a small amount of the veil that covers the evolution of IPTV. We believe that the next logical evolution step for IPTV is towards The Cloud.
In Chapter 1 we make a small introduction to tour work and talk about the evolution of Internet and it’s infrastructures and discuss the motivation and structure our work.
In Chapter 2 we start by discussing the way IPTV has evolved and the standards that are being developed. We discuss the architecture of IPTV and the way it is structured.
in Chapter 3 we study and model the behavior of users, how they interact with IPTV service and what are their utilization patterns.
In Chapter 4 we shift our focus to CC, we study it’s origins and compare it to Grid Computing (GC). We present the different service and deployment models of CC and have a small discussion regarding the (in)-existence of standards.
In Chapter 5 we join the two previous subjects and propose a question regarding the pos-sibility of CC being the future of IPTV. We also discuss the content delivery by using CC and talk about some of the simulation tools that can be used to model such a scenario. Finally we propose an architecture for the creation of IPTV in the Clouds.
In Chapter 6 we discuss the subject of STB, we model the possible user actions while interacting with the equipment. We create diagrams explaining the interactions and actions that take place while the users send commands to the STB
In Chapter 7 we start by discussing the utilization of the CC simulation tool that we have decided to use. We describe and show how a simulation can be created using CloudSim, we model the users activities to Cloudlets and create simulations that help us to gather some data regarding our initial proposition. The results of those simulations are then presented and discussed.
In Chapter 8, we discuss the results we have found and make some critical observations regarding the work we have developed. We propose some further work and present our concu-sions.
Chapter 2
Television over IP
In this chapter we wish to discuss IPTV. It can be seen as the natural evolution of TV, in the Internet era. We should point that IPTV is not the same as Internet TV, it is delivered over an ISP’s infrastructure that has been carefully thought(Figure 2.1), so it can provide the best QoS to it’s clients. Internet TV is just a service that can be used through the Internet so that users can access media content streamed over the net.
In order for an IPTV service to be provided, the ISP’s network infrastructure has to be care-fully though off, components like Head-end encoders and Digital Rights Management (DRM) servers, among others, should be available. IPTV is quite bandwidth demanding, for each TV channel it needs approximately 2 Megabit per second (Mbps). Now imagine that a ISP offers 100 channels, this means that the backbone should have at least 200Mbps The network should also be reliable because if you miss any frames during a TV show you might loose some important part of it, the same can be said for audio.
When we look at Figure 2.1 we can have an idea about how an IPTV service is composed of. On one side we have the Video Encoders, that obtain the TV shows and movies and encodes them so they can be sent to the clients through the network or stored on the Video On Demand (VOD) Server for future renting.
The streams that represent the TV shows or movies a user might rent are all sent from the ISP’s network to the Digital Subscriber Line Access Multiplexer (DSLAM) near the user’s house and from there are distributed to the subscribers of each channel through their network access interface which is the Asynchronous Digital Subscriber Line (ADSL) Modem, but not before having authenticated on the Billing System that monitors the access of user to the service.
The final step is made from within the user’s hour, the stream is collected and organized by the STB and presented through the TV set. All this transmission is made with great care and with QoS measures that prevent the failure or improper functioning of the service.
2.1
Next Generation Networks
When working with technologies that evolve so rapidly as networking, one needs to be aware of the current standards, for that to occur, there is a need to identify the main players when it comes to IPTV and networking infrastructures.
The compass points towards International Telecommunications Union (ITU) and European Telecommunications Standards Institute (ETSI) - Telecommunications and Internet converged Services and Protocols for Advanced Networking (TISPAN), as the main players regarding IPTV and it’s complementary technologies. IPTV is supported by IP Multimedia Subsystem (IMS) [2] which is supported by NGN[14]. Both of the organizations have created Focus Groups, in order to discuss and create worldwide standards.
In networking, NGN is the buzzword that is heard the most nowadays, this is a term used by the networking industry, to summarize all the technologies and mechanisms that will be implemented within the next years. The concept of NGN is to be able to transport every kind of information, whether it’s video, audio, data or even voice through a single network. NGNs are the evolution of both networking infrastructures and protocols, they provide the convergence of networking services and availability through it’s several interfaces.
One of the most challenging aspects of NGNs, is to develop means of evolving the current Public Switched Telephone Network (PSTN) lines that have been deployed by Telecommunica-tions Operator (Telco). Not all the networks have the same sort of infrastructure and services, so the ITU [14] and ETSI-TISPAN [2] created a Focus Group responsible for all aspects regarding NGN.
The ITU’s NGN Focus Group (FG) and ETSI-TISPAN were responsible for the creation of the NGN Standards, so that Telcos would be able to keep up with the momentum regarding
NGN.
The future of NGN will most certainly pass through the implementation of FTTX infrastruc-tures, that will allow Telcos to provide greater bandwidth and increased QoS to their costumers. Portuguese Government is promoting the usage of optical fiber throughout the country, and is boosting the creation of infrastructures so that NGN can reach most of the population.
The usage of optical fiber as a mean of access by Telcos, resides on the fact that it can provide greater bandwidth and also carry the signal farther. It is more reliable, because it doesn’t suffer from any kind of interference. It is more secure, because it can not be tampered with, and finally it has a longer life span compared to copper wires. Despite having all the previous mentioned qualities, optical fiber has the disadvantage of being more fragile and prone to rupture if not handled properly.
2.1.1
IP Multimedia Subsystem
Since NGN’s access architectures have been referred, we should also mention the main functional architecture used for delivering multimedia services within the NGN context. The afore mentioned architecture is called IMS, developed by ETSI-TISPAN and the 3rd Generation Partnership Project (3GPP) [2, 3] . This architecture, is one of the steps towards the All IP network: It allows for the integration of several services within a network infrastructure. One of it’s most significant aspects is that it does not care about the access technology used to connect to a specific service. It seamlessly provides that service taking care of the QoS aspects, and adaptation methods for each single connection type.
IMS Architecture
The TISPAN IMS architecture, is defined by three layers [2]: the application layer, the control layer and the transport layer, as can be seen in Figure 2.2. The application layer, consists of the application servers that host the IMS services and the home subscriber server. The control layer is composed of several systems, among them the IMS Core.
The transport layer consists of the User Equipment, the Access Network, the Resource Admission Control Subsystem (RACS) and the Network Attachment Subsystem (NASS).
IMS is mostly used for flow and session control [2].
In order to work, IMS needs two other non standard subsystems: RACS and NASS. These two systems are responsible for dynamic configuration, authentication and admission control [2, 3] . IMS uses several standard protocols for session establishment, authentication and policy support. Protocols like Session Initiation Protocol (SIP) [16], Diameter[17] and Common Open Policy Service (COPS) [18], together with the IMS core functions, transform this solution into an all-in-one package, for network management and implementation [2] . One of the characteristics of IMS is that, it provides seamless service integration on network infrastructures. Nowadays, one of the most requested services is IPTV, and IMS has also a solution for it’s integration.
IMS allows for the possibility of user mobility and service access by multiple equipments through different network types.
Translating this to the diagram we see in Figure 2.2, a User who is viewing an IPTV stream (User Profiles, Applications) from his smart TV (User Equipment) wishes to leave his home and continue viewing the same show on the bus. He stops the show on the smart TV and uses his smartphone(User Equipment) to connect to this IPTV provider with the same user and password.
Here is where the Service Subsystem kicks in, by becoming the intermediary between the service the user is accessing through one of his equipments and a specific kind of Access Network. The Service Subsystem uses the NASS to provide the User Equipment with the configura-tions to use the new type of Access Network. Information is also sent to the RACS so it can adapt the IPTV service to the new kind of Access Network.
All of these adaptations and service preparations are managed by the Service Subsystem which sends the new adapted stream from the RACS to the users smartphone so he can continue viewing the same TV show(User Profiles, Applications).
This kind of services that allow for the adaptation of the service to any kind of media it is being access through will allow for the improvement and appearance of new services and ways to interact with networks.
One of the characteristics of IMS is that, it provides seamless service integration on network infrastructures. Nowadays, one of the most requested services is IPTV, and IMS has also a solution for it’s integration.
2.2
IPTV Architecture
In order to understand how IPTV works we have to review it’s architecture and the way all the components work together to provide the service. In the early stages of IPTV the available
solutions did not take in consideration the NGN subsystems and were focused on vendor specific products that did not allow for the integration of services.
With the advent of IMS as a proper standard, ITU and ETSI -TISPAN included it as a part of the NGN standard. Providers were deploying network infrastructures without looking into the standards and something had to be done if Providers wanted to be able to keep up with the evolution of IPTV services.
With this idea in mind Mickoczy et al . [3] decided to define an evolution of IPTV architec-ture towards the NGN. They proposed to reach this goal with four major steps(Figure 2.3): the first is a non NGN IPTV, the second is a NGN non IMS IPTV , the third a NGN IMS IPTV and the fourth a NGN converged IPTV.
Figure 2.3: IPTV Architecture steps.(extracted from [3])
Each one of these steps explains the path that should be made in order to create a converging our IMS based NGN IPTV solution.
The first step is made up of all first generation IPTV implementations that where made without regards to standards and norms. These were vendor specific implementations of IPTV without any regards for standards and interaction with other services.
The second step introduced components like NASS and RACS for the control of users and profiles and access to services. These implementations took a little more care in thinking about standards and interactions by introducing components that allow for a better management of resources and interaction with other services.
The third step is a implementation of IPTV based on IMS. This is the desired evolution for all IPTV systems, allowing for the adaptation of the service to the kind of network it is being used and also allowing for the mobility of users between networks and equipments.
The fourth step is the integration of IMS and nonIMS IPTV architectures, since not all providers will change their systems to behave in a standardized manner. This provides a way standardized IPTV services to interact with non standard IPTV services.
In the future not all IPTV implementations within NGN will be IMS based, that’s why step three and four are at the same level, meaning that not all Providers have the money or the technical expertise to create a full standard architecture. What they can do is create an architecture that can coexist with others that apply the standards.
Another view of the IPTV architecture is given by the ITU-T FG, and it describes that there can be three approaches [4] to IPTV architectures: non-NGN , NGN non-IMS and NGN IMS.
The afore mentioned architectures are quite similar to the ones previously mentioned. By the ITU perspective all of the IPTV implementations will undoubtedly be ported to an NGN IMS based IPTV architecture.
In their definition of an IPTV architecture the ITU defines four major functional domains as can be seen on Figure 2.4.
Figure 2.4: ITU-T FG IPTV Architecture.(extracted from [4])
The Content Provider owns or sells the media content, the Service Provider is a Telco that offers services to the end user, the Network Provider is the one that takes care of all the network infrastructure(he can also be the Service Provider), the End-user is the entity that accesses the network to obtain services.
We have also found a article by Silva et al . [5] that describes the basic IPTV architecture elements. We believe that it is a very clear explanation of what every component should be responsible for. IPTV depends on four basic components; the Video Head-End, ISP Core Net-work, ISP Access Network and Costumer premises [5]. Each one of them will be described on the following subsections.
2.2.1
Video Head-End
The Video Head-End is the place where it all starts. In this part of the system video signals and all the media that is to be distributed over the network are acquired. The digital and satellite TV signals are collected through satellite dishes, digital antennas, connections to media providers or direct connections to the TV Channel’s network. It is also the place where the on-demand content is also stored/gathered so it can be sent out to the costumers. Another main feature of this component is the codification of all the media in to a digital format such as MPEG-2/4. This is done so it is possible to encapsulate media into IP packets that are to be sent through the ISP’s network. The main codec used in the early IPTV solutions was MPEG-2[5], this solution allowed for the streaming of video over networks with very low bandwidth because only needed a 3Mbps link to successfully stream video.
With the appearance of h.264/MPEG-4 AVC [5] the streaming of video over the network became easier, due to the fact that it allows the coding of video with high quality at lower rates. It can be used in a lot of equipments and applications and also, with the inclusion of Network Abstraction Layer (NAL), it can adapt its coding according to the network type it will be streamed through. As we can see in Figure 2.5 MPEG-4 AVC allows for the availability of more channels per connection.
Figure 2.5: MPEG-4 AVC vs MPEG-2.(extracted from from [5])
By reducing the need for bandwidth, MPEG-4 AVC facilitates the existence of extra chan-nels for the same original bandwidth. Also by reducing the bit rate of the encoding process it also increases the distance a specific stream can travel through the medium.
2.2.2
ISP Core Network
The ISP Core Network is the place where all the magic happens. Here all the data that was previously acquired and encoded into MPEG-2/4 is encapsulated into IP packets and passed on to the ISP’s access network.
In order for the service to be provided with the best quality possible and to the highest possible number of costumers, the data is sent using multicast [19] IP communications. By using multicast communications the ISP allows the end user to join (tune) a specific multicast group so that he can choose which channel/groups of channels we wishes to view.
Multicast also allows for scalability a reduced latency and load of the ISP’s servers while tuning into a new channel.
The usage of the Internet Group Multicast Protocol (IGMP) [20] management is used because it allow for the ISP to manage to whom he wishes to send the content within the network. If normal point-to-point connections where used in IPTV services we would have a waste of bandwidth because every client would have to make a direct connection to the content he wanted to access. this would create a flood of requests through the ISP core network and could probably throw down the network.
By using different groups the ISP can filter content by simply allowing or disallowing some users access to it. Every time a user wishes to tune a specific channel, his STB sends an IGMP join message and the equipment is given access to the feed that is being transmitted through that specific group. When a user wants to change channel his STB sends an IGMP leave message followed by another join message so that the process of gathering the stream from other group is able to start. Also by using IGMP,
2.2.3
ISP Access Network
This part of the system is commonly named as the last mile, because it’s the last component between the user’s home network and ISP’s network. The distribution of the services within the ISP’s Access Network can be accomplished by using a variety of technologies such as XDSL, FTTX and mobile networks.
This network delivers the encapsulated content to the edge of the network where special equipments such as DSLAM or Optical Line Terminal (OLT) are ready to provide it to the end user’s equipment.
IPTV requirements are greater that the ones needed by traditional services, costumers expect the service to reach them without any failures or hickups.
IPTV requires a minimum bandwidth of approximately 3Mbps for Standard Definition (SD) video and 8Mbps for High Definition (HD) streams [6]. It is stated in [6] that the ”magic number” for a successful IPTV service is in the range of 20-30Mbps, allowing for 1 HD channel and up to 3 SD channels.
The usage of Fiber To The Node (FTTN) or Fiber To The Building (FTTB) technologies together with XDSL allow these kind of speeds to be available to the end user.
XDSL is also evolving and now can enable higher bit rates and bigger service coverage. ISP’s are continuing to evolve access network infrastructures to be able to present high quality services to their clients. These infrastructures include deployment of: FTTN where a DSLAM is placed on a street cabinet and the last mile connection is made with XDSL; FTTB where a small DSLAM is placed on the basement or entrance of a building and the rest of the connection is made using XDSL;Fiber To The Home (FTTH) where the fiber is sent directly
Figure 2.6: Access Network .(extracted from from [6]) to the costumer’s house.
With these different types of infrastructure deployment ISP’s can offer different speeds and ranges to their services as can be seen in Figure 2.6 .
FTTN allows for speeds of 18Mbps at distances of about 1Km,FTTB allows for speeds of 24Mbps at distances of about 0.5Km and FTTH allows for speeds of 100Mbps.
As we can see in Figure 2.6 the FTTN and FTTB speeds are lower that the ones of FTTH, this is due to the fact that the optical fiber is sent from the ISP’s central office into a concentrator and then the signal is shared between the users of the service. In FTTH implementations the optical fiber is sent directly into the client’s house, hence the higher speeds.
Despite not being the most effective in terms of bandwidth FTTN is still the deployment mode of choice for most ISP’s because it is cheaper and can still do the job.
2.2.4
Costumer Premises
The Costumer Premises is where the client’s network equipment and STB is located. The network equipment connects to the ISP’s Access Network and serves as the middle man between costumer’s home network and it’s STB.
user has joined/tuned in the STB. These packets are then and decoded so that they can be viewed by the end user.
The distribution of the content through the house can then be made using a variety of technologies such as coaxial cable, wireless networks or even ethernet.
2.3
IPTV Service Quality
QoS and Quality of Experience (QoE) are two concepts that must considered when it comes to IPTV.
While QoS refers to the Quality of the service provided by the underlying network protocols and equipments in IPTV infrastructures, QoE is the perceived quality of the end users.
Both of them can be measured and classified but QoE is much harder to quantify once it is mostly perceived by the end user and not by the equipment.
An ISP network can be projected in such a way that all the requirements regarding packet loss, jitter, bandwidth and load are met and still provide a bad QoS regarding IPTV. The packets can all arrive at the desired moment and all the bandwidth requirements can be met and still the user can complaint about QoE.
In order to provide a good QoS and QoE to the end user, the network must provide transport-layer and service layer performance [21].
Some state that in order to have QoS and QoE one must employ some kind of signaling [22] in the network for resource allocation and monitoring, others say that there should be a more vertical approach [21] to the issue of QoS and QoE by implementing NGN-Based IPTV.
There is also an approach to the problem of QoS and QoE by combining both in a layered model[23]. The main layers are Service, Application and Transport/Network Table 2.1.
QoE Domain User Service QoS Domain Application
Transport/Network Table 2.1: Qos/QoE Layered Model
The Service layer represents the part that is exposed to the user and the part where the QoE is measured, by the opinion of the user while enjoying the service. The Application layer, as part of the QoS domain is related to parameters of video application such as resolution, frame rate, color, codecs and the way they are implemented so that a specific QoE is achieved. The Transport/Network layer regards parameters as jitter, delay and packet loss. By using this approach we can manage two ”problems” as one but still specify the needs of each one of
them.
By using this method of QoS/acQoE management we can do a top down approach, first we start by identifying the QoE requirements, then the QoS requirements and finally the technology architecture.
If one is planning to have QoS and QoE, one must monitor the service and be sure that all the implementations that have been deployed are woking properly. The monitoring of video quality can be done in several ways, it can be done by using subjective methods and objective methods, but always in search of impairments such as blurring, color errors, jerkiness, object persistence, object retention and lip sync among others.
Subjective methods require that a group of people watch a video and give it some scoring, this method is not the most practical one to be used in live systems. Objective methods use a model of human quality perception implemented in some sort of automated test that monitor an IPTV deployment.
We believe that there is also another aspect that can improve both the QoS and QoE, and that it the usage of proper codecs. If one uses an H.264/MPEG-4 [24] codec instead of MPEG-2 as stated in [5] we can gain both a better compression rate and service better service coverage. In this field there is also an evolution, with the availability of H264/MPEG-4 SVC extension[25], the encoding and decoding of video allows for adaptation to the medium in which it is transported, wether it is XDSL,FTTX, or even Wifi.
H264/MPEG-4 SVC extension improves QoS and QoE by optimizing content for distribu-tion, it allows for de usage of older and newer equipment to decode stream by simply discarding the layer that has not been implemented on their codecs. By doing so media content can be streamed using H264/MPEG-4 SVC and viewed on equipments that implement older codecs that are compatible with SVC.
2.4
Summary
In this chapter we have discussed IPTV, it’s architecture and the way all it’s components interact, we have seen that the major struggles for this kind of service is the definition of standards that can be used to give the final users a more satisfying QoS and QoE. But some evolutions are on the way to help us reach semi-standard implementations of IPTV services and interaction between its components.
Implementations like IMS will allow for the interaction of for services and for the adaptation of the services to different kinds of networks and equipments.
The evolution of new ways of encoding and decoding IPTV streams will also allow for an improvement in both quality and availability of the service.
Finally the transport media evolution will also bring some possibilities for the growth of bandwidth allowing for quality and speed at the same time.
Chapter 3
IPTV User Behavior
Television has been the main media since the 1950’s, it has come a long way since the black and white broadcast channels. It has been subject to many technological advances, with IPTV being the latest one.
Now we have the opportunity to offer services with a better quality to the users. If one want’s to improve the QoS and QoE it is necessary to get to know the user’s behavior, and that is what we will be doing in this chapter.
We need to know how the user interacts with the system so we can provide him with a better experience, while reducing the usage of resources.
Each user, being a unique individual has its own behavior, it likes specific programs, content and dislikes others, he views television alone or in a group, he lives in a specific part of a country and has it’s own viewing habits. It is quite difficult, maybe even impossible, to create a profile of each user, that’s why it is easier to create global user profiles.
If we can create several profiles in which our users can fit in we are capable of creating specific content and provide it to them. With these profiles in our possession we are able to view user habits and provision our resources accordingly. In order to map the user’s behavior their usage of the system has to be analyzed and interpreted [8, 7] so that patterns can be found and studied. This can be done by means of meta-analysis [15], through the combination and analysis of results from other studies.
We can take some advantage from the utilization of the IP protocol, being a bidirectional mean of communication it can be used as a tool to infer user activities. With this information at hand we can take IPTV to the next level of QoE and QoS, while also taking advantage of this information to design and improve our infra-structure and media access.
3.1
Active Users
The usage of IPTV systems is not the same throughout the day and also the week, the system isn’t always loaded with requests and streaming content to every household. In [8] and [7] despite having very different dataset sizes, 350 households versus 250.000, they have come up with very similar patterns of IPTV usage, giving us data regarding the number of users in a given period of time.
In [8] we have a universe of 350 households of a Swedish municipal network that provides IPTV services to their users. They have found that the average number of people using the IPTV service had a distinctive pattern. The usage of the network was low during the morn-ing and started increasmorn-ing durmorn-ing the afternoon, peakmorn-ing at about 8PM and then decreasmorn-ing throughout the night both during weekdays and weekends (Figure 3.1).
Figure 3.1: Active Users (extracted from [7] )
In [7] we have data from a commercial IPTV supplier with approximately 250.000 users, despite having a dataset several orders of magnitude higher than the previous one, the same distinctive viewing pattern arises(Figure 3.2), uses a much more active during the afternoon and around dinner time and then start plunging throughout the night.
We can identify this as being the pattern the most of us follow during our working week. We wake up early and turn the TV on to catch the news, then we go to work and by lunch time we take a look a the news once again. In the middle of the afternoon the kids get home and start watching their favorite cartoons, when we get home the kids start doing their home work and the TV is turned of. When we finish dinner the TV is turned on once again and is
kept on until we go to bed.
Figure 3.2: Active Users (extracted from [8])
3.2
Session Length
We have reviewed the data regarding the number of users we can also review the data regarding session length, in both [8] and [7] they have found that user sessions that last longer are in lower quantity than the sessions that last for a small amount of time. This is related with the zapping time. Users tend to have lots of short sessions and only a few long ones.
In [7] they have realized that the session time increases from 1 to 4 seconds and then decreases very rapidly. This is due to the fact that 4 seconds is enough to perceive the TV channel and make the decision to view it or to change the channel. As we can see from Figure 3.3have the results from session length and from them we can infer that the huge amount of sessions that are between 1 and 4 seconds are due to zapping, the number of sessions that take more than 4 seconds are related to the interest of the users to continue viewing the same channel.
Figure 3.3: IPTV Session (extracted from [7])
Despite having a substantially lower dataset, in [8], we can also view in Figure 2.12 the same behavior regarding session length, there are a lot of sessions that last less than one minute and the sessions with a length of more then one hour are a very small number. Like we have said previously, here the users also do fast zapping in order to reach the desired channel.
Figure 3.4: ITPV Session (extracted from [8])
3.3
Channel Zapping
With all this data in hand we can conclude that most of the sessions that are started by users are transitional, probably due to the fact that in order to reach the desired channel one passes through a bunch of other ones that are in between.
This kind of behavior leads to the creation of a great number of meaningless usage of resources. The act of switching between channels triggers IGMP leave and join messages and forces the network equipment and the whole infrastructure to start a new session and prepare for a different stream from behalf of a new IGMP group.
In [26] they propose a solution for lowering the usage of resources and increasing the speed while changing channels. Their solution is based on the utilization of H.264/SVC which is an extension of the H.254/AVC, the later is composed of two parts, the base layer and one or more enhanced layers.
Normally when a user wishes to change a channel he uses the up and down buttons until reaching the desired channel. What if we could pre-join the channels the user will go through in order to save network resources? This is where the H.264/SVC come in handy. We can pre-join the base layer of a number of channels so when the user switches channels the stream is already at the equipment. When the user selects a specific channel to view, the base layer is the only one he has available and that is enough o start viewing the desired program, the STB just has to join the enhanced layer to provide for a better QoS. This is done so because the base layer consumes 10 times less bandwidth than the overall H.264/SVC stream.
In [27] there is also a proposition to minimize the zapping time by pre-joining channels, but in this case they only pre-join channels during the surfing period unlike in [26]. The proposal from [27] is to pre-joing only a small number o channels during a specific period of time. They decided to compare the pre-joining of 2,4,6,8, and 10 channels, for the period of 10,30,60 and 120 seconds with an ideal predictor and view the percentage of switchings with no delay. The ideal predictor provides almost no delay as it would be expected, but the pre-joining of only 2 neighbor channels for only one minute the delay is almost zero for 45% of the switching events as it can be seen on Figure 3.5
3.4
Modeling User Behavior
It is quite difficult to model the user behavior without any consistent data, one can estimate how the user behaves by extrapolating our own behavior and activity as users of IPTV services. While sometimes this can help us reach a significant knowledge regarding other areas, when it comes to human machine interactivity this is not always the rule to follow.
The best way to learn and know how a user behaves and interacts with an IPTV system is by accessing the data they produce while using the equipment within their homes. Most of the IPTV STB’s have a log mechanism that sends data back to the ISP for analysis and this information can be used to infer how a user interacts with the system and what are the patterns of activity he generates. This information can be later analyzed and used to improve QoE and QoS.
3.4.1
STB logs to the rescue
In [9] and [10] the authors have used such information from real ISP’s and used it to model and plot the user behavior, giving us a glimpse of how the users interact with an IPTV system. They have gathered logs from the STB’s to try and figure out what are the most common actions or options used by user while subscribing to an IPTV service. Despite having the same objective in mind the authors have decided to engage the problem in different ways. Silva et al. decided to gather statistical information and plot it. Qiu et al. also plotted the data but created mathematical models and a simulator of workloads to help study the user behavior.
3.4.2
User Activities
Contrarily to what one might think, the top activity that is logged by the STB’s isn’t channel change, according to [9] it is the 6th most occurring event, the activity that is logged the most is the SMSR. After having discovered which are the top activities that are logged by the STB, Silva et al. have decided to choose a set which reflected the user actions and not those of the STB itself. In Figure 3.6 we can se the top activities that where registered in the logs that where studied, we can also see if the where originated by the user or the STB.
Figure 3.6: STB Activity (extracted from [9] )
The events that where considered for the study where Chanel Tune, Browse Panel, Trick State, SMSR, Stream Management Detune and DVR Start Recording. So what do these events mean and how significant are they to define how a user behaves?
3.4.3
Chanel Tune
Channel Tune provides us with the information of the tune/join of a specific channel, it can be a live tv, a VOD or DVR channel. The tune of a live tv or a VOD channel implies that the user has to receive a new stream from the network, while the DVR stream video locally. The Channel tune event is lower during dawn, it increases during the morning until it peaks at about 13:00h and then slightly decreases during the afternoon and peaks again at 21:00h (Figure 3.7).
Figure 3.7: Channel Tune Events (extracted from [9] )
This is quite logical because people tend to view TV when they have spare time and that is around lunch and dinner time. With the data gathered in [9] we can see that 50% of the events are shorter than 8 minutes and 90% are shorter that 1,5 hours(Figure 3.8)
Figure 3.8: Channel Tune Duration (extracted from [9] )
This leads us to the conclusion that for most part of the day the system has a very low channel change and it peaks to about double at lunch and triple at dinner time. This doesn’t give us enough information to deduce that the System is in high load because there can be a lot of ”tune-in’s” and very low viewing time. For us to reach a conclusion about this matter we must view the other results.
3.5
Browser Panel
The Browser Panel event occurs when the user navigates through the Picture In Picture (PIP) version of the channels that the ISP provides through its STB Graphical User Interface (GUI). The PIP visualization of a channel can help the user decide which channel he will tune
into next. Like the previous event this one also follows the pattern of peak activity during lunch and dinner time(Figure 3.9).
Figure 3.9: PIP viewing pattern (extracted from [9] )
This data is helpful because it can help us provision for Instant Channel Change (ICC), by analyzing Channel Tune and Browser Panel together we can infer the ICC rate and demand across the day.
3.6
Trick State
Trick State events regard the user actions like pause, play and rewind wether it’s made during DVR,VOD or Live TV viewing. When Trick State regards to Live TV and DVR they don’t imply any special synchronization because the content is already within the costumer’s premises, but when it comes to VOD that’s not the case.
Figure 3.10: Trick State pattern (extracted from [9] )
Trick State applied to VOD increases the load on server because it needs to sync the streaming of content according to the users actions. As it would be expected the majority of
trick states regards DVR(Figure 3.10), because people use the STB’s recording capabilities to save shows that they can not view during the day or at the same time.
3.6.1
SMSR
Stream Management Stream Request is the event that occurs the most in the logs(Figure 17). Although it is not related to any user action in specific it directly related to the state of the STB. When the user is viewing Live TV, catching up some past shows on it’s DVR or viewing some movie through the VOD service, SMSRs takes place. This happens between the STB and the Server(VOD/Live TV) or between the STB’s that are spread across the user premisses(DVR). By analyzing Figure 3.11 we can see that the SMSR follows the same pattern as the Channel Tune and the Browser Panel activities, confirming once more the user’s IPTV viewing/usage follow and activity pattern.
Figure 3.11: Stream Management Stream Request pattern (extracted from [9] )
By analyzing the work made by Silva et al. we have concluded that the user’s activity follow the patter of moderate usage during dawn, this usage increases during the morning and peaks at 13:00h then it diminishes slightly during the afternoon and at around dinner time it starts increasing and peaks at 21:00h. In [10] Qiu et al. studied the on and off sessions of STB, Channel Switching, channel popularity and modeled Session length, channel popularity distribution and dynamics.
3.6.2
On and Off Sessions
An On Session is defined by the time a STB is switched on until it is switched off, similarly an Off Session is the period between the last time a STB was switched of until it is switched on back again.
Qiu et al. studied the length of both On and Off Sessions and discovered that around 5%(Figure 3.12)of the On and Off Sessions where higher than 1 day long. and that the Off Sessions had a heavier tail.
Figure 3.12: On and Off Session Length (extracted from [10] )
This is logical because a user normally leaves the TV turned off for longer periods than turned on. If nobody’s watching why should it be on? In this study they have also came across the same usage pattern the we have previously seen in [9].
In figure 3.13a/b we can see that during dawn there isn’t a lot of activity, but then in the morning users start turnig on their STB’s mostly for news updates and checking the weather, then activity start reducing and stabilizing until lunch time when it peaks just little bit, it keeps steady and then peaks again at dinner time, after that is starts decreasing throughout the night.
3.7
Channel Switch
Channel Switch is the period of time between the tuning of a specific channel and then switching to another different one. Once again we see the same pattern of usage and activity in Figure 2.22. The main behavior is the same but we can see that this specific event has more frequent spikes along the day. The spikes period is of approximately 30 minutes, which coincides with most of the TV shows alignment. Most users switch channel when a program ends or when there is a commercial break, and that leads us to the pattern that can be seen in Figure 3.14.
Figure 3.14: Channel Switch events (extracted from [10] )
Qiu et al. have divided Channel Switching into two categories: sequential-scanning and target-switching. Sequential scanning means that the users browse through the available chan-nels using the up/down buttons of the remote. Target switching represents the tuning of a specific channel. The total amount of Sequential switching is 54% and from those 75% are up channel switches.
3.8
Channel Popularity
Qiu et al. studied channel popularity and discovered that when it comes to popularity the top 100 channels are responsible for almost 63% of the channel viewing time(Figure 2.23). This leads us to the conclusion that the viewing habits of users are very simillar. We can also view the channel access frequency that is presented in Figure 3.15, the less skewed curve is due to the sequential channel switch events.
Figure 3.15: Channel Popularity (extracted from [10] )
We can also discover some interesting patterns in Figure 3.16, where we see the comparison of popularity between DVR, Kids Channels and Local News. We can see that Kids and Local News Channel peaks during the morning and then loose popularity, by the other hand DVR increases popularity through the course of the day and decreases in the night.
Figure 3.16: Channel Popularity Kids vs News vs DVR(extracted from [10] )
This brings us tot he conclusion that people tend to view the DVR channel when they are at home, at the end of the day, because that’s the period they have more available time.
3.9
Summary
In this chapter we have discussed user behavior while using IPTV services, the way they interact with the service and how we could use the STB logs to help us define this behavior.
We have come to the conclusion that there is a pattern in the service’s utilization. This can help us and the ISP’s provision for the peak user demands and also to study how we can make the system adapt to them.
The analysis of this data has given us some insight on how to model user behavior, the statistical data that has been gathered and studied from similar works will allow us to generate user behavior and create a life-like simulation of users activities.
Chapter 4
Cloud Computing
The evolution of network infrastructures that we have mentioned previously not only gave birth to a new and more QoS aware Internet but also paved the way to the evolution of services that are provided through the Internet.
Lately there has been a buzzword that is getting more and more attention from behalf of Information Technology (IT) Comunity, and that word is ”The Cloud”. It seems that The Cloud is the ”silver bullet” of modern times, the technology that the IT Comunity was waiting for in order to provide anytime/anywhere services that IMS and NGN talked about. Why the cloud? The cloud has been used for long time to represent both the PSTN and the Internet, it allowed for an abstraction of all the infrastructure and interconnected systems that composed them.
So what is Cloud Computing? By the definition of the NIST [28] ”Cloud computing is a model for enabling ubiquitous, convenient, on-demand network access to a shared pool of configurable computing resources (e.g., networks, servers, storage, applications, and services) that can be rapidly provisioned and released with minimal management effort or service provider interaction.”
Another definition of cloud computing can be found in [29], ”Cloud computing refers to both the applications delivered as services over the Internet and the hardware and systems software in the data centers that provide those services.”
Another one can be read in [30], ” Clouds are a large pool of easily usable and accessible virtualized resources (such as hardware, development platforms and/or services). These re-sources can be dynamically reconfigured to adjust to a variable load (scale), allowing also for an optimum resource utilization. This pool of resources is typically exploited by a payper-use model in which guarantees are powered by the Infrastructure Provider by means of customized SLAs”
As we can see CC is not just the software but also the hardware that is available on demand for the end user. CC can give us the illusion of infinite computing resources, they are available
when the user needs them and can always be extended whenever they are not enough to do the job.
So where can we find these services? Nowhere and everywhere, the cloud is spread across several data centers that share and manage the resources so that they can bee seen/access as a single unit. In this Chapter we wish to discuss CC, it’s origins and evolution, the Service models it is capable of providing and the development platforms that are available to study it.
4.1
Cloud Computing Origins
In 1961, John McCarthy stated that ”computation may someday be organized as a public utility” [11], in the early 90’s Grid computing was a major revolution in the way computational resources were shared and accessed.
Grids started by sharing resources within Virtual Organisation (VO), each VO represented an academic institution or a research project that would share it’s computational resources through a set of interfaces and middleware created to manage and redistribute computational power and storage.
Grids work by providing the users with service units which can in turn be traded by access to CPU cycles and other resources. CC is thought to be a evolution of Grid computing in the sense that Grid computing paved the way to the possibility of the ”utility computing” services by creating the paradigm of shared resources through the network and defining the tools, middleware, services and organization that compose Grid Computing.
4.2
Cloud Computing vs Grid Computing
CC and Grid Computing are two faces of the same coin, they strive to overcome the need of computational resources from behalf of both corporate and educational/research institutions. While CC is more corporate friendly and GC is more Educational prone, they both arose from the same principle, bringing computational power to the masses. They both differ in a lot of ways, mainly the security, programming model, business model, data model, applications and abstractions [11], but can interact and learn with each other in order to provide better services. ”So is Cloud Computing just a new name for Grid?” [11] we believe that yes, it shares the same principles of reducing the cost of ownership and maintenance while providing access to faster and more powerful computer resources. But also no, because GC is a more restricted use oriented paradigm, which does not scale to high numbers of machines and resources as CC. Also there is a more economical interest in CC than in GC, in order to have access to an CC environment with 1000’s of computers, one just needs a credit card an access to the Internet. By the other hand to access a GC infrastructure one must be part of some kind os scientific or
![Figure 2.3: IPTV Architecture steps.(extracted from [3])](https://thumb-eu.123doks.com/thumbv2/123dok_br/17765113.836177/28.918.256.660.378.705/figure-iptv-architecture-steps-extracted-from.webp)
![Figure 2.6: Access Network .(extracted from from [6]) to the costumer’s house.](https://thumb-eu.123doks.com/thumbv2/123dok_br/17765113.836177/32.918.178.738.99.538/figure-access-network-extracted-costumer-s-house.webp)
![Figure 3.1: Active Users (extracted from [7] )](https://thumb-eu.123doks.com/thumbv2/123dok_br/17765113.836177/37.918.228.681.428.781/figure-active-users-extracted-from.webp)
![Figure 3.3: IPTV Session (extracted from [7])](https://thumb-eu.123doks.com/thumbv2/123dok_br/17765113.836177/39.918.227.682.109.354/figure-iptv-session-extracted-from.webp)
![Figure 3.9: PIP viewing pattern (extracted from [9] )](https://thumb-eu.123doks.com/thumbv2/123dok_br/17765113.836177/44.918.264.659.168.406/figure-pip-viewing-pattern-extracted-from.webp)
![Figure 3.11: Stream Management Stream Request pattern (extracted from [9] )](https://thumb-eu.123doks.com/thumbv2/123dok_br/17765113.836177/45.918.241.681.450.715/figure-stream-management-stream-request-pattern-extracted-from.webp)
![Figure 3.13: On and Off Session Activity During The Course of a Day. (extracted from [10] )](https://thumb-eu.123doks.com/thumbv2/123dok_br/17765113.836177/46.918.130.789.761.990/figure-session-activity-course-day-extracted.webp)
![Figure 3.14: Channel Switch events (extracted from [10] )](https://thumb-eu.123doks.com/thumbv2/123dok_br/17765113.836177/47.918.242.668.347.642/figure-channel-switch-events-extracted.webp)
![Figure 3.15: Channel Popularity (extracted from [10] )](https://thumb-eu.123doks.com/thumbv2/123dok_br/17765113.836177/48.918.242.671.109.391/figure-channel-popularity-extracted-from.webp)