Universidade do Minho
Escola de Engenharia
André António dos Santos da Silva
Directed Evolution of Model-Driven
Spreadsheets
Universidade do Minho
Dissertação de Mestrado
Escola de Engenharia
Departamento de Informática
André António dos Santos da Silva
Directed Evolution of Model-Driven
Spreadsheets
Mestrado em Engenharia Informática
Trabalho realizado sob orientação de
Doutor João Alexandre Saraiva
Doutor Jácome Miguel Cunha
Acknowledgments
First of all, I would like to thank my supervisor and co-supervisor Prof. Dr. João Saraiva and Dr. Jácome Cunha, respectively, for granting me the opportunity to work on such an interesting subject matter, and for the huge support given to me during the duration of this thesis.
I would also like to extend my gratitude to Dr. João Paulo Fernandes for very valuable input regarding many aspects of the research.
My appreciation also goes to everyone that contributed to this thesis, be it a small or big contribution, especially to Jorge Mendes for all the work related to ClassSheet to automata conversion, integration with MDSheet, and for all the invaluable advice related to automata atomic operations.
Lastly I would like to give a very special thank you to the people that encouraged me in the last two years, and my family, especially my mother, Ana Santos.
This work is financed (or partially financed) by FEDER Funds through the Programa Operacional Factores de Competitvidade - COMPETE and by National Funds through FCT - Fundação para a Ciência e a Tecnologia under FCOMP-01-0124- FEDER-010048 and FCOMP-01-0124-FEDER-020532 projects.
Abstract
Directed Evolution of Model-Driven Spreadsheets
Spreadsheets are among the most used programming languages today. The easy to use and the intuitive nature of the visual interface makes them a preferred programming tool for any kind of individual or organization. The flexibility they provide to organize data as users need to is one of the reasons that makes them so popular. However, this flexibility also makes them very error-prone.
In order to improve spreadsheet quality and reduce the number of errors, software engi-neering practices were introduced, namely object oriented and model-driven techniques. These techniques enabled the specification of the spreadsheet business logic, which offers the possibility to better structure data, while at the same time narrowing the range of types of errors made by user input. While these developments had a huge impact, spreadsheet evolution is still an inherently human process, which is in itself error-prone.
In many real world applications of spreadsheets, they are used to store and disseminate data between different systems. Different systems can use different data formats, this leads to the need to change and adapt the data produced by a source system so that it complies to the data format consumed by a target system. Usually in these cases, both the initial and final data models are known in advance.
The objective of this thesis is to present techniques that enable data evolution to be made automatically, using model-driven spreadsheets.
Resumo
Evolução Dirigida de Folhas de Cálculo Orientadas por Modelos
Folhas de cálculo são um dos paradigmas de programação mais utilizados actualmente. A sua facilidade de utilização e reduzida curva de aprendizagem torna-as numa das ferramen-tas de programação mais utilizadas diariamente por milhões de indivíduos e organizações. A flexibilidade concedida pelas folhas de cálculo para organizar dados consoante a prefe-rência dos utilizadores é uma das razões que as torna tão populares. Esta flexibilidade tem, contudo, uma grande desvantagem: torna-as muito propícias a erros.
De forma a elevar a qualidade, e reduzir o número de erros em folhas de cálculo, foram introduzidas práticas já estabelecidas em engenharia de software, nomeadamente técnicas de desenvolvimento orientado a objectos e desenvolvimento dirigido por modelos. Com estas técnicas passou a ser possível especificar a lógica de negócio de folhas de cálculo, o que proporciona a estruturação dos dados nelas contidos e, ao mesmo tempo, limita o tipo de erros passíveis de serem cometidos pelos utilizadores. Embora estes desenvolvimentos tenham tido um grande impacto, a evolução de folhas de cálculo continua a ser um processo inerentemente humano, o que pode, ainda assim, originar erros.
Em muitos casos reais de utilização de folhas de cálculo, elas são utilizadas para armaze-nar e dissemiarmaze-nar informação entre diferentes sistemas. Diferentes sistemas podem utilizar diferentes formatos de dados, isto leva à necessidade de adaptar os dados produzidos por um sistema para que sejam compatíveis com um determinado sistema de destino. Nor-malmente nestes casos, ambos os modelos de dados são conhecidos à partida. O objectivo desta tese é apresentar um conjunto de técnicas que permitam fazer esta evolução de forma totalmente automática, utilizando para isso folhas de cálculo dirgidas por modelos.
Contents
1 Introduction 1
1.1 Spreadsheets. . . 3
1.2 Motivation . . . 5
1.3 Model-Driven Spreadsheet Engineering . . . 7
1.4 Model-Driven Evolution . . . 8 1.5 Research Questions . . . 9 1.6 Document Structure . . . 10 2 Model-Driven Spreadsheets 11 2.1 Templates . . . 11 2.2 ClassSheets . . . 13
2.3 Relational ClassSheets to UML+OCL. . . 16
2.4 Embedding of ClassSheet Models Within Spreadsheets . . . 18
2.5 Bidirectional Transformation of Spreadsheets . . . 19
2.6 Summary . . . 21
3 Operations Over ClassSheet Automata 23 3.1 ClassSheets as Automata . . . 25
3.2 Basic Operations over Automata. . . 31
3.3 ClassSheet Automata Operations . . . 34
3.4 Summary . . . 44
4 Directed Evolution of Model-Driven Spreadsheets 47 4.1 Model-Driven ClassSheet Evolution . . . 47
4.2 Summary . . . 59
5 Directed Evolution of Model-Driven Spreadsheets in Practice 61 5.1 Integration with MDSheet . . . 61
5.2 Evolution Scenarios . . . 62
5.3 Limitations . . . 68
5.4 Summary . . . 68
6 Conclusion 69
6.1 Answers To The Research Questions . . . 70
6.2 Future Work . . . 70
Acronyms
MDSD Model-Driven Spreadsheet Development
MDSE Model-Driven Spreadsheet Engineering
OOD Object-Oriented Development
MDD Model-Driven Development
MDSD Model-Driven Software Development
MDE Model-Driven Engineering
CSV Comma-Separated Values
XML Extensible Markup Language
DFA Deterministic Finite Automata
UML Unified Modeling Language
USE UML-based Specification Environment
OCL Object Constraint Language
BA Banco Alimentar de Braga
List of Figures
1.1 Month-by-month wage account Tablet . . . 1
1.2 Binomial Distribution Table . . . 2
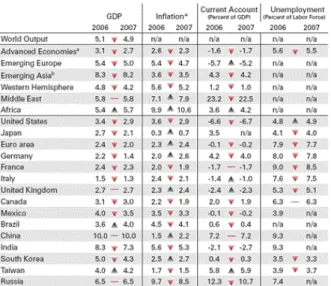
1.3 Economic Growth Table . . . 3
1.4 Computer Hash Table . . . 3
1.5 10-Column Worksheet . . . 4
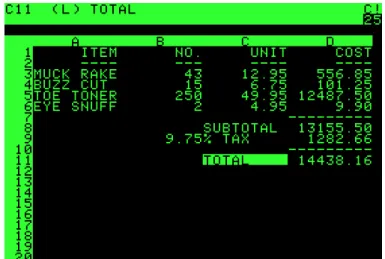
1.6 Visicalc Spreadsheet System . . . 5
1.7 ClassSheet Example Using The ClassSheet Editor . . . 8
1.8 Data Extraction Flow. . . 9
2.1 A template Model. . . 12
2.2 Template Instance . . . 12
2.3 Income ClassSheet And Corresponding UML Class Diagram . . . 14
2.4 ClassSheet Syntax . . . 14
2.5 ClassSheet Tiling Rules . . . 16
2.6 ClassSheet Tiling Structures . . . 16
2.7 ClassSheet Extensions . . . 17
2.8 Flights UML class diagram. . . 18
2.9 Embedded ClassSheets . . . 19
2.10 Airline Company Spreadsheet Instance . . . 19
2.11 Bidirectional Transformations . . . 20
2.12 Model Operarions . . . 20
3.1 Item Class Expressed As An Automaton . . . 24
3.2 Evolution Process . . . 24
3.3 Budget ClassSheet . . . 25
3.4 Textual Representation of Budget ClassSheet. . . 25
3.6 Pilots ClassSheet Automaton . . . 29
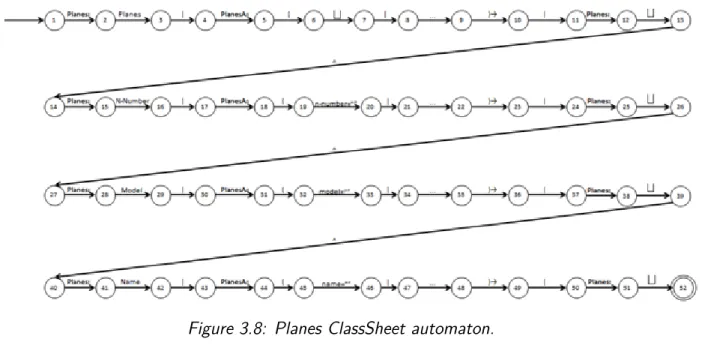
3.7 Planes ClassSheet . . . 29
3.8 Planes ClassSheet Automaton . . . 30
3.9 Generic Automaton . . . 32
3.10 Generic Automaton With A New Transition . . . 32
3.11 Generic Automaton With Edited Transition . . . 33
3.12 Generic Automaton With New State . . . 33
3.13 Generic Automaton With A State Removed . . . 33
3.14 ClassSheet Atomic Operations As A Sequence Of Basic Operations . . . . 34
3.15 Embedded Item ClassSheet . . . 35
3.16 Embedded Item ClassSheet Automaton . . . 35
3.17 Add Individual Cell Before Column x . . . 37
3.18 Add Column Before 1 . . . 37
3.19 Add Individual Cell After column x . . . 38
3.20 Add Column After 1 . . . 39
3.21 Cell Removed From Item ClassSheet . . . 40
3.22 Item ClassSheet Row 3 Structure . . . 41
3.23 Item ClassSheet After Add Row Before 3 . . . 41
3.24 Item ClassSheet Row 4 Structure . . . 42
3.25 Item ClassSheet After Add Row After 4 Operation . . . 43
3.26 Item ClassSheet After Set Cell (1,2) item_value=0 . . . 45
4.1 Quantified Atomic Operations . . . 48
4.2 Source And Target Models, With Equal Transitions, Before Evaluation . . 51
4.3 Source And Target Models, With Equal Transitions, After Evaluation . . . 52
4.4 Target Automaton Has One More Column, Before Evaluation . . . 52
4.5 Target Automaton With One More Column, After Evaluation . . . 52
4.6 Source Automaton In Last Row And Target Automaton With One More Column, Before Evaluation. . . 53
4.7 Source Automaton With Added Column . . . 53
4.8 Source Automaton With One More Column, Before Evaluation. . . 53
4.9 Automata Synchronized, After Evaluation . . . 54
4.10 Source Automaton With One More Column, Before Evaluation . . . 54
4.12 Target Automaton Has At Least One More Row Than Source Automaton,
Before evaluation . . . 55
4.13 Source Automaton Has One More Row, After evaluation . . . 55
4.14 Source Automaton Has One More Row, Before evaluation . . . 55
4.15 Source Automaton With Deleted Row, After evaluation . . . 56
4.16 Final Model Has New Row Preceding A Class . . . 56
4.17 Target Model After Row Preceding Class Is Inserted. . . 57
4.18 Source Model Has Row Preceding Class . . . 57
4.19 Source Model After Deleted Row Preceding Class . . . 57
4.20 Cells with different contents . . . 58
5.1 Pilots ClassSheet Model And Instance Before Evolution . . . 62
5.2 Pilots Target Model . . . 62
5.3 Evolve To Control. . . 63
5.4 Pilots ClassSheet Model And Instance After Evolution . . . 63
5.5 Planes ClassSheet Model And Instance Before Evolution . . . 63
5.6 Planes Target Model . . . 64
5.7 Planes ClassSheet Model And Instance After Evolution . . . 64
5.8 Budget Source Model Before Evolution . . . 64
5.9 Budget Source Instance Before Evolution . . . 64
5.10 Budget Target Model . . . 65
5.11 Budget Source Model After Evolution . . . 65
5.12 Budget Source Instance After Evolution . . . 65
5.13 Banco Alimentar De Braga ClassSheet Model . . . 66
5.14 Banco Alimentar De Braga ClassSheet Instance . . . 66
5.15 Banco Alimentar New UML Class Diagram . . . 67
5.16 Banco Alimentar New ClassSheet Model . . . 67
5.17 Banco Alimentar New ClassSheet Instance . . . 67
List of Algorithms
1 ClassSheet to DFA Conversion Function . . . 31
2 Transformations Sequences Algorithm. . . 50
Chapter 1
Introduction
For the last 4500 years tables have been used to structure information and as a major computational aid. Although they are very simplistic in nature, they are one of the most important mathematical tools used in scientific advancement. Its uses range from rep-resentation of mathematical functions to summarizing empirical values [Campbell-Kelly, 2007a].
Figure 1.1: Month-by-month wage account for the Sumerian temple of Enlil at Nippur, for the year 1295 BC [Robson, 2007].
One of the first civilizations to use tables was the Sumerian. Sumerians employed tables to keep track of livestock and wage account. Figure1.1 shows a tablet utilized to keep record
of monthly salaries of temple personnel for the Sumerian temple of Enlil [Robson, 2007]. The tablet data layout is very similar to current days data organization: column headings at the top of the table indicate month names and each row exhibits monthly wages for a person, with subtotals each six months and a yearly total. The last row indicates names and professions [Campbell-Kelly, 2007b].
Since the Sumerian civilization, tables have been used in many other applications, from statistic (Figure 1.2), to economy (Figure 1.3) and, more recently, as the development of dynamic table structures in computer science (Figure 1.4). These show that there is still importance in display information in a tabular way.
Figure 1.2: Binomial distribution table 1.
What makes tables so prevalent is that they allow to easily select, categorize, check, calcu-late and extract data. Data can be presented in such a way that it can be systematically processed.
Tables can be used to solve problems in almost every sphere of knowledge, the one we focus on this thesis is related to spreadsheets.
1 http://sites.stat.psu.edu/~mga/401/tables/binom.pdf. (19-09-2013) 2 http://www.ibrc.indiana.edu/ibr/2006/outlook/international.html. (19-09-2013) 3 http://www.cs.grinnell.edu/~walker/courses/153.sp02/lab-hashtables-inheritance.html. (19-09-2013)
Figure 1.3: Projected world economic growth for 2006 2.
Figure 1.4: Storage of names and numbers in a Hash Table 3.
1.1
Spreadsheets
The terms spreadsheet and worksheet originated in accounting even before electronic spreadsheets existed. Both had the same meaning, but the term worksheet was mostly used until 1970 [Campbell-Kelly, 2007b]. These worksheets, as shown in Figure 1.5, were
standardized 6 or 10 column pre-printed paper sheets used by accountants to construct trial balances. After 1970 the term spreadsheet became more widely used [Campbell-Kelly, 2007b].
Figure 1.5: 10-Column Worksheet 4.
While spreadsheets were very used on paper, they were not used electronically due to the lack of software solutions. During the 1960s and 1970s most financial software bundles were developed to run on mainframe computers and time-sharing systems. Two of the main problems of these software solutions were that they were extremely expensive and required a technical expertise to operate [Campbell-Kelly, 2007b]. All that changed in 1979 when VisiCalc was released for the Apple II system [Bricklin]. The affordable price and the easy to use tabular interface made it a tremendous success, mainly because it did not need any programming knowledge to be operated. VisiCalc was the first spreadsheet software to include a textual interface composed by cells, as seen in Figure 1.6, and established how the graphical interface of every other spreadsheet software that came after it would be like. Other important aspect included the fast recalculation of values every time a cell was changed, as opposed to previous solutions that took hours to compute results under the same circumstances [Campbell-Kelly, 2007b].
In 1984, Lotus 1-2-3 was released with major improvements, which included graphics gener-ation, better performance, and user friendly interface, which led it to dethrone VisiCalc as the number one spreadsheet system. It was only in 1990, when Microsoft Windows gained significant market share, that Lotus 1-2-3 lost the position as the most sold spreadsheet software. At that time only Microsoft Excel6 was compatible with Windows, which raised
sales by a huge amount making it the market leading spreadsheet system [Campbell-Kelly, 2007b]. A lot has changed since then: new forms of collaborative editing of spreadsheets
4 http://www.scoop.it/t/basic-accounting-concepts/p/716103071/ what-is-a-10-column-worksheet-in-accounting-click-here. (23-09-2013) 5 http://pt.wikipedia.org/wiki/VisiCalc. (23-09-2013) 6 http://office.microsoft.com/en-us/excel/. (27-10-2013)
Figure 1.6: VisiCalc spreadsheet system on an Apple II 5.
over the Internet were developed, like Microsoft Office 3657, and Google Drive8, and
free-ware alternatives were released, like LibreOffice Calc9 and OpenOffice Calc10, but Excel still holds the position as the most sold spreadsheet system today.
In spite of the huge evolution over the years, electronic spreadsheet systems still preserve the same basic interface established by VisiCalc. The data is presented in a tabular-like layout composed by cells, which can be individually referenced by a coordinate. Each coordinate is composed by a column, which is identified by a letter, and a row, which is identified by a number, for instance C3. Each cell can contain values or formulas, and a formula can reference a cell by the respective coordinate, or a range of cells , for instance, SUM(B3:B10).
1.2
Motivation
Spreadsheets are extensively used today in development of business applications. Estimates say that every year are produced tens of millions of spreadsheets worldwide [Panko and Ordway, 2008]. Besides being used to display data in a tabular-like interface they are also used collect information from different systems and to adapt data from one system to the format required by another [Cunha et al., 2012a].
7 www.microsoft.com/office365. (27-10-2013) 8 https://drive.google.com/. (27-10-2013) 9 http://www.libreoffice.org/features/calc. (27-10-2013) 10 http://www.openoffice.org/product/calc.html. (27-10-2013)
The fact that any person can exploit the full potential of a spreadsheet environment with-out any programming knowledge makes them a very attractive solution. Operating spread-sheets is very simple in nature: the structuring of data in a flexible two-dimensional tabular layout; basic operations like inserting and deleting of rows and columns; and direct data manipulation. These characteristics make it very intuitive and with a very soft learning curve. This flexibility, however, is also one of the main drawbacks of using this kind of environments: operators can insert data as they see fit but nothing prevents them from making mistakes. The lack of strict rules to define how a correct spreadsheet should be structured makes them very error-prone.
Some studies state that the vast majority, some of them going as high as 90%, of spread-sheets contain errors [Panko and Ordway, 2008; Panko, 2008; Powell and Baker, 2011; EuSpRiG]. What is more disturbing is that some of these spreadsheets are used in critical systems and can cause serious social, economic and political impact, as in the following examples:
• A missing minus sign in a spreadsheet formula caused the announced dividends to be distributed to Fidelity’s Magellan fund shareholders to be off by $2.6 billion. What was being accounted as $1.3 billion of net capital gain was actually a net capital loss [Catless, 1995].
• Canadian power company TransAlta lost $24M caused by a simple copy and paste operation on a spreadsheet [Register, 2003].
• University of Toledo, in the United States, loses $2.4M in projected revenue caused by a mistake in a spreadsheet formula [Blade, 2004].
• Australian party, Country Liberal Party, was forced to admit, on the eve of an elec-tion, that their reported financial costs had a difference of tens of millions of dollars and attributed it to a spreadsheet error committed by their accounting firm [ABC, 2005]. The next day the main opposing party, the Australian Labor Party, won the election with 52.5% of the vote, while the Country Liberal Party fell behind with 35.3%.
• In the London 2012 Olympics, 10,000 tickets were oversold to the synchronized swim-ming sessions. The error was caused when a member of the staff typed the value 20,000, instead of 10,000 tickets remaining into a spreadsheet [Telegraph, 2012].
European Spreadsheets Risks Interest Group (EuSpRiG)11 website has many other
exam-ples were the economic impact can range from a few thousands to billions of dollars.
1.3
Model-Driven Spreadsheet Engineering
The need to reduce errors in spreadsheets has been acknowledged long ago by the scientific community, leding to the development of techniques and tools that endow end users with a Model-Driven Spreadsheet Development (MDSD) methodology. One of the first forms of model-driven spreadsheets was proposed in [Ireson-Paine, 1997]. Using this method, models were defined using a textual language that would be later processed by a compiler. The result was the generation of spreadsheets conforming to the specified model. This method had some limitations, as it only worked with spreadsheet models with database-like tables. In [Erwig et al., 2005] the tool Gencel was introduced: it takes a model of a spreadsheet, dubbed template, and generates a spreadsheet conforming to that model. The consistency between model and instance is enforced by restricting the editing operations allowed to be carried out over the spreadsheet data. New operations, like add a set of columns with default cell values, are also added to help reduce errors. This method has some drawbacks: if an end user intends to update a model to reflect changes in a business model, this will break conformity with the instances.
In 2005 ViTSL [Abraham et al., 2005] was presented , along with a ViTSL editor. This allows to visually specify spreadsheets templates that can be passed to Gencel to generate the corresponding instances. This still has the same disadvantage of breaking conformity between model and instances when the model is updated.
Also in 2005 ClassSheets [Engels and Erwig, 2005] were proposed. This method is based on templates and uses concepts from Object-Oriented Development (OOD) and Model-Driven Development (MDD), namely classes and attributes. Using a Model-Driven Software De-velopment (MDSD) method, an end user can specify a spreadsheet business model, as seen in Figure 1.7, and using a ClassSheet editor similar to Gencel, generate the spreadsheet that holds the actual data. The same limitations of the previous cases are still present.
11
Figure 1.7: ClassSheet example using the ClassSheet editor, taken from [Engels and Erwig, 2005].
A method to derive models from spreadsheets, based in Model-Driven Engineering (MDE) concepts, was presented in [Hermans et al., 2010]. This allows to take advantage of patterns, usually found in spreadsheets, to generate the corresponding class diagrams.
Techniques for spreadsheet improvement were proposed in [Cunha, 2011], which allows, but is not limited, to migrate and refactor spreadsheets. This led to the development of HaExcel, a tool that, in some cases, improves spreadsheet productivity and reduces errors on spreadsheets, as concluded from the results of a study with end users [Beckwith et al., 2011a,b].
The HaExcel framework was later used to support ClassSheets evolution [Cunha et al., 2011], this is realized as a transformation system, with operations over models and in-stances, using the 2LT framework [Cunha et al., 2006; Cunha and Visser, 2007].
In [Cunha et al., 2012b] MDSheet was introduced: this tool allows for model specification in the same spreadsheet environment used for instance manipulation. It supports bidirectional transformations of models and instances, meaning that when a model changes, the instances are instantly co-evolved, and when an instance changes the model co-evolves automatically.
1.4
Model-Driven Evolution
Large software companies, banks, insurance corporations, and other enterprise class busi-nesses rely on spreadsheets to store, disseminate, and adapt data produced by a system to be processed by a different one. As a result, spreadsheets are part of the decision-making process for these companies, which means that they must be continually updated to reflect changes on the business model. Usually this process consists of extracting information
from a database to an intermediate file format, like a Comma-Separated Values (CSV) or Extensible Markup Language (XML) file that subsequently will be used to generate a corresponding spreadsheet, as described in Figure 1.8. Alternatively relational databases can be transformed into spreadsheets, and spreadsheets can be converted into databases [Cunha et al., 2009].
Figure 1.8: Data extraction and presentation flow.
In many real world applications of spreadsheets, different systems use different formats, so the data produced by one system has to be adapted to be consumed by a target system. Usually in these cases, both the spreadsheet initial format and final format, that is supposed to be consumed by the target system, are known in advance. The objective of this thesis is to take a step forward and propose techniques that allow the automatic evolution of spreadsheets that conform to an initial format so that they comply with a given final format.
1.5
Research Questions
The evolution method proposed, accomplishes ClassSheet model evolution at an automata level. To do this, the three following research questions must be answered.
• Can ClassSheet models be expressed as automata?
• Can model evolution operations proposed in [Cunha et al., 2012a] be
• Can an initial ClassSheet model expressed as automaton be consecutively
transformed, in a directed way, until it is equivalent to a given final au-tomaton?
From this point on, the focus of this thesis is to try to find affirmative answers to all these questions, as such it is divided in two major components, one theoretical and other practical.
The theoretical component is devoted to the study of model-driven evolution techniques. These techniques allow carrying out the transformation of an initial ClassSheet model to a final model known in advance. Models are represented by deterministic finite automatons, and initial work is developed to identify which transformation operations are to be applied to these automatons so that the final model can be explicitly attained.
The practical component consists on the development of a demonstration prototype capable of directed evolution of ClassSheet models and co-evolving the respective instances.
1.6
Document Structure
This thesis is structured as follows:
Chapter 2 Describes the state of the art of MDSD.
Chapter 3 Describes how ClassSheets will be represented as automata and how oper-ations over ClassSheet models introduced in [Cunha et al., 2012a] are related to automata operations.
Chapter 4 Presents how an initial ClassSheet model can be evolved until a final model is attained, and how the data that conforms to the initial model can be evolved so it conforms to the final model.
Chapter 5 Describes the integration of the developed prototype with the MDSheet tool.
Chapter 6 Concludes this thesis mentioning the work done, and with some suggestions for future work.
Chapter 2
Model-Driven Spreadsheets
For a long time the spreadsheet research community and tool vendors have tried to miti-gate spreadsheet errors by trying to introduce a set of guidelines and best practices, create spreadsheet templates, and develop specific tools to assist in spreadsheet application devel-opment, but they all center excessively on the low-level cell-oriented nature of spreadsheets [Engels and Erwig, 2005]. Spreadsheet development was still missing some well-established and proven software engineering principles likeOOD[Engels and Groenewegen, 2000] and
MDD [Kleppe, 2003].
2.1
Templates
A first approach was presented to step up from the low level development previously used to a model level [Abraham et al., 2005], where a spreadsheet structure is described by grouping cells together to form blocks that can be repeated vertically or horizontally. This process consists of defining a model, designated template, by means of a visual editor called ViTSL [Abraham et al., 2005]. ViTSL offers four visual elements to describe templates:
• Cells, represented by rectangles that can contain labels, values or formulas; • References, symbolizing concrete cell addresses;
• Vex groups, represented by vertical dots indicating the possibility of vertical expan-sion of a group of cells; and
• Hex groups, represented by horizontal dots indicating the possibility of horizontal expansion of a group of cells;
The models created using ViTSL are then be passed as an argument to a tool, dubbed Gencel [Abraham et al., 2005], that generates spreadsheets according to the defined model, and constrain the type of operations allowed to make over the instances so that they always comply with the underlying model. In Figure 2.1 shows a template for a budget spreadsheet defined using the ViSTL editor. One can see that the block composed by the columns C, D and E can be repeated horizontally, and that line 4 can be repeated vertically. In Figure 2.2 an instance of that model, generated for Microsoft Excel, can be visualized. The block composed by columns C, D and E has, in fact, two occurrences, and the block composed by line 4 has three occurrences.
Figure 2.1: A template defined using ViSTL.
Figure 2.2: Automatically generated Gencel spreadsheet.
Templates are an evolution over the old low-level development paradigm, and introduced model-driven development to spreadsheets, but had some limitations:
• The absence of connection between the modeling environment and the spreadsheet system prevented the synchronization between model and instances.
• Developers had to learn a different environment to be able to create the models. • Were still error-prone because users could easily make mistakes grouping repeating
blocks or wrongly introducing cell references.
2.2
ClassSheets
[Engels and Erwig, 2005] improved upon templates by introducing ClassSheets, a high-level model, based on object-oriented development, that allows describing spreadsheet business logic using concepts like classes and attributes. By using ClassSheets it is possible to group cells into logical units, identified by a name, that contain attributes with defined types, which closely match Unified Modeling Language (UML) classes. ClassSheet classes have some differences compared to UML classes though, namely, they can have labels, to help identify attribute names, formulas, and may be expandable, horizontally or vertically. In Figure2.3 an example for an income sheet is shown. From an object-oriented stand point the ClassSheet is composed by a summation object, named Income, which aggregates a collection of objects containing a single data value, and named Item. From a layout point of view there is a list of data values extended by the header Item, representing the
Item class, which in turn is embedded into the summation object that consists of a header
Income and a footer with a label Total and an aggregation formula assigned to an attribute total. Figure 2.3 also shows the corresponding UML class diagram.
As can be observed, one great advantage over templates is that cell references are no longer used. Instead, attribute names are utilized in formulas, making ClassSheet instances a lot less error-prone than templates. In combination with the visual representation, a formal definition was also introduced.
This formal representation allows to specify ClassSheet models textually using the abstract syntax presented in Figure 2.4. Using this syntax, a ClassSheet model can be defined in the following way:
Figure 2.3: Income ClassSheet and corresponding UML class diagram.
Figure 2.4: ClassSheet Syntax.
• A Class is composed by fixed or vertically expandable blocks of cells.
• Each of the cells can be comprised of values and attributes or possibly empty. • Attributes have a name (a) and a formula (f ) defining its value, that can be referenced
by using qualified attribute names (n.a).
• Each block related with a class is identified with a label (l), that can be a row (n), a column (|n), a table (|n) or a cell class label (.n).
Using the ClassSheet model represented in Figure 2.3 it is possible to give a better under-standing of how the formal definition can be used to describe ClassSheets.
Suppose we want to represent the Item class of the spreadsheet. That portion of the spreadsheet is composed by two cells, one with the value Item, used as a header, and the other one with a vertically repeated attribute named value. By labeling that two cell blocks with the value Item and marking it with a vertically repeatable label, that block is to be perceived as a vertically repeatable class, and it is represented by the following syntax:
|Item : Item ˆ |Item : (value=0)↓
Next, the vertically expandable class Income is included. This class has a particularity, when compared to the Item:, the header cell is separated from the two cells in the bottom. To solve this problem, a vertical expandable Income class identifier is included before the two lowermost cells.
|Income : Income ˆ |Item : Item ˆ |Item : (value=0)↓ ˆ |Income : Total ˆ
|Income : total=SUM(Item.value)
The above example is the complete textual representation of the example depicted in Figure 2.3. This syntax will have an important role in ClassSheet model evolution, as it will be based on it that automata will be generated and evolved (see Chapter 3).
The abstract syntax by itself has some limitations, as it does not enforce structural con-straints caused by the two dimensional layout. For instance, it is possible to define the following sheet [Engels and Erwig, 2005].
|Income : Income ˆ |Item : Item ˆ
|Income : (value=0)↓ ˆ |Item : Total ˆ
|Income : total=SUM(Item.value)
This would imply that it would be possible to have an Income class that aggregates a class Item which in turn aggregates the class Income. This is not possible, and as such should not be considered a ClassSheet [Engels and Erwig, 2005].
To enforce a valid ClassSheet spatial structure, called tiling, a type system was formal-ized. With this system it is possible to define the four main tiling structures, i) non-aggregated single classes, ii) one-dimensional horizontally expandable non-aggregated classes, iii) one-dimensional vertically expandable aggregated classes an iv) two-dimensional ag-gregations. Aggregation tiles can also be nested and tiles can be horizontally or vertically composed. Tiling rules are presented in Figure 2.5.
Figure 2.5: ClassSheet tiling rules.
In Figure 2.6 are depicted five examples of correct tiling. From left to right, there a simple sheet, a vertical one-dimensional aggregation, a horizontal aggregation, a vertical aggregation over two vertical aggregations, and a two-dimensional aggregation.
Figure 2.6: ClassSheet tiling structures.
Although ClassSheets are a great enhancement over templates, the process used to create a model, initially, was essentially the same. The ClassSheet model had to be produced using a ClassSheet editor and, after that, another tool had to be used to generate instances that comply with that model.
2.3
Relational ClassSheets to UML+OCL
A transformation method between ClassSheets and UML class diagrams, enriched with Object Constraint Language (OCL) constraints, was presented in [Cunha et al., 2012d]. This allowed the application of model validation techniques, already avaiable for UML, to spreadsheets. The aforementioned was accomplished by extending ClassSheets to support characteristics of relational databases, namely the existence of primary and foreign keys, associated with ClassSheet tables. The proposed extensions are shown in Figure2.7marked in red.
The new ϕµ extension, allows the representation of unique values within a column or row,
Figure 2.7: ClassSheet extensions, from [Cunha et al., 2012d].
has a stronger meaning than in the original ClassSheet syntax and it is to be perceived in the same way as a foreign key in a database model. Each time a declaration n.a is defined, the existence of class n and attribute a is verified, before it is accepted. Also attribute a has to be declared as a primary key, i.e., as unique in class n. These two extensions ensure that the values in cells with both types of keys are always valid.
Mapping ClassSheets intoUML classes withOCL constraints, using the proposed method in [Cunha et al., 2012d], is then a three step process. FirstUMLclasses are generated from ClassSheet classes, subsequently the associations between classes are inferred, and finally
OCL code is generated to ensure that both representations possess the same properties, namely restrictions on primary and foreign keys. These specifications are generated in the notation for UML-based Specification Environment (USE), proposed in [Gogolla et al.], which is a tool with UML execution and OCL support, enabling for instant validation of spreadsheet models.
In Figure 2.9 a ClassSheet model for an airline company is displayed. Such model is composed by three main classes; Pilots, with primary key id, Planes, with primary key n-number, and Flights. The Flights class is in turn composed by three classes; PlanesKey, which references Planes by the n-number attribute, PilotsKey , that references Pilots by the id attribute, and an association class between the PlanesKey and Pilots classes. Extracting theUMLclass diagram using the techniques presented in [Cunha et al., 2012d], results in the diagram of Figure 2.8, as drawn by the USEtool.
The inverse process, which is generating ClassSheet models from UML class diagrams, is straightforward, and allows to broaden the range of possible evolutions. This is crucial in the context of the work carried out in this thesis.
Figure 2.8: Flights UML class diagram, as presented in [Cunha et al., 2012d].
2.4
Embedding of ClassSheet Models Within
Spread-sheets
In [Mendes, 2011] a method to embed ClassSheet model specifications in spreadsheet sys-tems was proposed. Embedded ClassSheets are visually similar to normal ClassSheets, except that classes are represented with solid colors and repetition rows and columns are explicitly represented on the spreadsheet.
Also, new techniques were introduced to evolve ClassSheet models and instances so that they both stay synchronized when changes are applied. This brought two major advantages: (1) allowed the users of the spreadsheet system to work with both, model and instances, without having to learn a different environment, and (2) simplified the architecture of the software system responsible to keep models and instances synchronized.
In Figure 2.9 we can observe how ClassSheet models can be specified in a spreadsheet environment almost in the same way as in ViTSL. In order to create the Pilots class, a user had to group a block of cells and select an option to add a class, naming it Pilots and assign the label values ID, Name and Flight Hours to the respective cells. A second vertically expandable class had to be created and the id, name and flight_hours attributes had to be assigned to the respective cells. The conforming model, where we can see three occurrences of the vertically expandable class data, is shown in Figure 2.10.
Figure 2.9: Embedded ClassSheet representing a system for an airline company as proposed in [Mendes, 2011].
Figure 2.10: Spreadsheet instance for an airline company as proposed in [Mendes, 2011].
2.5
Bidirectional Transformation of Spreadsheets
A co-evolution technique, based on bidirectional transformations, was proposed in the con-text of the SSaaPP1 project to synchronize ClassSheet models and instances [Cunha et al.,
2012a]. In this approach two different sets of operations, one corresponding to editing operations over ClassSheet models, and other corresponding to editing operations over instances, were developed and bound together by means of a symmetrical bidirectional framework. The purpose of this method is to allow evolutions over models to be trans-formed in evolutions over instances of that model and vice-versa. The principle behind it is that every time a model or instance is changed, that change has to be reflected not only on the entity that changed but also on all of the others, in order to restore conformity, as illustrated in Figure 2.11. This bidirectional framework is implemented in MDSheet
[Cunha et al., 2012b]. conforms to conforms to Op Op to from M D ClassSheet Spreadsheet ClassSheet' Spreadsheet'
Figure 2.11: Spreadsheet bidirectional transformation system, as proposed in [Mendes, 2011].
The set of edit operations defined over models, and displayed in Figure2.12, is of paramount importance to the work carried out in this thesis, as the same operations are implemented at automata level so that automatic evolution can be achieved.
Figure 2.12: Operations over ClassSheet models, as proposed in [Cunha et al., 2012a].
Even with all that was presented before, spreadsheet model evolution is still a manual process. Users still have to directly manipulate models or instances so that changes take effect, which still makes it, although to a lesser extent, error-prone. On chapters 3and 4a method to automatically evolve ClassSheet models and co-evolve the respective instances is proposed, building upon what was just presented.
1
2.6
Summary
In this chapter an extended overview about MDSDwas made, to establish the grounds on which this thesis is based.
We started by reviewing templates, this models are a first step up from the low level cell oriented development previously used.
Afterwards ClassSheets were addressed: this method builds upon templates and allows the specification of a spreadsheet business model using OOD constructs, like classes and attributes. The fact that cell references are substituted by attribute names makes them considerably less error-prone than templates.
Finally, the embedding of ClassSheet models in the same environment used to manipulate the instances, and the bidirectional framework used to keep everything synchronized was presented.
Chapter 3
Operations Over ClassSheet
Automata
Methods for model-driven spreadsheet evolution were already proposed [Cunha et al., 2012a], however this evolution had to be done manually, and a human operator had to apply successive transformations to the spreadsheet model until it reached the desired fi-nal state. This can be time consuming and lead to errors. In this chapter we present the first techniques that allow automatically evolving a ClassSheet model to a desired final model while, at the same time, migrating the data that conforms to the initial model so it conforms to the final model. The method proposed in this document to create an auto-matic evolution framework for ClassSheet models is based on automata transformation and equivalence, we chose automata mainly for two reasons. First, it is a formal way of repre-senting information. Second, ClassSheets already provide the necessary tool to transition from model level to automata level evolution. Their formal, textual, description defines a regular language and thus, by formal definition, ClassSheets can be expressed by a finite automaton. One possible representation for the Item class in the ClassSheet presented in Figure2.3 is shown in Figure3.1.
This representation is translated directly from the ClassSheet formal syntax and describes the ClassSheet in the following way: the first transition works as the identification of the vertically expandable class Item, which indicates that the following content belongs to class Item, next is the content of the first cell of the ClassSheet, which holds the value Item, followed by a vertical composition (ˆ). On the second row appears once again the
Figure 3.1: Item class expressed as an automaton.
identification of the class followed by the open parenthesis, which means that all transitions that follow, until the closing parenthesis, are considered repeatable content. In this case the value attribute is vertically repeatable, as can be witnessed by the last transition.
Figure 3.2: Evolution process.
To achieve our goal for automatic evolution, the first step is to establish a conversion method between ClassSheet models and deterministic finite automata, so that evolution can take place at automata level. After that, equivalent operations over ClassSheet mod-els proposed in [Cunha et al., 2012a] have to be defined over automata. Subsequently a technique for model evolution has to be applied so that, given initial and final automata, the initial automaton can be transformed until it is equivalent to the final automaton. In Figure 3.2 one can visualize how the expected evolution process will progress. First, the initial model (CS1) has to be converted to an automaton (A1) using an appropriate
conversion function (f). Transformation operations at automata level (ax) are then
con-tinually applied until the final model is attained (An). The important thing to notice is
that these operations are directly related to operations defined over ClassSheet models (ex) in [Cunha et al., 2012a]. The main objective of this process is to identify the sequence of operations needed to apply to the first automaton, to transform it into the final one. When this sequence of operations is determined, migrating the data that complies with the initial ClassSheet model (CS1) can be done by using bidirectional transformations defined
3.1
ClassSheets as Automata
As already observed, representing ClassSheets as automata can be achieved by converting the formal language syntactic elements to automata transitions; however this process has drawbacks. When representing a ClassSheet model with a horizontal aggregation over a relation, or with two-dimensional aggregations, a difficulty arises that makes it impossible to process a ClassSheet automaton in row-by-row manner. A ClassSheet with a two-dimensional aggregation, and corresponding formal definition, is presented in Figure 3.3
and Figure 3.4, respectively.
Figure 3.3: Two-dimensional example of a ClassSheets, as seen in [Engels and Erwig, 2005].
Figure 3.4: Textual representation of the Budget ClassSheet.
To formally define the budget ClassSheet model in Figure 3.3, one has to describe the model as horizontally composing blocks; these blocks are identified in Figure 3.4. The
first block is composed by columns A and B and belongs to the root class Budget and an aggregation class Category. The middle block is composed by columns C,D and E, and belongs to the column aggregation class Year and Category, which surround the association class .Cpy. The final block is composed by column F and, like the first block, belongs to classes Budget and Category. The problem with this representation is that the first block is defined from top to bottom, and then the middle and third blocks are defined sequentially in the same way. For reasons that will become clear in Chapter 4 a different representation, still based on the ClassSheet formal representation, is required. This representation allows sequentially defining a ClassSheet model, row-by-row, starting on the upper-left corner and ending on the lower-right corner. In this thesis we are considering embedded ClassSheets, and as such, vertical and horizontal expansion symbols are also included on the new representation.The new representation is attained by re-writing the ClassSheet using the transformation function (τ ) presented next.
τ : ClassSheet → T ClassSheet τ f = f τ ϕ = ϕ τ (a = f ) = (a = f ) τ ((l1 : (c1ˆ c2)) | (l2 : (c3ˆ c4) →)) = τ (l1) : τ (c1) | (τ (l2) : τ (c3) | · · · ) → | τ (c2|c4) τ (b1|b2) = τ (b1) | τ (b2) τ (b1ˆ b2) = τ (b1) ˆ τ (b2) τ .n = .n τ n = n τ |n = n τ |n = n τ (l : b) = τ (l) : τ (b) τ (l : b ↓) = τ (l) : (τ (b)ˆ τ (l) : rep( ... , width(b)) ) ↓ τ (l : b1ˆ b2) = (τ (l) : τ (b1))ˆ (τ (l) : τ (b2)) τ (c1ˆ c2) = τ (c1)ˆ τ (c2) τ (c →) = τ (c) → τ (s1| s2) = τ (s1)| τ (s2)
The fifth and the last case look the same but as it happens in the original ClassSheet language the same vertical bar is used to compose blocks and sheets. In the case for l : b ↓
the rep function takes as arguments a symbol and a number of columns, and horizontally composes the symbol in that amount of times.
To better understand how this representation can be used to represent ClassSheet models as automata two simple examples will ensue.
The first example (Figure3.5) is a ClassSheet model with a root class named Pilots with three labels with values, ID, Name and Flight Hours, respectively. This class aggregates a vertically expandable class, here named PilotsA, with three attributes; id, name and flight_hours.
Figure 3.5: Pilots ClassSheet.
This ClassSheet formal representation is shown next.
|Pilots: Pilots | t | t ˆ
|Pilots: ID | Name | Flight Hours ˆ
|PilotsA: ( id=”” | name=”” | flight_hours=0 )↓ ˆ |Pilots: t | t | t
The row-by-row textual specification of this ClassSheet model, after applying the transfor-mation function previously explained, can be realized in the following way.
Pilots: Pilots | t | t ˆ
Pilots: ID | Name | Flight Hours ˆ
PilotsA: ( id=”” | name=”” | flight_hours=0 ˆ PilotsA:... |... |... )↓ ˆ
Pilots: t | t | t
The first row starts with the Pilots class which contains a block composed by three hor-izontally composed (|) cells. The first cell has a label identifying the name of the class, in this case Pilots, followed by two empty cells (t), the row ends with the vertical com-position (ˆ) of rows. The second row has a similar structure: it starts with the Pilots
class and has a vertical composition of three cells with labels, ID, Name and Flight Hours, used to identify attributes of the PilotsA class; like the first one, it ends with a vertical composition. The third row has some differences, compared to the first two; it starts with the aggregated class PilotsA, which contains a vertically repeatable block (()↓), which can be divided into two vertically composed blocks, of these two blocks, only the first one is contained in the third row. This block is a horizontal composition of three cells that hold the id, name and flight_hours attributes of the PilotsA class, the row ends with a vertical composition of blocks (ˆ). The fourth row holds the second block of the previous vertical composition, containing a horizontal composition of three cells, and each one of these cells marks the vertical repeatability of the class (...). The fifth and final row starts with the class Pilots that contains a block consisting of three horizontally composed empty cells. This concludes the row-by-row description of the Pilots ClassSheet.
With the new representation, converting the textual definition to an automaton is a straightforward task; each language symbol can be converted into an automaton tran-sition. To generate the complete automaton for a ClassSheet model, each transition must be sequentially connected to one another in the same order as the symbols appear in the textual definition.
The resulting automaton, attained from converting the Pilots ClassSheet model from textual representation, can be visualized in (Figure 3.6). As does the representation, automata representation also is a row-by-row description of a model, and all the symbols have the same meaning as in the former.
The previous example allows observing how it is possible to attain a ClassSheet automaton from its textual representation but it does not allow to understand how the new representa-tion can be used to specify a horizontally expandable class. To address this, the ClassSheet pictured in Figure3.7 is presented. This ClassSheet is composed by a class named Planes that possesses four labels with contents, Planes, N-Number, Model and Name, respectively, and aggregates a horizontally expandable class named PlanesA that holds three attributes, n-number, model and name.
The formal representation of this ClassSheet model is presented next.
Planes Planes ˆ Planes: N-Number ˆ Planes: Model ˆ
Figure 3.6: Pilots ClassSheet automaton.
Figure 3.7: Planes ClassSheet.
Planes: Name ˆ | (PlanesA: t ˆ PlanesA: n-number=”” ˆ PlanesA: model=”” ˆ PlanesA: name=”” )→ | Planes: t ˆ Planes: t ˆ Planes: t ˆ Planes:t ˆ
To textually specify the Planes ClassSheet, in a row-by-row way, the aggregated class
PlanesA has to be divided in multiple horizontally expandable blocks, with each
sub-block belonging to a single row. Below is the textual definition of the Planes ClassSheet.
Planes: Planes | PlanesA: ( t | · · · )→ | Planes: t ˆ
Planes: N-Number | PlanesA: ( n-number=”” | · · · )→ | Planes: t ˆ Planes: Model | PlanesA: ( model=”” | · · · )→ | Planes: t ˆ
Planes: Name | PlanesA: ( name=”” | · · · )→ | Planes: t ˆ
The first row is defined as a horizontal composition of classes; it initiates with the Planes class, that possesses a cell with a label Planes, this class horizontally composes with the class PlanesA, that holds a horizontally expandable block (()→), this block contains two cells, one empty, and another indicating the expandability of the class (· · · ), the final part of the composition is poised by the class Planes which holds an empty cell. The following rows are described exactly in the same way, the important thing to emphasize is that horizontally expandable classes, in this case PlanesA, are defined as separated horizontally expandable blocks. Like the Pilots ClassSheet, the automaton can be attained by simply converting the formal language symbols into automaton transitions, the result can be visualized in Figure 3.8.
Figure 3.8: Planes ClassSheet automaton.
With the transformation function previously presented is possible to attain an automaton representing a ClassSheet model. The conversion between ClassSheet and
Determinis-tic Finite Automata (DFA) is shown in Algorithm 1. The first step is to transform the ClassSheet textual representation to a row-by-row description. This description is then utilized to generate the vocabulary of the automaton. This is done by collecting all lan-guage symbols in the new textual representation. Next, the transitions table is generated by connecting all language symbols in the same order as they appear in the representation. Using the transitions table it is possible to determine the set of states by obtaining every state in all transitions. The following step is to identify the initial state, this is done by finding the only state not present as destiny on any transition. The set of final states is de-termined by finding all states not present as origin in any transition. Finally an automaton is generated using the parameters previously computed.
Algorithm 1 ClassSheet to DFA Conversion Function
1: function classSheetToDFA(classsheet) 2: transf ormedCS ← τ (classsheet)
3: vocabulary ← getAllSymbols(transf ormedCS) 4: transitionsT able ← generateTT(transf ormedCS)
5: states ← getStates(transitionsT able)
6: initialState ← getInitialState(transitionsT able) 7: f inalStates ← getFinalStates(transitionsT able)
8: return genDFA(vocabulary, states, initialState, f inalStates, transitionsT able)
9: end function
3.2
Basic Operations over Automata
Before model operations are defined over ClassSheet automata, five basic operations are necessary. These operations are used in conjunction to produce higher level, ClassSheet model operations. The description of the five basic operations follows. To aid in the description of the operations we will use as an example the automaton in Figure3.9.
3.2.1
Add Transition
The first operation we introduce adds a transition to an automaton, given the state where the transition begins, the state where the transition ends, and the symbol that allows the transition between states to take place. The result of adding a transition between states 2 and 3, by the symbol e, to the automaton pictured in Figure3.9is presented in Figure3.10.
Figure 3.9: Generic automaton.
Figure 3.10: Generic automaton with a new transition.
3.2.2
Delete Transition
This operation deletes a transition from an automaton, given the state where the transition begins, the state where the transition ends and the symbol of the transition. The result of deleting the transition between states 2 and 3 by the symbol e, from the automaton in Figure3.10 results in the automaton pictured in Figure 3.9.
3.2.3
Edit Transition
This operation allows to modify the states and symbol components of a transition. Given a transition to be modified and the new values of the three components, it updates the transition so it reflects the new values. The result of altering the transition between states 2 and 3, by the symbol e, in the automaton in Figure 3.10 to connect states 3 and 1, by symbol f, is presented in Figure 3.11.
Figure 3.11: Generic automaton with an edited transitions.
3.2.4
Add State
Given a new state, this operation adds it without any transitions to an automaton. Adding a state to the automaton in Figure 3.9 results in the automaton in Figure 3.12.
Figure 3.12: Generic automaton with a new state.
3.2.5
Remove State
The last operation removes a state from an automaton, and all transitions associated with that state using the remove transition operation previously defined. The result of removing state 2 from the automaton in Figure 3.9 results in the automaton in Figure 3.13.
3.3
ClassSheet Automata Operations
In this section, equivalent operations over ClassSheet models proposed in [Cunha et al., 2012a] are presented over ClassSheet models expressed as automata. These are established on top of the basic operations previously defined. The process of applying a ClassSheet model operation over an automaton is depicted in Figure 3.14. A ClassSheet automata operation (a), that transforms an automaton (A1) in an automaton (An), is a sequence
of basic operations (bx) that are consecutively applied as a single, atomic, operation. On the other hand, an automata operation (a) conforms to ClassSheet operation (e) and, as such, the outcome of applying operation (a) to automaton (A1) yields the same result as
applying operation e to the ClassSheet (CS1), and converting the result to automaton,
both resulting in automaton (An).
Figure 3.14: ClassSheet atomic operations as a sequence of basic operations.
Atomic operations over ClassSheet automata share a same basic strategy, each transition is traversed, while at the same time a coordinate count is kept. Each automaton starts at a given initial position. Every time a horizontal composition transition (|) is reached the x coordinate is incremented, likewise the y coordinate is incremented when a vertical composition transition (ˆ) occurs.
In Figure3.16 the automaton that represents the Item ClassSheet model in Figure3.15 is displayed, and above each state a coordinate count is shown. Starting in position (1,1) the ClassSheet automaton has a transition identifying an Item class followed by a cell with value Item located at the same coordinates. A transition indicating a vertical composition
(ˆ) is next, so the y coordinate has to be incremented, resulting in coordinates (1,2). On the subsequent rows the same process is repeated, the coordinates are unchanged until the vertical composition transition is reached, and at that point the y coordinate is incremented again. This simple example has only one column, but in case it had more than one, each time a horizontal transition was reached (|), the x coordinate had to be incremented instead.
Figure 3.15: Embedded Item ClassSheet.
Figure 3.16: Embedded Item ClassSheet automaton.
An atomic operation is accomplished by traversing and applying basic operations to au-tomata, based on the transition type and coordinate count. A description of each atomic operation follows.
3.3.1
Add Column
The first operation adds to an automaton the states and transitions corresponding to adding a column in a ClassSheet model. This is the automata equivalent to the following operation from [Cunha et al., 2012a].
addColumnM :: W here → Index → OpM
This operation takes as parameters the position where to insert the new column, if it should be inserted before or after that column. When defining this operation over automata, depending on the position where the new column is to be added, two different situations can occur.
The first case is the case where the new column is to be inserted before the index column (c). To do this the automaton has to be traversed, and in each occurrence of a transition of type cell that has coordinate x = c, the following sequence of basic operations has to be applied:
1. Add a new state (st1). 2. Add a new state (st2).
3. Edit the transition that precedes the cell transition in column (c) so that it transitions to st1.
4. Add a transition representing an empty cell connecting st1 to st2.
5. Add a transition connecting st2 to the cell transition in column (c), denoting a horizontal composition (|).
An example ensues to better understand how this operation is completed.
Suppose one wants to add a column before column 1 to the automaton in Figure 3.16. To do this, all the steps previously mentioned have to be taken each time a transition of type cell is located at coordinates with x = 1. The first transition that meets this criterion is the one that transitions from state 2 to state 3 by the symbol Item. Figure 3.17illustrates the result of applying the basic operations to the automaton. First of all, states 15 and 16 are added, then the transition that connected states 1 and 2 by the symbol Item:, is edited so that it connects states 1 and 15, afterwards, a transition denoting an empty cell is added between states 15 and 16, and finally a transition designating a horizontal composition is added between states 16 and 2. To help visualize he result, the edited transition is shown in blue color, while states and transitions that were added appear colored in red1.
Figure 3.17: Add individual cell before column x.
Since the automaton represents a single-column ClassSheet these transformations have to be applied to every cell transition in the automaton. The final result can be seen in Figure3.18. One important matter to mention is that cells in row 3 have a special meaning and are used to mark the vertical expandability of the class, so instead of adding an empty cell, a cell of the same type must be added.
Figure 3.18: Add column before 1, operation.
A different situation occurs when a column is added after the reference column (c). In this case, each time a cell transition has coordinate x = c, the following sequence of basic operations is applied to the automaton:
1. Add a new state (st1). 2. Add a new state (st2).
3. Edit the transition that succeeds the cell transition at column c so that it succeeds st2 instead.
4. Add a new transition denoting a horizontal composition after the cell transition at column c and connect it to st1.
5. Add a new transition, representing an empty cell, connecting st1 to st2.
Adding a column after column 1 to the automata in Figure 3.16 shares the same principle as the previous case. On all transitions that represent cells and are located at coordinates with an x = 1 the sequence of basic operations is applied to the automaton. Once again, the first transition to meet this criterion is the transition from state 2 to 3, and at this stage states 15 and 16 are added. The transition that originates in state 3 is edited so it originates in state 16 instead, following, a transition denoting a horizontal composition is added between states 3 and 15, and finally a transition between states 15 and 16 is added representing an empty cell. The result can be seen in Figure3.19, where the edited transition is blue colored and added states and transitions are red colored.
Figure 3.19: Add individual cell after x, operation.
This sequence of operations is applied on every occurrence of a cell transition resulting in the automaton displayed in Figure 3.20.
3.3.2
Delete Column
The next operation deletes the states and transitions corresponding to deleting a column from a ClassSheet model, and is the automata equivalent to the following operation from [Cunha et al., 2012a].
delColumnM :: Index → OpM
This operation deletes the column located at the given index position (c). To do this, the automaton is traversed and at each occurrence of a cell transition located at coordinates with x = c, the following basic operations are applied.
Figure 3.20: Add column after 1, operation.
1. The transition that succeeds the cell transition and respective horizontal composition transition is edited so that it originates on the transition that precedes both of them.
2. The state to where the automaton transitions by the cell symbol is deleted.
3. The state to where the automaton transitions by the horizontal composition symbol is deleted.
In the next example the operation to delete column 2 is applied to the automaton in Figure 3.20. This atomic operation consists in traversing the automata and applying the sequence of basic operations previously mentioned each time a cell transition is located at coordinates with x = 2. The first occurrence of such a case is at the transition that originates from state 15, and the result of applying the sequence of basic operations can be visualized in Figure 3.21. The first basic operation to apply is editing the transition that originates in state 16 so that it originates from state 3, followed by the deleting of the states 16 and 15, which are the states to where the automaton transitions by the cell symbol, and the horizontal composition symbol, respectively. The edited transition is colored in blue and the removed states and transitions are marked in gray.
The result of employing this process in all subsequent cell transitions located at column 2 is the transformation of the automaton in Figure 3.20 into the automaton in Figure 3.16.
Figure 3.21: Cell removed from Item ClassSheet.
3.3.3
Add Row
The next operation adds the states and transitions corresponding to adding a row in a ClassSheet model. This is the automata equivalent to the following operation from [Cunha et al., 2012a].
addRowM :: W here → Index → OpM
This operation takes as input the position, before or after, and an index where the new row is to be added. The row located at the given index is used to ascertain the structure of the new row, that is, the sequence of classes and columns it possesses. As with the add column operation, when defining this operation over automata, depending on the position where the new row is to be added, two different cases can occur.
The first case arises when the new row is to be added before the index row (r). Generically, this transformation is carried out in the following steps.
1. The automaton is traversed until the first transition (t) with y = r.
2. The structure from the reference row is determined, and added to the automaton. 3. A vertical composition transition is added between the end of the row structure added
in step 2 and the transition t.
4. The transition that precedes t is edited so it transitions to the beginning of the row structure added in step2.
As an example, suppose one wants to add a row before row 3 in the automaton in Fig-ure 3.16. The first step is to identify the first transition with coordinate y = 3, which is the transition that originates in state 8 and transitions to state 9 by the symbol ItemA:.
![Figure 1.1: Month-by-month wage account for the Sumerian temple of Enlil at Nippur, for the year 1295 BC [Robson, 2007].](https://thumb-eu.123doks.com/thumbv2/123dok_br/17763006.835904/19.892.325.582.645.953/figure-month-account-sumerian-temple-enlil-nippur-robson.webp)

![Figure 2.8: Flights UML class diagram, as presented in [Cunha et al., 2012d].](https://thumb-eu.123doks.com/thumbv2/123dok_br/17763006.835904/36.892.225.678.155.397/figure-flights-uml-class-diagram-presented-cunha-et.webp)
![Figure 2.9: Embedded ClassSheet representing a system for an airline company as proposed in [Mendes, 2011].](https://thumb-eu.123doks.com/thumbv2/123dok_br/17763006.835904/37.892.200.707.156.431/figure-embedded-classsheet-representing-airline-company-proposed-mendes.webp)