Engineering
ISSN: 1809-4430 (on-line)
_________________________
1 Engº Agrônomo Dr., Departamento de Engenharia Rural, FCAV, UNESP/Jaboticabal – SP, Fone: (16) 99289-1441
QUALITY OF PEANUT MECHANICAL SOWING IN FUNCTION OF SEEDING DENSITY AND SIZE OF THE SEEDS
Doi:http://dx.doi.org/10.1590/1809-4430-Eng.Agric.v35n4p 711-720/2015
CRISTIANO ZERBATO1, CARLOS E. A. FURLANI2, RODRIGO F. DE ALMEIDA3,
MURILO A. VOLTARELLI4, VICENTE F. A. SILVA5
ABSTRACT: Peanut crop (Arachis hypogaea L.) mechanization has been improved over the years;
however there are drawbacks that affect the quality of operations. Thus, this article’s objectives
were to evaluate the operational performance of the mechanized sowing of peanut crop according to
seeding densities (10, 14, and 18 seeds m-1) and seed sizes (21 and 23 mm). It was observed that
the seeds of 23 mm had shorter average number of days to emergence and a higher percentage of
emergences, occurring the opposite to the seeding density of 18 seeds m-1. The higher the seeding
density, the largest was the plant stand, whereas the 23 mm seed obtained the best results and the
same with the seeding density of 14 seeds m-1 that had a higher percentage of normal spacing. The
densities of 14 and 18 seeds m-1 reflected in higher yields, being always superior to the 23 mm
seeds.
KEYWORDS: Arachis hypogaea L., agricultural mechanization, seeder-fertilizer.
QUALIDADE DA SEMEADURA MECANIZADA DE AMENDOIM EM FUNÇÃO DE DENSIDADES DE SEMEADURA E TAMANHO DAS SEMENTES
RESUMO: A mecanização da cultura do amendoim (Arachis hypogaea L.) vem evoluindo ao
longo dos anos, todavia ainda existem empecilhos que afetam a qualidade das operações mecanizadas. Dessa forma, objetivou-se, no presente trabalho, avaliar o desempenho da semeadura
mecanizada de amendoim em função de densidades de semeadura (10; 14 e 18 sementes m-1) e
tamanhos de sementes (21 e 23 mm). Observou-se que, para as sementes de 23 mm, o número médio de dias para emergência foi menor, e a porcentagem de emergência superior, ocorrendo o
contrário para a densidade de semeadura de 18 sementes m-1. Quanto maior a densidade de
semeadura, maior foi a população de plantas, sendo que a semente de 23 mm obteve os melhores
resultados, em que a mesma, na densidade de semeadura de 14 sementes m-1, apresentou alta
porcentagem de espaçamentos normais. As densidades de 14 e 18 sementes m-1 refletiram em
maiores produtividades, sendo sempre superior para as sementes de 23 mm.
PALAVRAS-CHAVE:Arachis hypogaea L., mecanização agrícola, semeadora-adubadora.
INTRODUCTION
of priorities of research. However, the peanut crop passes for a transitional period, a form of manual cultivation (sowing, uprooting and harvesting) to a mechanized system of farming.
The performance of the mechanized set must be improved to obtain the best results as (TOLEDO et al., 2009). So the mechanization in peanut sowing made possible its realization in large areas with the use of seeders, mostly coupled and tractioned.
Studies indicate the uniform longitudinal distribution of seed as one of the features which contribute most to a suitable population of plants and thus for the improvement of crop productivity. That is, no uniformity in the longitudinal distribution of plants implies an inefficient use of available resources such as light, water and nutrients, thereby negatively affecting productivity (JASPER et al., 2011).
Among the mechanized operations, quality of seeding in a culture is important to ensure adequate population of plants, and consequently, the success of implantation of the culture and adequate productivity. In Brazil, there is not a consent between the producers of which seeding
density to use, most of them sow lots of seeds (25 seeds m-1), mainly related to seed physiological
quality. The amount of seed depends on the size of the seed, germination percentage, spacing and seeding density used.
In addition to the seeding density, the seed size is an extremely important factor in order to obtain success in the implementation of the peanut crop. The classification by size of peanut seeds after the cleaning process has been adopted by a number of producers in the region of Jaboticabal, SP. Although there is still no definitive proof of the research advantages of this practice, there are reports that larger seeds have higher reserves for adverse occasions and that the uniformity of size is critical to distributing them by the dispensing discs.
In several species, mechanical grading of seed lots by size can affect the initial plant vigor and agronomic components production. The variation in seed size may occur in seed lots of the same cultivar, which is related to the size of cotyledon cells rather than its number (HIRSHFIELD et al., 1993).
Given the above, and given the lack of regional research about it, the aim of this study was to evaluate the quality of mechanized peanut sowing operation in function of seeding rates and seed size.
MATERIAL AND METHODS
1. Experime ntal characterization and experimental design
The experiment was conducted in the experimental area at the Farm of Education, Research and Production of UNESP / Jaboticabal, SP, close to geodetic coordinates 21º14' South latitude and 48º17' West longitude with an average altitude and slope of 560 m and 4%, respectively. The soil
of the experimental area was classified as Oxisol, clayey and gentlyundulating relief, according to
ANDRIOLI & CENTURION (1999). The granulometric soil analysis on the layer from 0 to 0.20 m was held at the Soils Laboratory of the FCAV / UNESP - Jaboticabal, SP, presenting clay content of
469 g kg-1, silt of 307 g kg-1 and sand of 224 g kg-1.
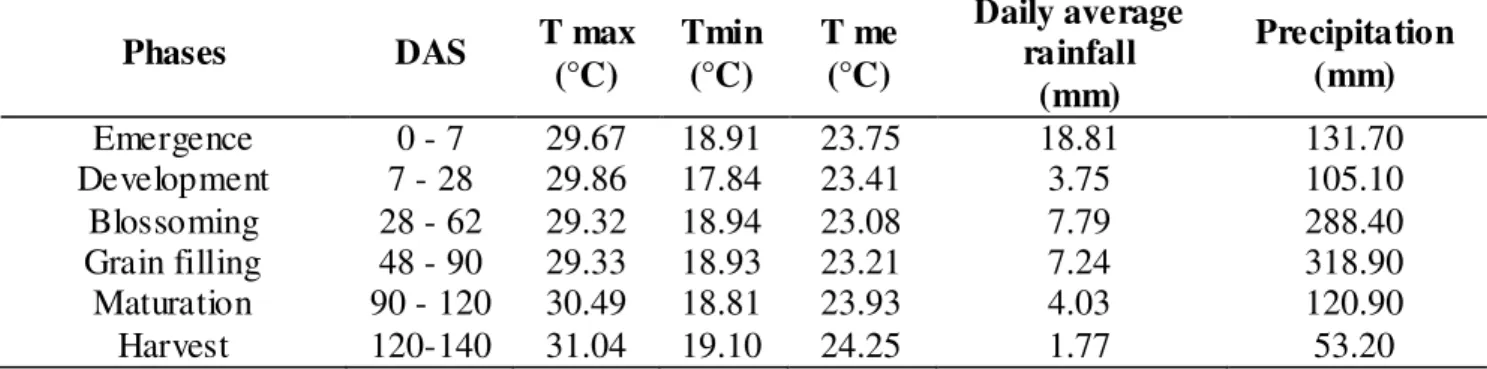
TABLE 1. Maximum (T max), minimum (T min) and mean (T me) temperatures, daily average and cumulative rainfall for the period of development of the peanut crop in function of days after sowing (DAS).
Phases DAS T max
(°C)
Tmin (°C)
T me (°C)
Daily average rainfall
(mm)
Precipitation (mm)
Emergence 0 - 7 29.67 18.91 23.75 18.81 131.70
Development 7 - 28 29.86 17.84 23.41 3.75 105.10
Blossoming 28 - 62 29.32 18.94 23.08 7.79 288.40
Grain filling 48 - 90 29.33 18.93 23.21 7.24 318.90
Maturation 90 - 120 30.49 18.81 23.93 4.03 120.90
Harvest 120-140 31.04 19.10 24.25 1.77 53.20
The sowing of Arachis hypogaea L., IAC Runner 886 was carried out after conventional
tillage, which was a sub soiling of 0.4 m depth (compacted layer function to 0.35 m deep), followed by primary tillage with disc harrows of 0.2 m deep and finally with two disking graders. The seeds
were treated with the active ingredient Thiamethoxam at a dose of 100 g 100 kg-1 and showed
germination percentages in laboratory of 85%, determined at the Seed Analysis Laboratory of
FCAV / UNESP - Jaboticabal, SP. Sowing was carried in soil water content of 0.23 kg kg-1 (0 to 0,2
m deep).
An experimental randomized block design was adopted, factorial 3 x 2 with 8 repetitions,
totaling 48 plots with treatments consisted of three plant populations (10, 14 and 18 seeds m-1)
combined two seed sizes (sieve 21 and 23 mm). Each plot occupied an area of 240 m2 with 20 m
length by 12 m wide, and three pass of the tractor-seeder set, being evaluated the central pass (4 rows). Among the plots were left in the longitudinal direction, 15 m, for the maneuvers and stabilization of the displacement speed of the mechanized set.
The Valtra tractor BM 125i 4x2 TDA (91.9 kW - 125 cv) used for mechanized sowing
worked an average speed of 1.6 m s-1 (5.7 km h-1). The precision seeder-fertilizer (pneumatic) used
was Marchesan COP Supreme 7/4, equipped for conventional sowing, with doser disk with 48 holes with 0.055 m in diameter each, double discs mismatched for seeds deposition and for opening the
fertilizer deposition groove (350 kg ha-1 of fertilizer with formulation of 02-20-20) and double
compactor wheels in "V", operating with four planting rows spaced of 0.90 m, with working width of 3.6 m and sowing depth of 0.05 m.
2. Sowing Evaluation parameters
The variables analyzed were: average number of days for seedling emergence, plant population, and emergence percentage, longitudinal distribution of seedling, productivity, and the bulk of 100 grains.
The evaluation of the average number of days for emergence of peanut seedlings was performed by daily counts from the first emerged seedlings to the stabilization of the counting (EDMOND & DRAPALA, 1958), in two meters on each row in the plot. It was considered as the initial population the number of the resulting seedlings at the last day of the assessment of the average number of days for emergence, after the stabilization of the emergence seedling, being the values converted into plants per hectare. The percentage of emergence was obtained by the relationship between initial and theoretical population for each treatment, being the latter calculated
taking into account the seeding density used in the treatments (10, 14 and 18 seeds m-1) and line
spacing between seedlings measured with a graduated ruler. The spacing between seedlings (Xi) were analyzed according to ISO 7256/1 (1984), determining the percentage of spacing corresponding to classes: Normal (0.5 m Xref <Xi <1.5 m. Xref), multiple (Xi <0.5 m. Xref) and fail (Xi.> 1.5 m. Xref), based on reference spacing (Xref) according to the regulation of the seeder,
being the Xref: 0.10 ; 0.71, and 0.55 m for sowing densities of 10, 14 and 18 seeds m-1,
respectively.
The actual yield was determined according to SILVA & MAHL (2008) by pull-off of all
peanut plants contained in the frame area of 2.00 m2 then collecting the pod that were over and
under the ground, to the approximate 0.15 meters depth, placing them after sieving in paper bags for subsequent weighing to obtain productivity. The water content of all samples was adjusted to 8%
(peanut storage water content), and then these values were converted to kg ha-1.
The bulk of 100 grains was determined separating the grains from the pods of each plot, which bulks were determined on an electronic scale with a resolution of 0.01 g, and such procedures made under obligations imposed by the Seed Analysis Rules (BRAZIL, 2009).
3. Statistics used
The results were statistically analyzed with the help of Minitab® 16 program, through
exploratory analysis (descriptive statistics) to verify the normality of the data, or the need for transformation to its standardization and variability and the occurrence of disparate data using the
box diagrams (boxplot). The investigation of data normality was conducted by the
Anderson-Darling test, and when asymmetric were transformed to achieve normality, using the formula: y’ =
1/√y.
The box diagram allows assessing the symmetry and the dispersion of the results, and the existence of outliers among them, and is especially suitable for comparing two or more sets of data corresponding to the categories of a variable (BONILLA, 1995).
We carried out the analysis of variance (ANOVA), applying the Snedecor F test at 5% significance level to verify the existence or not of significant differences between the means of the variables analyzed. When appropriate, it was applied the Tukey mean test at 5% probability.
RESULTS AND DISCUSSION
The descriptive analysis of both the average number of days to emergence (NDE) and for emergency percentage presented normal distribution by the Anderson-Darling test (Figure 1), however, the plant population showed asymmetry of the data set, verified by the curve flattening in relation to the normal, with a coefficient of negative kurtosis, being considered platykurtic distribution caused by the variability of the data verified by high coefficient of variation.
S1* S2 S1 S2
P3 P2 P1 P3 P2 P1 13,8 13,7 13,6 13,5 13,4 13,3 13,2 13,1 13,0 12,9 N D
E 13,08 Aa
P3 P2 P1 P3 P2 P1 90
85
80
75
70
65
E
m
e
rg
e
n
c
e
(
%
)
82,08 Aa*** 86,97 Aa
73,15 Ab
72,92 Ba
77,09 Ba
68,00 Bb
Variable Median Ck Cs CV (%) AD
NDE 0.224 13.36 -0.65 -0.17 1.68 0.211N
Population 25197 128224 -1.35 -0.45 21.30 1.209A
Emergence 7.230 75.00 -1.22 0.29 9.43 0.667N
* Treatments: S1 (23 mm) and S2 (21mm): Seed size; P1 (10), P2 (14), P3 (18): seeding densities (m-1 seed).
**– Standard deviation; Ck - kurtosis coefficient; Cs - asymmetry coefficient; CV - Coefficient of variation; AD - Anderson-Darling normality test (N: normal distribution; A: Asymmetrical distribution);● – Arithmetic mean.
*** Different capital letters differ by Tukey test at 5% probability for the treatment seed size and lowercase for sowing density. The
interaction was not significant.
FIGURE1. Descriptive statistics and Tukey test at 5% for the average number of days to emergence (NDE), plant population, and percentage of seed germination in the field of peanut sowing operation.
It was observed that there were differences for the variables analyzed, and for NDE the
smallest seed (sieve 21), and the highest seeding density (18 seeds m-1) showed higher number of
days for emergence. Regarding the size of the seed, the smallest has lower reserves, and smaller cotyledon cells (less vigor), and so the germination and emergence occur slowly, besides having presented lower germination rate in the laboratory (80%) compared to the biggest seed (85%). The higher emergency speed from the vigorous seeds (bigger size) can provide to the canopy of the plants advantages in the use of water, light, and nutrients. Seedlings from high vigor seeds emerge quickly and start the photosynthetic process earlier, favoring the growth of shoot and root system, so it is expected to be more productive (PANOZZO et al., 2009).
It is important to note that treatment with 21mm seed, showed a higher value of a verage number of days for seedling emergence compared to the treatment with 23 mm seeds, showed less variability of the data represented by the boxes with smaller interquartile amplitude on the box-plot graph for all examined plant densities.
The higher the seeding density the bigger is the population, but it is observed that despite
having differences , the seeding density of 14 seeds m-1 showed the amount of plants per hectare
nearest of 18 seeds m-1 of seeding density compared to 10 seeds m-1, this can be proven by the
greater emergence in the two smaller populations.
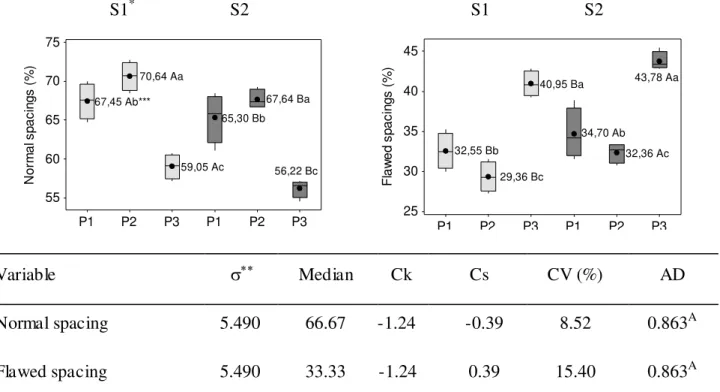
The normal and flawed spacing showed an asymmetric distribution of the data given by the Anderson-Darling test (Figure 2), both of which showed negative coefficient of kurtosis, i.e. platykurtic distribution with flatter curve than normal. The normal spacing presents negative asymmetry coefficient with a slight elongation on the curve further to the left and low coefficient of variation as PIMENTEL-GOMES & GARCIA (2002). The flawed spacing showed positive asymmetry coefficient with a slight curve stretching over the right and average coefficient of variation.
S1* S2 S1 S2
P3 P2 P1 P3 P2 P1 75 70 65 60 55 N o rm a l s p a c in g s ( % ) 67,45 Ab*** 70,64 Aa 59,05 Ac 65,30 Bb 67,64 Ba 56,22 Bc P3 P2 P1 P3 P2 P1 45 40 35 30 25 F la w e d s p a c in g s ( % ) 32,55 Bb 29,36 Bc 40,95 Ba 34,70 Ab 32,36 Ac 43,78 Aa
Variable Median Ck Cs CV (%) AD
Normal spacing 5.490 66.67 -1.24 -0.39 8.52 0.863A
Flawed spacing 5.490 33.33 -1.24 0.39 15.40 0.863A
* Treatments: S1 (23 mm) and S2 (21mm): Seed size; P1 (10), P2 (14), P3 (18): sowing densities (m-1 seed).
**– Standard deviation; Ck - kurtosis coefficient; Cs - Asymmetry coefficient; CV - Coefficient of variation; AD - Anderson-Darling normality test (N: normal distribution; A: Asymmetrical distribution);● – Arithmetic mean.
*** Different lowercase letters differ, by Tukey test at 5% probability for the treatment sowing density, and capital for seed size. The
interaction was not significant.
FIGURE 2. Descriptive statistics and Tukey test at 5% for normal and flawed spacing in the sowing peanut operation.
It was found that in all sowing densities, the 23 mm seed showed better results due to higher percentage of emergence, giving it greater homogeneity of the spatial arrangement, and therefore smaller percentage of flawed spacing. In any of the treatments were not observed the occurrence of double spacing for any of the evaluated treatments.
For the two seed sizes, the density of 18 seeds m-1 exhibited a higher percentage of flawed
spacing, wherein the density of 14 seeds m-1 obtained better results of regular spacing, showing the
improved efficacy of the seeder in this treatment. The flaws in sowing density of 10 seeds m-1 were
intermediate to the other two. At the higher density of sowing the seed doser disk rotates faster, making seeds suction difficult in the feeder disk holes. It is emphasized that due to the size of peanut seed was used the maximum setting suction pressure in the system (9000 Pa), what may have happened is that the suction system failed because of the disk spin speed, trepidation of the seeder, besides the own double removal system, which depending on the position that two seeds held in one hole, it can be ejected together, causing the possible flaws.
In a study conducted by DIAS et al. (2009) there was a decrease in the percentage of normal corn and soybean spacing with increasing sowing density. These results show that reducing the spacing between seeds, caused by increased density, leads to loss in quality of the metering
The distribution curve was normal for the variables grain yield and bulk of 100 grains (Figure 3).
S1* S2 S1 S2
P3 P2 P1 P3 P2 P1 4000 3500 3000 2500 2000 1500 Y ie ld ( k g h a -¹ ) 2396,44 Ab*** 2994,23 Aab 3168,19 Aa 1823,29 Bb 2079,79 Bab 2120,31 Ba P3 P2 P1 P3 P2 P1 65 60 55 50 45 40 35 B u lk o f 1 0 0 g ra in s ( g ) 47,01 46,53
50,91 51,08 50,43
49,73
Variable Median Ck Cs CV (%) AD
Grain yield 594 2334 0.19 0.83 24.46 0.542N
Bulk of 100 grains 8.18 47.88 1.95 0.96 16.88 0.601N
* Treatments: S1 (23 mm) and S2 (21mm): Seed size; P1 (10), P2 (14), P3 (18): sowing densities (m-1 seed).
**– Standard deviation; Ck - kurtosis coefficient; Cs - Asymmetry coefficient; CV - Coefficient of variation; AD - Anderson-Darling normality test (N: normal distribution; A: Asymmetrical distribution);● – Arithmetic mean.
*** Absence of letters indicates non-significant difference between the treatments. Different lowercase letters differ, by Tukey test at
5% probability for the treatment sowing density, and capital letter for seed size. The interaction was not significant.
FIGURE 3. Descriptive statistics and Tukey test at 5% for yield and Bulk of 100 grains in peanut sowing operation.
For variable productivity, treatments with 23 mm seeds had higher values. It is observed that
the sowing density of 10 seeds m-1 led to lower productivity and sowing densities of 14 and 18
seeds m-1 did not differ among them showing higher values. This may be due to lower sowing
density population have insufficient plants to achieve high yields. In the density of 18 seeds m-1,
plant population is increased and may therefore have occurred competition for space, water and soil
nutrients. Thus, the sowing density of 14 seeds m-1 with population of intermediate plants, there
was offsetting effect of yield per plant, reaching the final amount of productivity equal to the
sowing density of 18 seeds m-1.
Treatment with seeding density of 14 seeds m-1 showed high percentage of emergence field
and greater amount of normal spacing between plants which resulted in better development of the culture on the field. This indicates that it is not recommended to sow high amount of seeds per meter, since a lower density achieved the objectives expected for most of the seeding quality variables, resulting in lower expenses with seeds for the implementation of the culture.
The final population of peanut plants is one factor among many production characteristics that can influence the productivity (BROWN et al., 2005). BALKCOM et al. (2010) found that sowing
density of at least 13 seeds m-1 is recommended to reduce yield losses associated with populations
It is observed that the climate in this agricultural year was atypical (Table 1), with reasonable average temperature for the peanut crop. The peanut grows well in environments with average daily temperatures between 22 °C and 28 °C, but if during the growth phase the prevailing average temperature is below 18 °C or above 33 °C, the production can be significantly reduced
(CRAUFURDet al., 2002). But low rainfall and poorly distributed rains throughout the crop cycle,
verified by the low average daily precipitation for plant development period may have affected mainly the stages of development and flowering and consequently the final means of productivity, however, even so being within the national average. According to SILVA & RAO (2005), generally water deficits during the growing season cause delays flowering and increase the peanut crop cycle, delaying harvest and reducing productivity.
BELLETTINI & ENDO (2001) reported that the density of 15 seeds m-1 showed higher
productivity in relation to densities of 10, 20 and 25 seeds m-1, working in the north of the State of
Paraná, with IAC Tatu Vermelho. The joint analysis of the pods productivity data from three experiments, NAKAGAWA et al. (2000) found that there was an increase in productivity with
increases in plant density, however with 14 plants m-1, showed a statistically similar amount to 26
plants m-1.
Regarding the bulk of 100 grains, there was no difference between treatments. The possible reason is that the size and weight of grains produced by the peanut plants are genetic characteristics of the cultivar, so no matter the spacing between plants or seed size used in the deployment of culture, because the characteristics of the produced grain will always be similar.
In that sense, OLIVEIRA et al. (2010), working with the Runner IAC 886 cultivar, did not observed significant variations in the grain size among cultivars of peanuts and between the spacing used, noting an overall average weight of 100 seeds of 41.17g. For domestic consumption this size is well accepted since a number of used commercial cultivars have a weight of 100 grains similar to those obtained (GODOY et al., 2005). CRUSCIOL & SORATTO (2007) found bulk of 100 grains
of 35.3 g, with IAC Tatu Vermelho cultivar, spaced 0.45 m between row and 18 seeds m-1 line.
NAKAGAWA et al. (1994) using the same cultivar, found no difference in bulk of 100 grains
between different sowing densities from 07 to 28 seeds m-1, varying among three of them.
These results indicate that the search of new cultivation alternatives with the use of new spatial arrangement is necessary, since it may not be economically feasible to peanut producer
conventionally sow with high sowing densities, since with lower densities achieve similar
performance, obtaining seeds with lower costs.
CONCLUSIONS
For sieve seeds 23 mm the average number of days to seedling emergence was lower and the
emergence percentage was higher, the opposite occurred for sowing density of 18 seeds m-1. The
23 mm sieve seed at sowing density of 14 seeds m-1 showed higher percentage of normal spacing
and smaller flawed. Density of 14 and 18 seeds m-1 reflected higher yields and is always superior to
the 23 mm seed.
Sieve seeds 23mm showed better results in relation to the average number of days to seedling emergence, initial plant population, emergence percentage, normal spacing, and productivity.
For average number of days to seedling emergence, emergency percentage, normal spacing,
and productivity, sowing density of 14 seeds m-1 had the best performance regarding the quality of
REFERENCES
ANDRIOLI, I.; CENTURION, J. F. Levantamento detalhado dos solos da Faculdade de Ciências Agrárias e Veterinárias de Jaboticabal. In: CONGRESSO BRASILEIRO DE CIÊNCIA DO SOLO,
27., 1999, Brasília. Anais... Brasília: Sociedade Brasileira de Ciência do Solo, 1999. p.1-4.
BALKCOM, K. S.; ARRIAGA, F. J.; BALKCOM, K. B.; BOYKIN, D. L. Single- and twin-row
peanut production within narrow and wide strip tillage systems. Agronomy Journal, Madison,
v.102, n. 2, p. 507-512, 2010.
BELLETTINI, N. M. T.; ENDO, R. M. Comportamento do amendoim “das águas”, Arachis
hypogaea L., sob diferentes espaçamentos e densidades de semeadura. Acta Scientiarum.
Agronomy, Maringá, v. 23, n. 5, p.1249-1256, 2001.
BONILLA, J. A. Métodos quantitativos para qualidade total na agricultura. 2. ed. Contagem:
Líttera Maciel, 1995. 250 p.
BRASIL. Ministério da Agricultura, Pecuária e Abastecimento. Secretaria de Defesa Agropecuária.
Regras para análise de Sementes. Brasília, 2009. 395p.
BROWN, S. L.; CULBREATH A. K.; TODD, J. W.; GORBET, D. W.; BALDWIN, J. A.;
BEASLEY, J. P. Development of a method of risk assessment to facilitate integrated management
of spotted wilt of peanut. Plant Disease,Saint Paul, v. 89, p. 348–356, 2005.
CRAUFURD P. Q.; PRASAD P. V. V.; SUMMERFIELD R. J. Dry matter production and rate of
change of harvest index at high temperature in peanut. Crop Science, Surrey, v. 42, n. 1, p.146-151,
2002.
CRUSCIOL, C. A. C.; SORATTO, R. P. Nutrição e produtividade do amendoim em sucessão ao
cultivo de plantas de cobertura no sistema plantio direto. Pesquisa Agropecuária Brasileira,
Brasília, v.42, n.11, p.1553-1560, 2007.
DIAS, V. O.; ALONÇO, A. S.; BAUMHARDT, U. B.; BONOTTO, G. J. Distribuição de sementes
de milho e soja em função da velocidade e densidade de semeadura. Ciência Rural, Santa Maria,
v. 39, n. 6, p.1721-1728, 2009.
EDMOND, J. B.; DRAPALA, W. L. The effects of temperature, sand and soil acetone on
germination of okra seed. Proceedings of Ame rican Society Horticulture Science, Geneva, v. 71,
p. 428-434, 1958.
GODOY, I. J.; MINOTTI, D.; RESENDE, P. L. Produção de amendoim de qualidade. Viçosa:
CPT, 2005. 168 p.
HIRSHFIELD, K. M.; FLANNERY, R. L.; DAIE, J. Cotyledon cell number and cell size in relation
to seed size and yield of soybean. Plant Physiology and Biochemistry, Paris, v. 30, n. 3, p. 395-
-400, 1993.
ISO - INTERNATIONAL ORGANIZATION FOR STANDARDIZATION. ISO 7256/1: Sowing
equipament Methods of test – Part 1: Single seed drills (Precision drills). Vernier, 1984. 16p.
JASPER, R.; JASPER, M.; ASSUMPÇÃO, P. S. M.; ROCIL, J.; GARCIAL. C. Velocidade de
semeadura da soja. Engenharia Agrícola, Jaboticabal, v.31, n.1, p.102-110, 2011.
MARTINS, R. Cultivares de amendoim: um estudo sobre as contribuições da pesquisa pública
paulista. Informações Econômicas, São Paulo, v. 36, n. 5, p. 37-49, 2006.
NAKAGAWA, J.; LASCA, D. C.; NEVES, J. P. S.; NEVES, G. S.; SANCHES, S. V.; BARBOSA, V.; SILVA, M. N.; ROSSETO, C. A. V. Efeito da densidade de semeadura na produção do
OLIVEIRA, T. M. M.; QUEIROGA, R. C. F.; NOGUEIRA, F. P.; MOREIRA, J. N.; SANTOS, M.
A. Produção de cultivares decumbentes de amendoim submetidas a distintos espaçamentos. Revista
Caatinga, Mossoró, v. 23, n. 4, p. 149-154, 2010.
PANOZZO, L. E.; SCHUCH, L. O. B.; PESKE, S. T.; MIELEZRSKI, F.; PESKE, F. B. Comportamento de plantas de soja originadas de sementes de diferentes níveis de qualidade
fisiológica. Revista da FZVA, Uruguaiana, v. 16, n. 1, p. 32-41. 2009.
PIMENTEL-GOMES, F.; GARCIA, C. H. Estatística aplicada a expe rimentos agronômicos e
florestais: exposição com exemplos e orientações para uso de aplicativos. Piracicaba: FEALQ,
2002. 309 p.
SILVA, L. C. L.; RAO, V. R. T. Avaliação de métodos para estimativa de coeficientes da cultura de
amendoim. Revista Brasileira de Engenharia Agrícola e Ambiental, Campina Grande, v. 10, n.
1, p. 128–131, 2005.
SILVA, R. P.; MAHL, D. Relatório do projeto de pesquisa: Pe rdas na colheita mecanizada do
amendoim safra 2007/2008. Jaboticabal: Laboratório de Máquinas e Mecanização Agrícola,
Jaboticabal, 2008. 47p. Relatório de Pesquisa.
SILVA, R. P.; BARROZO, L. M.; SADER, R.; SIMÕES, R. R. Perdas na colheita mecanizada de
amendoim (Arachis hipogaea L.) em Jaboticabal - SP, Brasil. In: CONGRESO ARGENTINO DE
INGENIERÍA RURAL, 10., DEL MERCOSUR, 2., 2009, Rosario. Anais... Rosario: Universidad
Nacional de Rosario, 2009. p. 367-370.
TOLEDO, A.; TABILE, R. A.; GROTTA, D. C. C.; CORTEZ, J. W.; FURLANI, C. E. A. Desempenho de trator agrícola atuando com 5% de biodiesel em operação de semeadura.