Vol.58, n.4: pp. 553-561, July-August 2015 http://dx.doi.org/10.1590/S1516-8913201500287
ISSN 1516-8913 Printed in Brazil
BRAZILIAN ARCHIVES OF BIOLOGY AND TECHNOLOGY
A N I N T E R N A T I O N A L J O U R N A L
Involvement of Transforming Growth Factor Beta-1
(T
GFβ1) Cytokine and FOXP3 Transcription Factor
Genetic Polymorphisms in Hematological Malignancies
Glauco Akelinghton Freire Vitiello
1, Roberta Losi Guembarovski
1, Carlos Eduardo Coral
de Oliveira
1, Marla Karine Amarante
2, Aparecida de Lourdes Perim
2and Maria Angelica
Ehara Watanabe
1*1Departamento de Ciências Patológicas; Universidade Estadual de Londrina; Londrina - PR - Brasil. 2Departamento de Patologia, Análises Clínicas e Toxicológicas; Universidade Estadual de Londrina; Londrina -
PR - Brasil
ABSTRACT
Hematological malignancies (HM) are a group of neoplastic diseases that arise from hematologic cell lineages. Transforming growth factor beta 1 (TGFβ1) is shown to negatively regulate normal and malignant hematopoiesis and, in immunological context, to promote T cell exhaustion and generation of regulatory T cells, which are shown to be deleterious in cancer, by the induction of transcription factor FOXP3 expression. The present study aimed to evaluate TGFB1 exon-1 rs1800470 and FOXP3 intron-1rs2232365 polymorphisms in relation to HM susceptibility. DNA was extracted from blood samples of 43 HM patients and 142 neoplasia-free individuals and polymorphisms were analyzed by allelic-specific PCR. Association analysis was assessed by the Odds Ratio (OR) with significance level of 5%. Regarding FOXP3 polymorphism, no significant differences were observed in genotype or allele distribution among the patients and controls. However, there was a positive association between TGFB1 TT genotype and HM susceptibility (OR = 4.07; CI95% = 1.94 – 8.52). In the combined analysis, a positive association was also observed for TGFB1 TT and FOXP3 GG genotypes (OR = 4.00; CI95% = 1.54 – 10.41) in relation to HM susceptibility. Our results indicated promising new markers to be further investigated in hematological malignancies.
Key words: Hematological malignancies, TGFB1, FOXP3, genetic polymorphism, susceptibility
*Author for correspondence: [email protected]
INTRODUCTION
Hematological malignancies (HM) are a heterogeneous group of neoplastic diseases that arise from hematologic cell lineages and in which chromosomal abnormalities, such as translocations, deletions and inversions, are frequently seen (Chen and Sandberg 2002). Accounting for ~9% of total cancers in men and ~7% of women cancers, HM are the fourth cancer
most frequently diagnosed worldwide (Smith et al. 2010).
microenvironment also provides a favorable milieu for malignant cells proliferation and survival (Ayala et al. 2009).
Transforming growth factor beta (TGFβ), member of the TGFβ superfamily of growth factors, is a pleiotropic cytokine, which regulates cell growth and differentiation in several physiological and pathological conditions in a context-dependent manner. There are three isoforms of TGFβ, namely TGFβ1, TGFβ2 and TGFβ3, of which TGFβ1 is the most abundant. All isoforms activate intracellular receptor-regulated Smads (R-Smads: Smad2 and Smad3) through interaction with TGFβ receptors (TβRI and TβRII) and thereby regulate cells’ gene expression profile and phenotype (Kubiczkova et al. 2012).
TGFβ1 is mapped on locus 19q13.1 and presents some genetic polymorphisms. A single nucleotide polymorphism (SNP), rs1800470, was firstly identified as a T to C transition at position 29 in TGFβ1 mRNA, promoting a leucine to proline change at codon 10, which was contained within the signal peptide sequence of this cytokine. However, in a recent update in NCBI SNP database, C allele (encoding proline) was considered to be the ancestral allele. Previous studies have demonstrated that this allele is associated with higher TGFβ1 levels in serum (Suthanthiran et al. 2000; Yokota et al. 2000; Yamada 2001) and higher TGFβ1 secretion in cell culture (Dunning et al. 2003) when compared to T allele. This polymorphism was investigated in breast by Oda et al. (2012) and oral cancer by Carneiro et al. (2013) and by several others in diverse solid cancers, but has been poorly investigated in HM.
In hematological scenario, TGFβ1 is shown to be a potent inhibitor of hematopoiesis (Soderberg et al. 2009; Blank and Karlsson 2011), inducing cell cycle arrest and apoptosis in normal and even in some malignant hematopoietic cells lineages (Tvrdik et al. 2006; Wu et al. 2009; Bakhshayesh et al. 2012; Spender et al. 2013). Nevertheless, it has been demonstrated that many hematological cells employ mechanisms to circumvent cytostatic and apoptotic effects of TGFβ1 (Dong and Blobe 2006), and, in this case, this cytokine is responsible to promote a immunosuppressive environment by suppressing effector TH cells and
inducing naïve T cells to differentiate into
regulatory T cells (Tregs) (Yang et al. 2013), similarly to that which occurs in some solid tumors (Massague 2008; Yang et al. 2010; Kubiczkova et al. 2012).
Tregs are major players in maintaining the immunological tolerance to self-antigens and in limiting the excessive and harmful immune responses. Beyond CD4, these cells express the molecular markers CD25 (the alpha receptor of IL-2) and the transcription factor FOXP3 (Forkhead Box P3), which is essential for their generation and immunosuppressive functions and is directly up regulated by TGFβ signaling. In cancer context, the presence of Treg cells in tumor microenvironment has been associated with poor prognosis and worst clinical outcomes (Adeegbe and Nishikawa 2013;Ondondo et al. 2013; Sahin et al. 2013). In some HM, Tregs increase in circulation and are present in metastatic foci (Ishida et al. 2006; Haas et al. 2008; Wu et al. 2012).
FOXP3 gene is located at the short arm (p) of X chromosome and presents complex mechanisms of expression regulation, in which conserved non-coding sequences (CNS) in intronic regions are capable to bind transcriptional factors and actuate in concert with FOXP3 promoter (Zheng et al. 2010; Maruyama et al. 2011). Polymorphisms in these regions could affect binding capability for transcription factors and, hence, FOXP3 expression and Treg function (Oda et al. 2013). Among the polymorphisms described in regulatory regions of FOXP3, rs2232365 (A to G) has been associated with immunologic diseases such as vitiligo (Song et al. 2013) and psoriasis (Song et al. 2012), highlighting its importance in Treg function, but has been poorly investigated in cancers.
MATERIAL AND METHODS
Human Subjects and Sample Collection
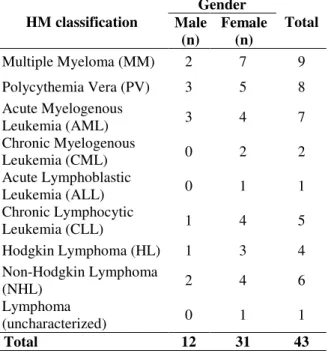
Blood samples were obtained from 43 patients (31 women and 12 men) with hematological malignancies. Sample collection was carried at the Cancer Hospital of Londrina or at the University Hospital of Londrina during the routine medical care of these patients. Diagnosis was carried out in these same centers by experienced hematologists, and HM classification was made according to the World Health Organization (WHO) Classification of Tumors of Hematopoietic and Lymphoid Tissue (Swerdlow 2008), combining clinical, morphological, molecular and immunophenotyping data. HM included in the study and their relative sample size divided by the gender are listed in Table 1. For the association study, blood samples from 142 neoplasia-free individuals (118 women and 24 men) were collected at the Blood Bank of Londrina in the same geographic region. Genetic polymorphisms were assessed in a southern Brazilian population, composing mostly of European descendants (Caucasians). The research protocol was approved by the institutional Human Research Ethics Committee of State University of Londrina (CAAE 0164.0.268.000-09) and, after being informed in detail regarding the study, all the subjects involved in the study signed written term of free informed consent.
Table 1 - Sample classification and gender stratification of 43 HM patients.
HM classification
Gender
Total Male
(n)
Female (n)
Multiple Myeloma (MM) 2 7 9
Polycythemia Vera (PV) 3 5 8 Acute Myelogenous
Leukemia (AML) 3 4 7
Chronic Myelogenous
Leukemia (CML) 0 2 2
Acute Lymphoblastic
Leukemia (ALL) 0 1 1
Chronic Lymphocytic
Leukemia (CLL) 1 4 5
Hodgkin Lymphoma (HL) 1 3 4 Non-Hodgkin Lymphoma
(NHL) 2 4 6
Lymphoma
(uncharacterized) 0 1 1
Total 12 31 43
DNA Extraction
From 200 µL of peripheral blood, DNA extraction was performed using a specific DNA extraction kit acquired from Biopur® (Biometrix, Curitiba, PR, Brazil) according to the manufacturer’s protocol. After extraction, the DNA was quantified at 260 nm in a NanoDrop 2000c® Spectrophotometer (Thermo Scientific, Wilmington, DE, EUA). The 260/280 nm absorbances ratio was used to determine the quality of DNA samples. Samples with ratios lesser than 1.7 were not included.
TGFB1 and FOXP3 Polymorphisms Analyses
For polymorphisms analyses, approximately 100 ng of DNA were amplified by sequence-specific primer polymerase chain reaction (SSP-PCR). PCR was performed using 100 μM total dNTP, 1.5 mM MgCl2, 1X PCR Buffer and 1.25 units of
Taq DNA polymerase (Invitrogen, São Paulo, SP, Brazil).
TGFB1 rs1800470 polymorphism was assessed as previously described (Lee et al. 2005). Allele specific primers were designed based on the TGFB1 gene sequence deposited in the NCBI GenBank, identified by the accession number NG_013364.1. For the T allele, primers were 5’ -GGG CTG CGG CTG CTG CT-3’ (forward) and 5’-GTA GTC GGC CTC AGG CTC GG-3’ (reverse), and for the C allele: 5’-CTC CAC CAC TGC GCC CTT CT-3’ (forward) and 5’-AGC AGC GGT AGC AGCAGC G-3’ (reverse). PCR conditions were 10 min denaturation at 95ºC, 35 cycles of 1 min at 94ºC, 1 min at 69ºC (for T allele) or 65ºC (for C allele), 1 min at 72ºC, and 5 min elongation at 72ºC.
(T allele) and 204 bp (C allele) fragments were amplified (Fig. 1 A), and for FOXP3, 442 bp (A allele) and 427 bp (G allele) fragments were generated (Fig. 1 B).
Figure 1 - Analysis of TGFB1 and FOXP3 polymorphisms. A. Eletrophoretic profile for TGFB1 rs1800470; L: Ladder 100 bp molecular weight marker (InvitrogenTM, Carlsbad, California, USA); TC: Heterozygote individuals; TT: Homozygote individuals for T allele; CC: Homozygote individuals for C allele; Bl.: negative control. B. Eletrophoretic profile for FOXP3 rs2232365 polymorphisms; L: Ladder 100 bp molecular weight marker (InvitrogenTM, Carlsbad, California, USA); GG: Homozygote individuals for G allele; AG: Heterozygote individuals; AA: Homozygote individuals for A allele; Bl: negative control.
Statistical analysis
The case control association study was performed
using contingency tables to calculate the odds ratios (OR) and to perform Fisher’s exact test with a confidence interval (CI) of 95%. Contingency tables (3x2) were constructed, considering ancestral genotype (OR = 1.00) as reference, to determine the OR value for heterozygotes and variant genotypes using GraphPad Prism version 5.00 for Windows (GraphPad Software, San Diego, California, USA). The rare homozygotes and heterozygotes for both the genes were grouped for the presence of at least one allelic variant in the dominant model of analysis.
RESULTS
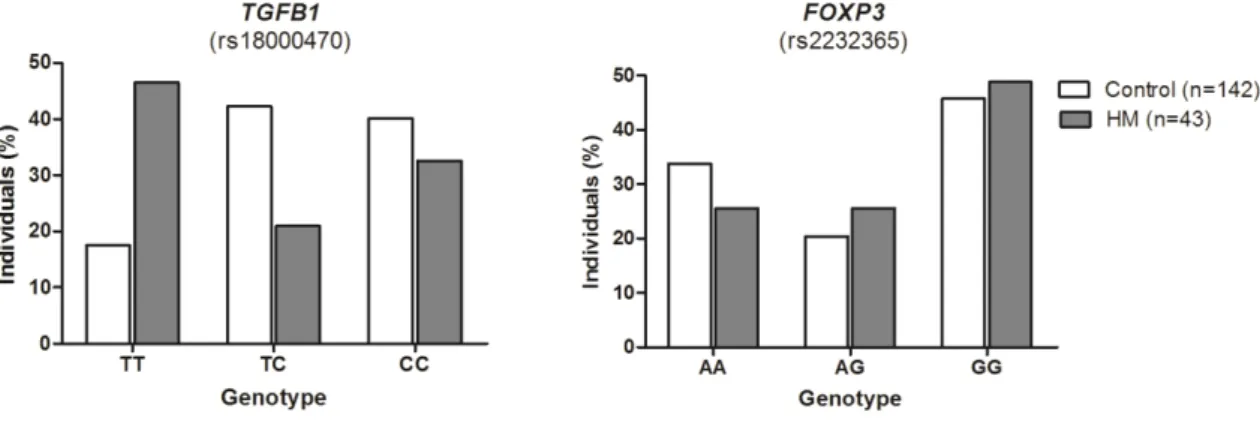
The genotype distribution for both polymorphisms for patients and controls are shown in Figure 2 and Table 2. There was a positive association between TGFB1 rs1800470 TT genotype and HM susceptibility (OR = 4.07; CI95% = 1.94 – 8.52; P = 0.0002), suggesting that individuals with this genotype had more than 4-fold increased chance to develop hematological cancers. The presence of C allele conferred protection against HM development both in the co-dominancy (OR = 0.36; CI95% = 0.16 – 0.81; P = 0.01) and dominancy model of analysis (OR = 0.24; CI95% = 0.12 – 0.51; P = 0.0002) (Table 2).
Regarding FOXP3 rs2232365 polymorphism, no significant differences were observed for genotype or allele distribution among the HM patients and control individuals. However, when the two polymorphisms were analyzed simultaneously, a positive association was observed for TGFB1 TT and FOXP3 GG genotypes (OR = 4.00; CI95% = 1.54 – 10.41; P = 0.009) (Table 2).
Table 2 - Case-control association analysis for TGFB1and FOXP3 polymorphisms in whole sample.
Polymorphism Genotype Patients (n=43) Controls (n=142) OR (CI95%) P value
TGFB1
rs1800470
CC 14 (32.56%) 57 (40.14%) 1.00 -
CT 9 (20.93%) 60 (42.25%) 0.36 (0.16 – 0.81) 0.01**
TT 20 (46.51%) 25 (17.6%) 4.07 (1.94 – 8.52) < 0.001***
TC + TT 29 (67.44%) 85 (59.85%) 1.44 (0.68 - 2.86) 0.47
TC + CC 23 (53.49%) 117 (82.39%) 0.24 (0.12 - 0.51) < 0.001***
FOXP3
rs2232365
AA 11 (25.58%) 48 (33.80%) 1.00 -
AG 11 (25.58%) 29 (20.42%) 1.13 (0.60 – 2.97) 0.53
GG 21 (48.84%) 65 (45.77%) 1.13 (0.57 – 2.24) 0.73
AG + GG 32 (74.42%) 94 (66.20%) 1.51 (0.68 – 3.34) 0.35
Combined Analysis TGFB1 + FOXP3
C – G 17 (39.53%) 80 (56.34%) 0.51 (0.22 – 1.02) 0.06
CC – GG 7 (16.28%) 62 (43.66%) 0.87 (0.35 – 2.16) 1.00
T – G 22 (51.16%) 57 (40.14%) 1.56 (0.79 – 3.10) 0.22
TT – GG 10 (23.26%) 10 (7.04%) 4.00 (1.54 – 10.41) < 0.01**
C – A 12 (27.91%) 60 (42.25%) 0.53 (0.25 – 1.11) 0.11
CC - AA 4 (9.30%) 20 (14.08%) 0.62 (0.20 – 1.94) 0.60
T – A 9 (20.93%) 43 (30.28%) 0.61 (0.27 – 1.38) 0.25
TT - AA 5 (11.63%) 12 (8.45%) 1.42 (0.47 – 4.30) 0.55
**: Very significant association (0.001 < P value ≤ 0.01); ***: Extremely significant association (P value ≤ 0.001).
Once FOXP3 gene is mapped on the short arm of X chromosome, male individuals are hemizygous (displaying only one allele) for genetic variants located at this gene. For this reason, a separate analysis was performed comprising only female individuals for the rs2232365 polymorphism, both singly and in combination with TGFΒ1 polymorphism. The association analysis for FOXP3 in female population displayed almost the
same statistical pattern observed in the whole group analysis. There was no association between FOXP3 rs2232365 and HM, but a positive association was observed for TT genotype from TGFB1 and GG genotype from FOXP3 simultaneously in relation to HM susceptibility (OR = 3.81; CI95% = 1.18 – 12.31; P = 0.03) (Table 3).
Table 3 - Case-control association analysis for TGFB1 and FOXP3 polymorphisms in female patients and controls.
Polymorphism Genotype Patients (n=31) Controls (n=118) OR (CI95%) P value
FOXP3
rs2232365
AA 6 (19.35%) 38 (32.2%) 1.00 -
AG 12 (38.71%) 29 (24.58%) 1.94 (0.84 – 4.47) 0.17
GG 13 (41.94%) 51 (43.22%) 0.95 (0.43 – 2.11) 1.00
AG + GG 25 (80.65%) 80 (67.8%) 1.93 (0.75 – 5.23) 0.19
Combined analysis TGFB1 + FOXP3
C – G 13 (41.94%) 70 (59.32%) 0.5 (0.22 – 1.10) 0.10
CC – GG 4 (12.90%) 21 (17.8%) 0.68 (0.22 – 2.16) 0.60
T – G 18 (58.06%) 48 (40.68%) 2.02 (0.91 – 4.50) 0.10
TT – GG 6 (19.36%) 7 (5.9%) 3.81 (1.18 – 12.31) 0.03*
C – A 9 (29.03%) 55 (46.61%) 0.47 (0.20 – 1.10) 0.10
CC – AA 2 (6.45%) 17 (14.41%) 0.41 (0.09 – 1.88) 0.36
T – A 13 (41.94%) 38 (32.20%) 1.52 (0.68 – 3.42) 0.40
TT - AA 3 (9.68%) 9 (7.63%) 1.30 (0.33 – 5.11) 0.71
DISCUSSION
HM is characterized by a clonal expansion of hematologic cell lineages in bone marrow or secondary lymphoid tissues accompanied by a diffuse substitution of normal hematopoietic tissue and impaired hematopoiesis. The search for HM molecular markers in the last decades largely sought for chromosomal aberrations such as translocations, deletions and insertions, which are typical features of this group of diseases (Rowley 2008). These alterations, however, are not observed in all cases of HM, and are not present in germ line cells, being acquired during the transformation stage of pre-leukemic cells, thus restraining their screening as a diagnosis tool (Staudt 2003), and not as a susceptibility predictor. In this context, the search for inherited genetic traits, such as SNPs, that might confer susceptibility for HM or indicate variations in clinical course and therapeutic response of disease could be valuable for HM pathogenesis understanding and provide direct clinical applications.
Considering the importance of tumor microenvironment permissivity and anti-tumor immune responses in cancer development, investigations were carried out whether TGFB1 rs1800470 (C29T; Pro10Leu) and/or FOXP3 rs2232365 polymorphisms were associated with HM susceptibility in a sample from southern Brazil. Previous studies had established TGFβ1 as a potent inhibitor of hematopoiesis by its capability of inducing cell cycle arrest and apoptosis in early hematopoietic stem cells (Isufi et al. 2007; Soderberg et al. 2009). TGFβ1 has also been shown to induce apoptosis and cell cycle arrest in several hematopoietic malignant cells lineages by diverse mechanisms, such as up-regulating the cyclin-dependent kinases (CDK) inhibitor p21 (Tvrdik et al. 2006), apoptosis modulator, p53 up-regulated modulator of apoptosis (PUMA) (Spender et al. 2013), pro-apoptotic mitochondrial protein Bax (Bakhshayesh et al. 2012) and Myc antagonist Mad1 (Wu et al. 2009) while down-regulating anti-apoptotic proteins, such as Bcl-2 and Bcl-xl (Bakhshayesh et al. 2012), and pro-mitogenic transcription factor Myc (Wu et al. 2009). The malignant hematopoietic cells employ several described mechanisms to evade cytostatic effects of TGFβ1, becoming able to grow and spread (Dong and Blobe 2006; Isufi et al. 2007), highlighting the
importance of TGFβ1 signalization in counteract malignant cell proliferation.
However, TGFβ1 levels in HM are likely to vary among HM types and disease stage, making observations in this field seem controversial. While TGFβ1 plasma levels were decreased in the patients with acute leukemia at diagnosis and recurrence and increased in the patients at remission (Chen et al. 1998), the same was not observed in Multiple Myeloma, where TGFβ1 levels were associated only with immunoparesis (low serum immunoglobulins) (Kyrtsonis et al. 1998). Moreover, whereas high circulating TGFβ1 levels in follicular B-cell lymphoma were associated with better clinical outcomes and increased survival (Labidi et al. 2010), TGFβ1 is associated with impaired hematopoiesis and myelofibrosis development in myeloproliferative neoplasms (Martyre 1995; Vannucchi et al. 2005). Furthermore, it is difficult to establish the cause-consequence relationship among the cytokines levels and the development or susceptibility for the diseases (Powers et al. 2007). Thus, the study of polymorphisms directly related with TGFβ1 secretion might be greatly useful to overcome this issue and understand disease pathogenesis, as well as establish molecular disease markers.
In immunological context, TGFβ1 effects rely mainly in suppressing immune responses by inhibiting immune effector cells and inducing T-cell differentiation into regulatory T-T-cells (Tregs), which in tumor microenvironment are responsible for dampen antitumor immune responses and predicts worst clinical outcome. In fact, it has been shown that in non-Hodgkin lymphoma, malignant B-cells are capable of secreting TGFβ1 and induce T-cell exhaustion (Yang et al. 2014) and differentiation into Tregs, creating an immunopermissive microenvironment (Yang et al. 2013).
Indicating Tregs importance on the pathogenesis of HM, Ishida et al (Ishida et al. 2006) demonstrated that Hodgkin Lymphoma cells attracted Tregs to affected lymph nodes. Similarly, Hass et al (2008) had demonstrated that non-Hodgkin Lymphoma metastatic foci in nervous system also recruited Treg cells, and that this recruitment were associated with poor disease prognosis. Studies have shown an increase in circulating Tregs in hematological malignancies such as T- and B-cell acute lymphoblastic leukemia (Wu et al. 2012) and in acute myelogenous leukemia, where Tregs from patients also showed enhanced suppressive capabilities when compared to Tregs from normal controls (Szczepanski et al. 2009).
Transcription factor FOXP3 is essential for Treg immune suppressive functions and polymorphisms in its gene are associated with several diseases (Oda et al. 2013). In the present study, FOXP3 rs2232365 polymorphism, which was previously associated with autoimmune diseases (Song et al. 2012; Song et al. 2013), was assessed in HM patients. Results showed no significant differences in genotype or allelic distribution of this polymorphism among HM patients or HM-free controls in both whole sample and gender-stratified analysis, indicating that this polymorphism did not participate in HM susceptibility. However, further studies with larger and stratified samples are necessary to fully ascertain this polymorphism’s role in HM pathogenesis.
Since carcinogenesis is influenced by several genes, an isolated polymorphic variant has a small effect, thus justifying the analysis of more than one variant in the same study (Norppa 2003). According to Fletcher and Houlston (2010) much of the inherited susceptibility to cancer is likely to result from a polygenic model in which the co-
inheritance of genetic variants, each of which has a modest individual effect and can cause a wide range of risk in population. Thus, the possible association between the co-inheritance of TGFB1 and FOXP3 allelic variants with HM development was evaluated which showed a positive association for HM development when TGFB1 TT genotype were paired with FOXP3 GG genotype, both in the whole sample (OR = 4.00; CI95% = 1.54 – 10.41; P = 0.009) and also in female individuals analysis (OR = 3.81 CI95% = 1.18 - 12.31; P = 0.03). Given the strong association observed and considering TGFβ1 roles in the regulation of normal and malignant hematopoiesis, it was possible to suggest TGFB1 rs1800470 polymorphism as a promising candidate for molecular marker for HM susceptibility to be evaluated in further studies with larger samples, stratified by HM subtypes. It would also be interesting to investigate in depth TGFβ1 levels and its correlation with rs1800470 polymorphism and its clinical relevance in HM subtypes, which could help to elucidate the molecular mechanisms involved. The strong association observed for TGFB1 and FOXP3 polymorphisms simultaneously suggested a possible gene interaction involved in the pathogenesis of hematological cancers. Altogether, the present work indicated two promising candidates for markers in HM to be further investigated in larger and stratified samples.
ACKNOWLEDGEMENTS
The authors would like to acknowledge the volunteers involved in this study, the University Hospital of Londrina, the Cancer Hospital of Londrina and the Blood Center of Londrina. This work was supported by the Conselho Nacional de Desenvolvimento Científico e Tecnológico (CNPq), Coordenação de Aperfeiçoamento de Pessoal de Nível Superior (CAPES), Fundação Araucária (FA) and Pró-Reitoria de Pesquisa e Pós Graduação of State University of Londrina (PROPPG-UEL).
REFERENCES
Ayala F, Dewar R, Kieran M, Kalluri R. Contribution of bone microenvironment to leukemogenesis and leukemia progression. Leukemia. 2009;23(12):2233-2241.
Bakhshayesh M, Zaker F, Hashemi M, Katebi M, Solaimani M. TGF- beta1-mediated apoptosis associated with SMAD-dependent mitochondrial Bcl-2 expression. Clin Lymphoma Myeloma Leuk. 2012;12(2):138-143.
Blank U, Karlsson S. The role of Smad signaling in hematopoiesis and translational hematology.
Leukemia. 2011;25(9):1379-1388.
Carneiro NK, Oda JM, Losi Guembarovski R, Ramos G, Oliveira BV, Cavalli IJ, et al. Possible association between TGF-beta1 polymorphism and oral cancer.
Int J Immunogenet. 2013;40(4):292-298.
Chen Y, Lu L, Wang L. [Study on gene expression of TGF beta 1 and its receptor in leukemia cells and the serum TGF beta 1 level in the patients with acute leukemia]. Zhonghua Xue Ye Xue Za Zhi. 1998;19(11):576-580.
Chen Z, Sandberg AA. Molecular cytogenetic aspects of hematological malignancies: clinical implications.
Am J Med Genet. 2002;115(3):130-141.
Dong M, Blobe GC. Role of transforming growth factor-beta in hematologic malignancies. Blood. 2006;107(12):4589-4596.
Dunning AM, Ellis PD, McBride S, Kirschenlohr HL, Healey CS, Kemp PR, et al. A transforming growth factor beta1 signal peptide variant increases secretion in vitro and is associated with increased incidence of invasive breast cancer. Cancer Res. 2003;63(10):2610-2615.
Fletcher O, Houlston RS. Architecture of inherited susceptibility to common cancer. Nat Rev Cancer. 2010;10(5):353-361.
Haas J, Schopp L, Storch-Hagenlocher B, Fritzsching B, Jacobi C, Milkova L, et al. Specific recruitment of regulatory T cells into the CSF in lymphomatous and carcinomatous meningitis. Blood. 2008;111(2):761-766.
Ishida T, Ishii T, Inagaki A, Yano H, Komatsu H, Iida S, et al. Specific recruitment of CC chemokine receptor 4-positive regulatory T cells in Hodgkin lymphoma fosters immune privilege. Cancer Res. 2006;66(11):5716-5722.
Isufi I, Seetharam M, Zhou L, Sohal D, Opalinska J, Pahanish P, et al. Transforming growth factor-beta signaling in normal and malignant hematopoiesis. J Interferon Cytokine Res. 2007;27(7):543-552. Kubiczkova L, Sedlarikova L, Hajek R, Sevcikova S.
TGF-beta - an excellent servant but a bad master. J Transl Med. 2012;10:183.
Kyrtsonis MC, Repa C, Dedoussis GV, Mouzaki A, Simeonidis A, Stamatelou M, et al. Serum transforming growth factor-beta 1 is related to the degree of immunoparesis in patients with multiple myeloma. Med Oncol. 1998;15(2):124-128.
Labidi SI, Menetrier-Caux C, Chabaud S, Chassagne C, Sebban C, Gargi T, et al. Serum cytokines in follicular lymphoma. Correlation of TGF-beta and VEGF with survival. Ann Hematol. 2010;89(1):25-33.
Lee KM, Park SK, Hamajima N, Tajima K, Yoo KY, Shin A, et al. Genetic polymorphisms of TGF-beta1 & TNF-beta and breast cancer risk. Breast Cancer Res Treat. 2005;90(2):149-155.
Martyre MC. TGF-beta and megakaryocytes in the pathogenesis of myelofibrosis in myeloproliferative disorders. Leuk Lymphoma. 1995;20(1-2):39-44. Maruyama T, Konkel JE, Zamarron BF, Chen W. The
molecular mechanisms of Foxp3 gene regulation.
Semin Immunol. 2011;23(6):418-423.
Massague J. TGFbeta in Cancer. Cell. 2008;134(2):215-230.
Norppa H. Genetic susceptibility, biomarker respones, and cancer. Mutat Res. 2003;544(2-3):339-348. Oda JM, de Oliveira KB, Guembarovski RL, de Lima
KW, da Silva do Amaral Herrera AC, Guembarovski AL, et al. TGF-beta polymorphism and its expression correlated with CXCR4 expression in human breast cancer. Mol Biol Rep. 2012;39(12):10131-10137. Oda JM, Hirata BK, Guembarovski RL, Watanabe MA.
Genetic polymorphism in FOXP3 gene: imbalance in regulatory T-cell role and development of human diseases. J Genet. 2013;92(1):163-171.
Ondondo B, Jones E, Godkin A, Gallimore A. Home sweet home: the tumor microenvironment as a haven for regulatory T cells. Front Immunol. 2013;4:197. Powers MP, Nishino H, Luo Y, Raza A, Vanguri A,
Rice L, et al. Polymorphisms in TGFbeta and TNFalpha are associated with the myelodysplastic syndrome phenotype. Arch Pathol Lab Med. 2007;131(12):1789-1793.
Rowley JD. Chromosomal translocations: revisited yet again. Blood. 2008;112(6):2183-2189.
Sahin M, Sahin E, Koksoy S. Regulatory T cells in cancer: an overview and perspectives on cyclooxygenase-2 and Foxp3 DNA methylation. Hum Immunol. 2013;74(9):1061-1068.
Smith A, Roman E, Howell D, Jones R, Patmore R, Jack A. The Haematological Malignancy Research Network (HMRN): a new information strategy for population based epidemiology and health service research. Br J Haematol. 2010;148(5):739-753. Soderberg SS, Karlsson G, Karlsson S. Complex and
context dependent regulation of hematopoiesis by TGF-beta superfamily signaling. Ann N Y Acad Sci. 2009;1176:55-69.
Song QH, Shen Z, Xing XJ, Yin R, Wu YZ, You Y, et al. An association study of single nucleotide polymorphisms of the FOXP3 intron-1 and the risk of Psoriasis vulgaris. Indian J Biochem Biophys. 2012;49(1):25-35.
Spender LC, Carter MJ, O'Brien DI, Clark LJ, Yu J, Michalak EM, et al. Transforming growth factor-beta directly induces p53-up-regulated modulator of apoptosis (PUMA) during the rapid induction of apoptosis in myc-driven B-cell lymphomas. J Biol Chem. 2013;288(7):5198-5209.
Staudt LM. Molecular diagnosis of the hematologic cancers. N Engl J Med. 2003;348(18):1777-1785. Suthanthiran M, Li B, Song JO, Ding R, Sharma VK,
Schwartz JE, et al. Transforming growth factor-beta 1 hyperexpression in African-American hypertensives: A novel mediator of hypertension and/or target organ damage. Proc Natl Acad Sci U S A. 2000;97(7):3479-3484.
Swerdlow SH. WHO classification of tumours of haematopoietic and lymphoid tissues: World Health Organization; 2008.
Szczepanski MJ, Szajnik M, Czystowska M, Mandapathil M, Strauss L, Welsh A, et al. Increased frequency and suppression by regulatory T cells in patients with acute myelogenous leukemia. Clin Cancer Res. 2009;15(10):3325-3332.
Tvrdik D, Dundr P, Povysil C, Pytlik R, Plankova M. Up-regulation of p21WAF1 expression is mediated by Sp1/Sp3 transcription factors in TGFbeta1-arrested malignant B cells. Med Sci Monit. 2006;12(7):BR227-234.
Vannucchi AM, Bianchi L, Paoletti F, Pancrazzi A, Torre E, Nishikawa M, et al. A pathobiologic pathway linking thrombopoietin, GATA-1, and TGF-beta1 in the development of myelofibrosis. Blood. 2005;105(9):3493-3501.
Wu CP, Qing X, Wu CY, Zhu H, Zhou HY. Immunophenotype and increased presence of CD4(+)CD25(+) regulatory T cells in patients with acute lymphoblastic leukemia. Oncol Lett. 2012;3(2):421-424.
Wu S, Hultquist A, Hydbring P, Cetinkaya C, Oberg F, Larsson LG. TGF-beta enforces senescence in Myc-transformed hematopoietic tumor cells through induction of Mad1 and repression of Myc activity.
Exp Cell Res. 2009;315(18):3099-3111.
Yamada Y. Association of polymorphisms of the transforming growth factor-beta1 gene with genetic susceptibility to osteoporosis. Pharmacogenetics. 2001;11(9):765-771.
Yang L, Pang Y, Moses HL. TGF-beta and immune cells: an important regulatory axis in the tumor microenvironment and progression. Trends Immunol. 2010;31(6):220-227.
Yang ZZ, Grote DM, Xiu B, Ziesmer SC, Price-Troska TL, Hodge LS, et al. TGF-beta upregulates CD70 expression and induces exhaustion of effector memory T cells in B-cell non-Hodgkin's lymphoma.
Leukemia. 2014.
Yang ZZ, Grote DM, Ziesmer SC, Xiu B, Yates NR, Secreto FJ, et al. Soluble and membrane-bound TGF-beta-mediated regulation of intratumoral T cell differentiation and function in B-cell non-Hodgkin lymphoma. PLoS One. 2013;8(3):e59456.
Yokota M, Ichihara S, Lin TL, Nakashima N, Yamada Y. Association of a T29-->C polymorphism of the transforming growth factor-beta1 gene with genetic susceptibility to myocardial infarction in Japanese.
Circulation. 2000;101(24):2783-2787.
Zheng Y, Josefowicz S, Chaudhry A, Peng XP, Forbush K, Rudensky AY. Role of conserved non-coding DNA elements in the Foxp3 gene in regulatory T-cell fate. Nature. 2010;463(7282):808-812.